

Variable speed-limit control before expressway mainline toll station
-
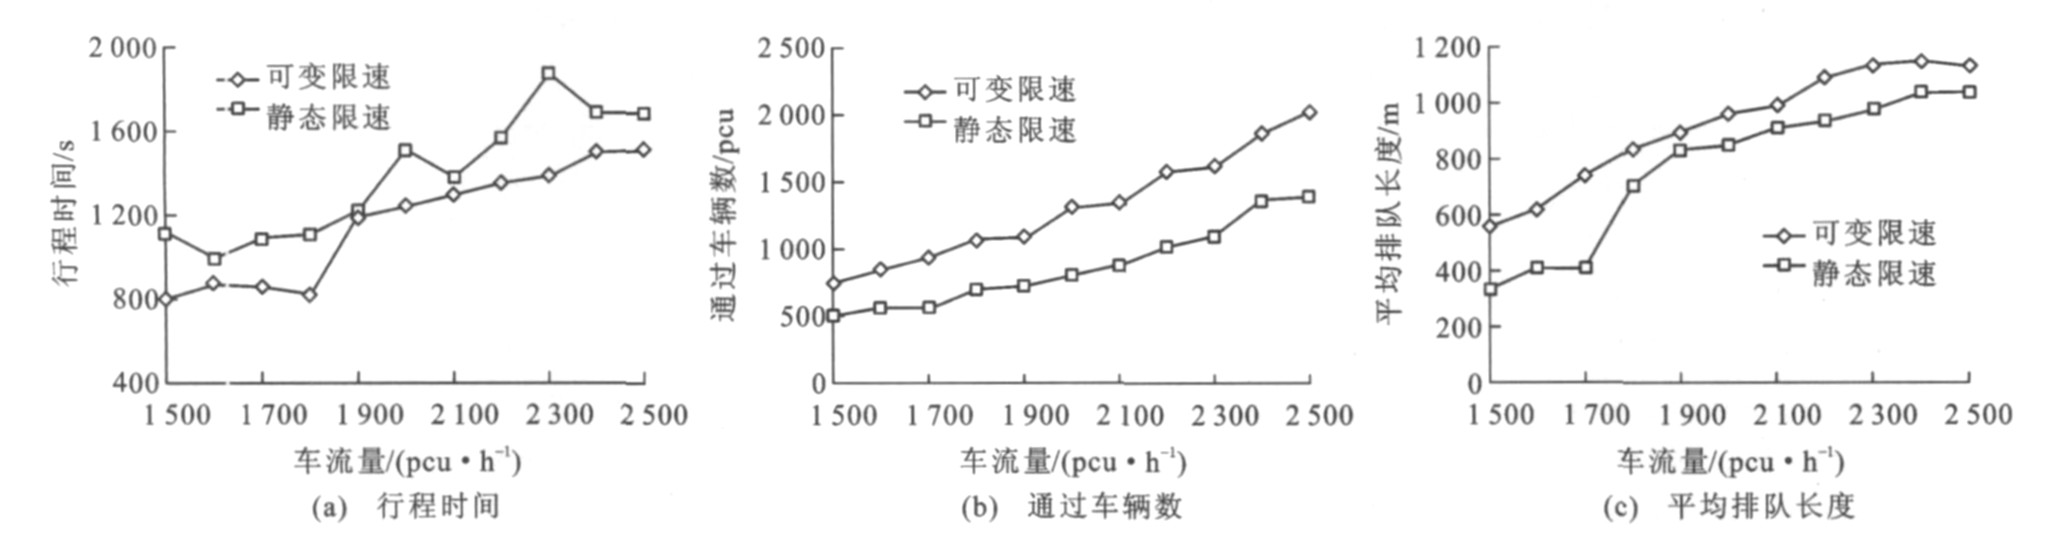
摘要: 以事故率最小为目标, 以费用与速度限制为约束条件, 建立可变限速控制优化模型, 确定可变信息板数目与相应的可变限速值。采用交通波理论模型计算可变信息板设置间距, 并利用Vissim仿真软件对模型进行验证。利用不同交通流量下的单向双车道6个收费窗口的高速公路, 进一步模拟可变限速控制与静态限速控制。试验结果表明: 在高速公路主线收费站排队广场前应设4块可变信息板, 设置间距分别为1 293、2 695、4 056m, 仿真结果与交通波理论模型计算值的相对误差最小为3.9%, 最大为9.5%;可变限速控制中, 通过车辆数较静态限速控制增长51.82%, 行程时间与排队长度分别平均缩短15.81%、18.98%, 验证了本文设计体系的合理性。Abstract: An optimization model of variable speed-limit control with the object of the least accident rate and the limitations of cost and speed was set up, in which the number of variable message signs and corresponding variable limit speeds were determined. The distances between variable message signs were computed by using the traffic wave model, and the optimization model was verified by using the simulation software Vissim. For different traffic flows, variable speed-limit control and static speed-limit control were simulated on the expressway with two-lanes and six toll windows in single direction. Analysis result shows that when 4 variable message signs with setting separation distances of 1 293, 2 695 and 4 056 m apart are installed before the queuing square of expressway mainline toll station, the minimum relative error between simulation result and calculated values of traffic wave model is 3.9%, and the maximum is 9.5%. Compared with static speed-limit control, passing vehicle number in variable speed-limit control rises by 51.82%, average travel time and queue length decrease by 15.81% and 18.98% respectively, which proves that the model is reasonable.
-
表 1 不同信息板数目对应的综合事故率与限速值
Table 1. C and vifor different message sign numbers
n/块 1 2 3 4 5 6 7 8 9 10 C/(10-6次·pcu-1·km-1) 8.80 1.51 0.93 0.76 0.68 0.63 0.59 0.57 0.56 0.55 vi/(km·h-1) 15 70, 10 90, 60, 15 100, 70, 40, 15 100, 80, 60, 40, 10 100, 80, 60, 40, 20, 10 110, 90, 80, 60, 40, 20, 10 110, 100, 90, 80, 70, 50, 30, 15 110, 100, 100, 90, 80, 70, 50, 30, 10 110, 100, 90, 80, 60, 50, 40, 30, 20, 10  下载: 导出CSV
表 4 各检测器附近的Ti
Table 4. Tinearby each detector h
T1 T2 T3 T4 0.250 000 0.153 846 0.071 006 0.021 848
下载: 导出CSV
表 5 各控制分区长度
Table 5. Length of each control zone m
l1 l2 l3 l4 ≥5 000+210=5 210 ≥3 846+210=4 056 ≥2 485+210=2 695 ≥1 083+210=1 293
下载: 导出CSV
表 6 Vissim仿真参数
Table 6. Vissim simulation parameters
仿真时间/s 数据记录间隔/s 排队广场长度/m 单向双车道高峰流量/(pcu·h-1) 高峰流量持续时间/s 6窗口收费站服务率/(pcu·h-1) 车种结构/% 小汽车 中型车 大型车 3 600 50 170 3 900 1 200 2 570 75 20 5
下载: 导出CSV
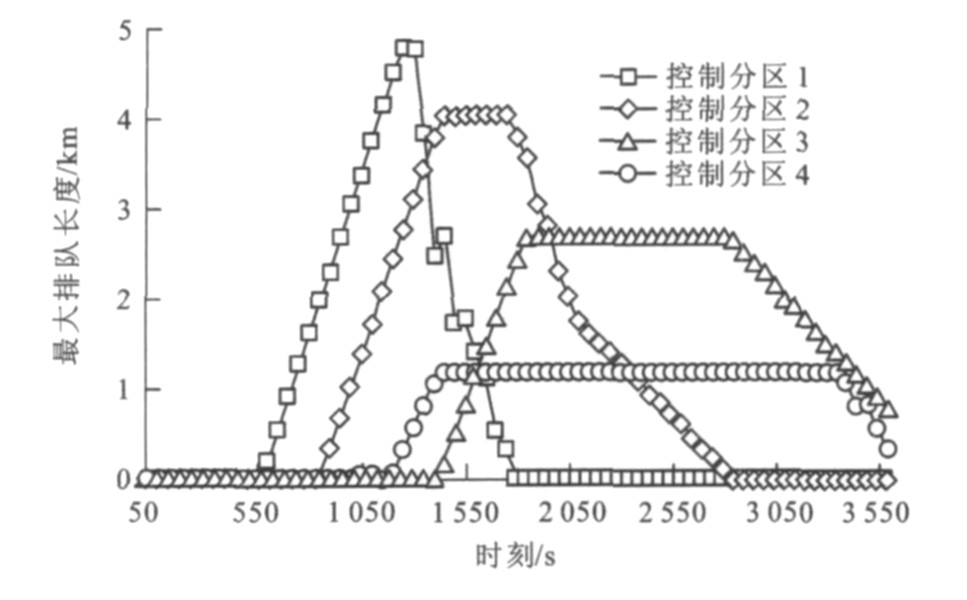
表 7 交通波模型与模拟的排队长度
Table 7. Queue lengths of traffic wave model and simulation
控制分区 1 2 3 4 计算排队长度/m 5 000 3 846 2 485 1 083 仿真排队长度/m 4 811 4 069 2 709 1 198 相对误差/% 3.90 5.40 8.20 9.50
下载: 导出CSV
表 8 两种限速控制的Vissim仿真参数
Table 8. Vissim simulation parameters of 2 speed-limit controls
控制方法 数据记录间隔/s 路段和排队广场长度/m 单向流量变动范围/(pcu·h-1) 流量持续时间/s 仿真时间/s 6窗口收费站服务率/(pcu·h-1) 车种结构/% 小汽车 中型车 大型车 可变限速 50 8 000, 170 1 500~2 500 3 600 3 600 2 500 65 25 10 静态限速 50 8 000, 170 1 500~2 500 3 600 3 600 2 500 65 25 10
下载: 导出CSV
-
[1] 李嘉, 方霞. 高速公路出入口设计与安全性研究[J]. 中南公路工程, 2003, 28(2): 31-34. https://www.cnki.com.cn/Article/CJFDTOTAL-ZNGL200302009.htmLI Jia, FANG Xia. Study on design and safety of freeway exit and entrance[J]. Central South Highway Engineering, 2003, 28(2): 31-34. (in Chinese). https://www.cnki.com.cn/Article/CJFDTOTAL-ZNGL200302009.htm [2] 林小涵, 关宏志. 公路收费站ETC系统改造项目经济费用效益计算方法的研究[J]. 公路, 2012, 6(6): 156-163. https://www.cnki.com.cn/Article/CJFDTOTAL-GLGL201206037.htmLIN Xiao-han, GUAN Hong-zhi. A study on economic cost-benefit analysis method for ETC improvement project of high-way toll station[J]. Highway, 2012, 6(6): 156-163. (in Chinese). https://www.cnki.com.cn/Article/CJFDTOTAL-GLGL201206037.htm [3] GB 5768.3—2009, 道路交通标志和标线[S].GB 5768.3—2009, road traffic signs and markings[S]. (in Chinese). [4] 王薇, 杨兆升, 赵丁选. 有限阶段马尔可夫决策的可变限速控制模型[J]. 交通运输工程学报, 2011, 11(5): 109-114. http://transport.chd.edu.cn/article/id/201105017WANG Wei, YANG Zhao-sheng, ZHAO Ding-xuan. Control model of variable speed limit based on finite horizon Markov decision-making[J]. Journal of Traffic and Transportation Engineering, 2011, 11(5): 109-114. (in Chinese). http://transport.chd.edu.cn/article/id/201105017 [5] SHI Hua-jing, ZILIASKOPOULOS A. Traffic flow control using variable speed limits[C]∥ASCE. Proceedings of the Conference on Traffic and Transportation Studies. Guilin: ASCE, 2002: 658-665. [6] 牛树云, 刘浩, 冯建刚, 等. 基于模糊约束的可变信息板点位布设优化[J]. 系统工程, 2010, 28(3): 98-102. https://www.cnki.com.cn/Article/CJFDTOTAL-GCXT201003016.htmNIU Shu-yun, LIU Hao, FENG Jian-gang, et. al. The opti-mization of the planning and positioning of VMS based on fuzzy constrained conditions[J]. Systems Engineering, 2010, 28(3): 98-102. (in Chinese). https://www.cnki.com.cn/Article/CJFDTOTAL-GCXT201003016.htm [7] 尚华艳, 黄海军, 高自友. 基于元胞传输模型的可变信息标志选址问题研究[J]. 物理学报, 2007, 56(8): 4342-4347. doi: 10.3321/j.issn:1000-3290.2007.08.006SHANG Hua-yan, HUANG Hai-jun, GAO Zi-you. Locating the variable message signs by cell transmission model[J]. Acta Physica Shinic, 2007, 56(8): 4342-4347. (in Chinese). doi: 10.3321/j.issn:1000-3290.2007.08.006 [8] CHIU Y C, HUYNH N. Location configuration design for dynamic message signs under stochastic incident and ATISscenarios[J]. Transportation Research Part C: Emerging Technologies, 2007, 17(1): 33-50. [9] ABDEL-ATY M, CUNNINGHAM R J, GAYAH V V, et al. Dynamic variable speed limit strategies for real-time crash risk reduction on freeways[J]. Transportation Research Record Journal of the Transportation Reseach Board, 2008(2078): 108-116. [10] 钟连德, 孙小端, 陈永胜, 等. 高速公路V/C与事故率关系研究[J]. 北京工业大学学报, 2007, 33(1): 37-40. https://www.cnki.com.cn/Article/CJFDTOTAL-BJGD200701008.htmZHONG Lian-de, SUN Xiao-duan, CHEN Yong-sheng, et al. Research on the relationship between V/Cand crash rate on freeway[J]. Journal of Beijing University of Technology, 2007, 33(1): 37-40. (in Chinese). https://www.cnki.com.cn/Article/CJFDTOTAL-BJGD200701008.htm [11] 侯典建, 孙小端, 贺玉龙. 高速公路车速离散性与事故率的关系研究[J]. 交通标准化, 2010(224): 70-72. https://www.cnki.com.cn/Article/CJFDTOTAL-JTBH201013020.htmHOU Dian-jian, SUN Xiao-duan, HE Yu-long. Relationship between speed difference and crash rate on freeway[J]. Transport Standardization, 2010(224): 70-72. (in Chinese). https://www.cnki.com.cn/Article/CJFDTOTAL-JTBH201013020.htm [12] 钟连德, 孙小端, 陈永胜, 等. 高速公路大、小车速度差与事故率的关系[J]. 北京工业大学学报, 2007, 33(2): 185-188. https://www.cnki.com.cn/Article/CJFDTOTAL-BJGD200702015.htmZHONG Lian-de, SUN Xiao-duan, CHEN Yong-sheng, et al. The Relationships between crash rates and average speed difference between cars and large vehicles on freeway[J]. Journal of Beijing University of Technology, 2007, 33(2): 185-188. (in Chinese). https://www.cnki.com.cn/Article/CJFDTOTAL-BJGD200702015.htm [13] 田根平. 高等级公路收费站通行能力评价研究[D]. 昆明: 昆明理工大学, 2008.TIAN Gen-ping. Evaluation studies on traffic capacity of highlevel highway toll station[D]. Kunming: Kunming University of Science and Technology, 2008. (in Chinese). [14] 孔惠惠, 秦超, 李新波, 等. 交通事故引起的排队长度及消散时间的估算[J]. 铁道运输与经济, 2005, 27(5): 65-67. https://www.cnki.com.cn/Article/CJFDTOTAL-TDYS200505027.htmKONG Hui-hui, QIN Chao, LI Xin-bo, et al. Estimation of queue length and dispersing time caused by traffic accident[J]. Railway Transport and Economy, 2005, 27(5): 65-67. (in Chinese). https://www.cnki.com.cn/Article/CJFDTOTAL-TDYS200505027.htm -

 点击查看大图

计量
- 文章访问数: 1123
- HTML全文浏览量: 187
- PDF下载量: 2418
- 被引次数: 0
