

Distribution strategy and leasing strategy in the environment of inland empty container transportation
-
摘要: 以内陆集装箱运输系统为例, 将空箱调运策略与租箱策略融合在一起, 构造了相应的优化决策模型, 并借助数字仿真技术, 揭示了策略运用过程中所蕴涵的内在规律, 即运输成本、存储成本和租箱成本等各类经济参数之间的比例关系, 是决定租箱和调箱策略是否应用的关键Abstract: This paper developed the comprehensive model to optimize the distribution of the empty container in inland transportation system, in which both distribution strategy and leasing strategy have been considered. Then the simulation has been given to explore the internal rule existing in the procedure of decision making. The results show that the relationship among various kinds of costs will determine the choice of two different strategies.
-
Key words:
- empty container distribution /
- leasing container /
- simulation
-

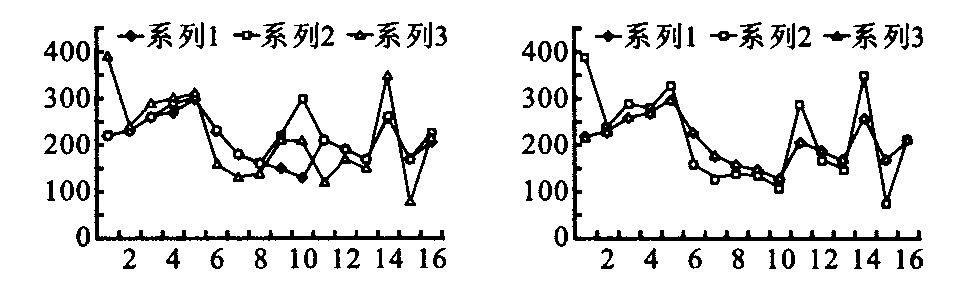
图 2 高运输成本下的各点需求量、保有量及租箱和调运量之和的相关关系
Figure 2. The relationship between the demand, inventory quantities and the decision variables

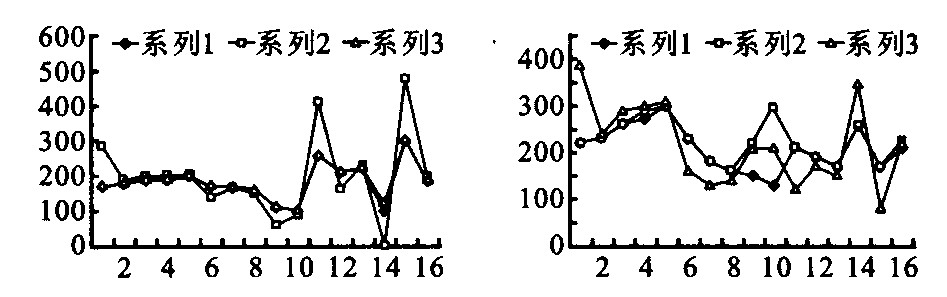
图 3 低运输成本下的各点需求量、保有量及租箱和调运量之和的相关关系
Figure 3. The relationship between the demand, inventory quantities and the decision variables
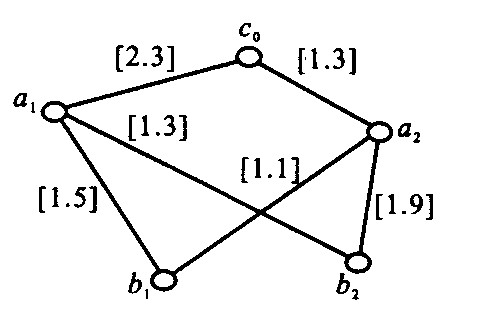
表 1 运输网络各点空箱的需求与供应
Table 1. The demand and supply of empty containers in each point
第1~10 d 第11~20 d 第21~30 d c0 200 300 200 a1 150/-120 100/-120 150/-130 a2 100/-50 80/-60 100/-50 b1 -120 -120 -130 b2 -100 -120 -110 注: 正数表示供应; 负数表示需求。  下载: 导出CSV
表 2 成本参数
Table 2. The parameters of cost
租箱 存储 N1 1000 10 N2 A1 2000 15 A2 2000 20 N3 B1 3000 25 B2 3000 30
下载: 导出CSV
表 3 仿真结果(一)
Table 3. Simulation result (No.1)
调箱量 天数 1 2 3 4 5 6 7 8 9 10 11 12 13 14 15 16 17 18 19 20 21 22 23 24 25 26 27 28 29 30 c0→a1 0 0 0 0 0 0 0 0 0 0 0 0 0 0 0 0 0 0 0 0 0 0 0 0 0 0 0 0 0 0 c0→a2 0 0 0 0 0 0 0 0 0 0 0 0 0 0 0 0 0 0 0 0 0 0 0 0 0 0 0 0 0 0 c0→a1 0 0 0 0 0 0 0 0 0 0 0 0 0 0 0 0 0 0 0 0 0 0 0 0 0 0 0 0 0 0 c0→a2 0 0 0 0 0 0 0 0 0 0 0 0 0 0 0 0 0 0 0 0 0 0 0 0 0 0 0 0 0 0 c0→b1 0 0 0 0 0 0 0 0 0 0 0 0 0 0 0 0 0 0 0 0 0 0 0 0 0 0 0 0 0 0 c0→b2 0 0 0 0 0 0 0 0 0 0 0 0 0 0 0 0 0 0 0 0 0 0 0 0 0 0 0 0 0 0 a1→b1 0 0 0 0 0 0 0 0 0 0 0 0 0 0 0 0 0 0 0 0 0 0 0 0 0 0 0 0 0 0 a1→b2 0 0 0 0 0 0 0 0 0 0 0 0 0 0 0 0 0 0 0 0 0 0 0 0 0 0 0 0 0 0 a2→b1 0 0 0 0 0 0 0 0 0 0 0 0 0 0 0 0 0 0 0 0 0 0 0 0 0 0 0 0 0 0 a2→b2 0 0 0 0 0 0 0 0 0 0 0 0 0 0 0 0 0 0 0 0 0 0 0 0 0 0 0 0 0 0 a1→b1 0 0 0 0 0 0 0 0 0 0 0 0 0 0 0 0 0 0 0 0 0 0 0 0 0 0 0 0 0 0 a1→b2 0 0 0 0 0 0 0 0 0 0 0 0 0 0 0 0 0 0 0 0 0 0 0 0 0 0 0 0 0 0 a2→b1 0 0 0 0 0 0 0 0 0 0 0 0 0 0 0 0 0 0 0 0 0 0 0 0 0 0 0 0 0 0 a2→b2 0 0 0 0 0 0 0 0 0 0 0 0 0 0 0 0 0 0 0 0 0 0 0 0 0 0 0 0 0 0 租箱量 c0 0 0 0 0 0 0 0 0 0 0 0 0 0 0 0 0 0 0 0 0 0 0 0 0 0 0 0 0 0 a1 0 0 0 0 0 0 0 0 0 0 0 0 0 0 0 0 0 0 0 0 0 0 0 0 0 0 0 0 0 0 a2 0 0 0 0 0 0 0 0 0 0 0 0 0 0 0 0 0 0 0 0 0 0 0 0 0 0 0 0 0 0 b1 190 120 120 120 120 120 120 120 120 120 120 120 120 120 120 120 120 120 120 120 140 130 130 130 130 130 130 130 130 130 b2 150 100 100 100 100 100 100 100 100 100 140 120 120 120 120 120 120 120 120 120 100 110 110 110 110 110 110 110 110 110
下载: 导出CSV
表 4 仿真结果(二)
Table 4. Simulation result (No.2)
运输成本 调箱量 c0-a1 c0-a2 c0-b1 c0-b2 a1-b1 a1-b2 a2-b1 a2-b2 c0-a1 c0-a2 c0-b1 c0-b2 a1-b1 a1-b2 a2-b1 a2-b2 18400 10400 19200 25600 12000 10400 8800 15200 0 0 0 0 0 0 0 0 14720 8320 15360 20480 9600 8320 7040 12160 0 0 0 0 0 0 0 0 11040 6240 11520 15360 7200 6240 6280 9120 0 0 0 0 0 0 0 0 7360 4160 7680 10240 4800 4160 3520 6080 0 0 0 0 0 0 10 0 3680 2080 3840 5120 2400 2080 1760 3040 0 0 0 0 0 9 43 0 1840 1040 1920 2560 1200 1040 880 1520 0 14 100 71 0 9 26 30 920 520 960 1280 600 520 440 760 0 15 100 71 0 11 26 31 184 104 192 256 120 104 88 152 3 15 97 70 0 15 29 27
下载: 导出CSV
表 5 仿真结果(三)
Table 5. Simulation result (No.3)
y (c0) q (c0) y (a1) q (a1) c0-a1 y (a2) q (a2) c0-a2 0 3817 0 288 0 0 720 0 0 3817 0 288 0 0 720 0 0 3817 0 288 0 0 720 0 0 3817 0 288 0 0 440 0 0 3817 0 179 0 0 56 0 0 963 0 178 0 0 56 14 0 963 2.0 179 0 0 57 15 0 1016 3.2 132 3 0 60 15 注: q表示存箱量, y表示租箱量, **—**表示空箱调运量, 下同。
下载: 导出CSV
表 6 仿真结果(四)
Table 6. Simulation result (No.4)
y (b1) q (b1) c0-b1 a1-b1 a2-b1 126 0 0 0 126 123 0 0 0 126 123 0 0 0 116 123 0 0 10 84 123 0 0 43 0 123 100 0 26 0 123 100 0 26 0 128 97 0 29 y (b2) q (b2) c0-b2 a1-b2 a2-b2 112 0 0 0 112 110 0 0 0 112 110 0 0 0 112 110 0 0 0 103 110 0 9 0 2 110 71 9 30 0 110 71 11 31 0 110 70 15 27
下载: 导出CSV
表 7 仿真结果(五)
Table 7. Simulation result (No.5)
q (a2) OUT (a2) IN (a2) q (b1) IN (b1) q (b2) IN (b2) 720 -30 0 123 126 110 112 720 -30 0 123 126 110 112 720 -30 0 123 126 110 112 440 -30 0 123 126 110 112 56 -21 0 123 127 110 112 56 -21 14 123 126 110 112 57 -19 15 123 126 110 112 60 -15 15 128 126 110 112 注: IN表示空箱供应量, OUT表示空箱输出量。
下载: 导出CSV
-
[1] WhiteWW, BomberswltAM. Anetwork algorithm for empty freight car allocation[J]. IBM System Journal, 1969, 8(2): 147-169. doi: 10.1147/sj.82.0147 [2] Jordan W, Turnguist M. A stochastic dynamic network model for rational car distribution[J]. Transportation Science, 1983, 17(2): 123-145. doi: 10.1287/trsc.17.2.123 [3] Shen W S, Khoong C M. A DSS for empty container distribution planning[J]. Decision Support System, 1995, 15(1): 75-82. doi: 10.1016/0167-9236(94)00037-S [4] Kaj Holmmberg, Martin Joborn, Lundgr T. Improved empty freight car distribution[J]. Transportation Science, 1998, 32(2): 163-173. doi: 10.1287/trsc.32.2.163 [5] Teoor Gabriel Crainic, Michel Gendreau, Pierre Dejax. Dynamic and stochastic models for the allocation of empty containers[J]. Journal of the Operational Research Society, 1992, 43(10): 102-126. [6] Shtnya Kikuchi. Empty freight car dispatching model under freight car pool concept[J]. Transport Res-B, 1985, 19B(3): 169-195. [7] Beaujon G J, Turnguist M A. A model for fleet sizing and vehicle allocation[J]. Transportation Science, 1991, 25(1): 19-45. doi: 10.1287/trsc.25.1.19 [8] William C Jordan, Mark A Turnguist, Stochastic A. Dynamic network model for railroad car distribution[J]. Transportation Science, 1983, 17(2): 123-144. doi: 10.1287/trsc.17.2.123 -

 点击查看大图
计量
- 文章访问数: 394
- HTML全文浏览量: 162
- PDF下载量: 211
- 被引次数: 0
