

Research on trip distance distribution model and parameter
-
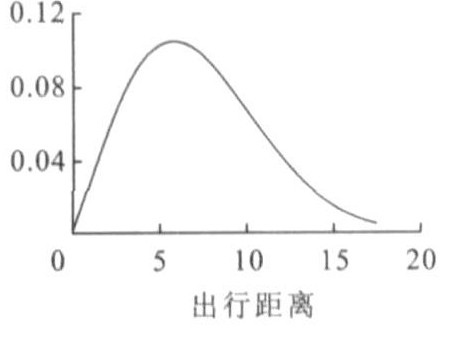
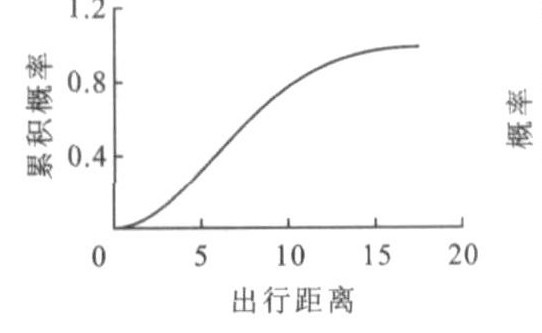
摘要: 为研究城市交通规划中出行距离的分布特征, 在一定假设条件下, 运用概率统计理论推导出行距离的概率分布函数形式, 用10座城市的居民出行资料对其进行拟合, 验证了该假设条件的合理性, 分析了函数参数的相关影响因素, 如城市规模、城市形状和交通结构等, 对其进行量化与非线性回归, 得到出行距离的概率分布函数的一般形式, 最后, 就不同规模城市分析了分布函数参数的取值范围。研究结果表明: 出行距离的分布符合瑞利分布, 特大城市和大中城市分布函数参数的取值范围分别为0.035~0.076和0.042~0.100。Abstract: To study the trip distance distribution character in urban traffic planning, trip distance distribution function was analyzed by using probability theory and statistics theory under some hypothesis conditions, and was fitted by using resident trip data of ten cities, the rationality of hypothesis conditions was tested, the effect factors of the function parameters were discussed such as urban scale, urban shape and traffic structure, a general function of trip distance distribution was established through quantitative analysis and nonlinear regression, and the parameter ranges of different urban scales were analyzed.Calculation result indicates that trip distance accords with Rayleigh distribution, the ranges of distribution function parameter are from 0.035 to 0.076 for megalopolis and from 0.042 to 0.100 for big and medium cities.
-
表 1 出行距离累积分布1
Table 1. Cumulating distribution 1 of trip distance
距离/km 湖州 昆山 沈阳 扬州 张家港 < 1 0.003 0 0.001 5 0.000 5 0.001 0 0.004 1 < 2 0.083 6 0.075 1 0.020 3 0.048 3 0.059 4 < 3 0.235 0 0.206 1 0.042 0 0.174 2 0.109 0 < 4 0.397 1 0.394 3 0.144 8 0.270 4 0.298 7 < 5 0.529 5 0.530 8 0.172 6 0.451 4 0.343 5 < 6 0.644 4 0.685 9 0.262 3 0.564 0 0.482 7 < 7 0.696 0 0.726 2 0.285 3 0.666 3 0.530 0 < 8 0.777 3 0.821 4 0.472 4 0.758 4 0.662 5 < 10 0.854 5 0.870 3 0.552 9 0.879 1 0.752 4 < 12 0.905 7 0.929 3 0.754 9 0.925 3 0.883 0 < 14 0.920 9 0.944 4 0.807 3 0.946 3 0.903 6 < 16 0.941 5 0.955 1 0.923 7 0.958 2 0.919 1 < 18 0.947 2 0.957 9 0.947 5 0.962 4 0.928 7 < 20 0.955 8 0.965 1 0.987 6 0.969 6 0.961 5  下载: 导出CSV
表 2 出行距离累积分布2
Table 2. Cumulating distribution 2 of trip distance
距离/km 蚌埠 常德 濮阳 苏州 铜陵 < 1 0.000 0 0.002 2 0.012 2 0.002 3 0.000 5 < 2 0.022 0 0.047 2 0.051 7 0.057 1 0.058 6 < 3 0.075 1 0.110 1 0.097 5 0.131 3 0.121 8 < 4 0.206 7 0.266 1 0.326 2 0.223 7 0.319 1 < 5 0.295 6 0.331 7 0.363 5 0.335 5 0.381 1 < 6 0.405 1 0.462 1 0.467 4 0.422 5 0.501 8 < 7 0.463 4 0.517 7 0.502 7 0.479 1 0.549 3 < 8 0.689 4 0.682 0 0.688 8 0.580 8 0.695 8 < 10 0.745 4 0.765 1 0.752 8 0.715 8 0.758 0 < 12 0.864 3 0.876 3 0.886 4 0.822 8 0.862 6 < 14 0.892 5 0.895 4 0.901 0 0.861 7 0.887 2 < 16 0.929 7 0.919 2 0.932 6 0.899 5 0.920 3 < 18 0.934 6 0.925 5 0.933 1 0.912 8 0.929 5 < 20 0.945 2 0.937 1 0.945 9 0.933 5 0.943 1 < 22 0.948 4 0.940 1 0.948 7 0.941 7 0.948 7 < 24 0.960 6 0.954 4 0.962 0 0.962 5 0.960 3 < 26 0.961 8 0.960 1 0.963 1 0.966 0 0.962 6 < 28 0.962 5 0.960 3 0.966 3 0.969 7 0.965 3 < 30 0.963 6 0.962 1 0.971 8 0.970 6 0.967 3
下载: 导出CSV
表 3 10座城市的拟合结果
Table 3. Fitting results of ten cities
城市 分布函数 R2 蚌埠 F(r)=1-exp(-0.016 835r2) 0.993 常德 F(r)=1-exp(-0.018 765r2) 0.984 湖州 F(r)=1-exp(-0.032 065r2) 0.975 昆山 F(r)=1-exp(-0.034 447r2) 0.975 濮阳 F(r)=1-exp(-0.019 310r2) 0.969 沈阳 F(r)=1-exp(-0.010 305r2) 0.981 苏州 F(r)=1-exp(-0.015 725r2) 0.978 铜陵 F(r)=1-exp(-0.020 375r2) 0.966 扬州 F(r)=1-exp(-0.026 510r2) 0.994 张家港 F(r)=1-exp(-0.019 150r2) 0.970
下载: 导出CSV
表 4 10座城市基本信息
Table 4. Basic data of ten cities
城市 y=λ 建成区面积/km2 建成区面积平方根x1/km 城市形状系数x2 公交出行比例/% 私家车出行比例/% 公交车出行与私家车出行的比值 比值对数x3 昆山 0.068 94 26 5.099 0.777 7 3.82 1.71 2.233 9 0.349 1 濮阳 0.038 62 27 5.196 0.707 1 8.20 1.97 4.162 4 0.619 3 张家港 0.038 30 31 5.568 0.523 7 5.25 3.73 1.407 5 0.148 5 铜陵 0.040 75 33 5.745 0.810 5 10.75 0.62 17.338 7 1.239 0 常德 0.037 53 42 6.481 0.761 9 16.88 1.19 14.184 9 1.151 8 扬州 0.053 02 45 6.708 0.788 7 4.31 1.13 3.814 2 0.581 4 湖州 0.064 13 50 7.071 0.798 1 6.31 3.58 1.762 6 0.246 1 蚌埠 0.033 67 52 7.211 0.813 9 23.68 0.36 65.777 8 1.818 1 苏州 0.031 45 156 12.490 0.741 9 6.44 0.81 7.950 6 0.900 4 沈阳 0.020 61 271 16.462 0.619 3 18.80 2.72 6.911 8 0.839 6
下载: 导出CSV
表 5 不同类型城市交通结构建议值
Table 5. Suggestion values of traffic structures for different type cities
交通方式 体力型交通方式 机动化交通方式 步行 自行车 摩托车 出租车 单位车 私家车 公交 第1阶段(交通结构发展期) 大城市与特大城市 25~35 20~30 3~5 2~5 2~3 3~8 20~30 中小城市 30~40 30~45 5~8 1~3 2~3 1~5 5~10 第2阶段(交通结构成熟期) 大城市与特大城市 20~30 10~20 — 2~5 — 10~20 30~45 中小城市 25~35 15~30 1~3 1~3 — 15~25 5~10
下载: 导出CSV
表 6 不同类型城市的参数值
Table 6. Parameter values of different type cities
城市类型 x1 x2 x3 λ 第1阶段 第2阶段 第1阶段 第2阶段 小城市 3.16~4.47 0.800~1.000 0.000~1.000 -0.700~-0.300 0.049~0.099 0.081~0.116 中等城市 4.47~7.07 0.800~1.000 0.000~1.000 -0.300~-0.155 0.046~0.097 0.075~0.105 大城市 7.07~14.14 0.800~1.000 0.400~0.845 -0.155~0.400 0.042~0.085 0.053~0.098 特大城市 14.14~20.00 0.800~1.000 0.400~0.845 0.400~0.650 0.035~0.076 0.040~0.076
下载: 导出CSV
-
[1] 刘伟平. 交通OD表的实用计算模型[J]. 中国公路学报, 1995, 8(3): 18-24.Liu Wei-ping. A practical computation model of traffic OD table[J]. China Journal of Highway and Transport, 1995, 8(3): 18-24. (in Chinese) [2] 陈尚云, 高世廉. 我国特大城市土地利用形态与出行总量的距离分布研究[J]. 四川联合大学学报: 工程科学版, 1999, 3(3): 83-89.Chen Shang-yun, Gao Shi-lian. The study on the distance distribution of urban-trip summation and the urban-land use pattern[J]. Journal of Sichuan Union University: Engineering Science Edition, 1999, 3(3): 83-89. (in Chinese) [3] 陈尚云, 杜文, 高世廉. 我国特大城市出行分布模型及其参数的研究[J]. 系统工程, 2002, 20(4): 63-66.Chen Shang-yun, Du Wen, Gao Shi-lian. The study on the model and parameter of urban-trip distribution in metropolises of China[J]. Systems Engineering, 2002, 20(4): 63-66. (in Chinese) [4] 陈尚云, 杜文. 我国大城市用地形态与交通发展模式的研究[J]. 系统工程, 2003, 21(3): 53-57.Chen Shang-yun, Du Wen. Astudy on the development mode of urban traffic and land-use patterns in big cities of China[J]. Systems Engineering, 2003, 21(3): 53-57. (in Chinese) [5] 徐建刚, 祁毅, 迟有中, 等. 可定制性的规划审批数字报建系统[J]. 规划师, 2006, 22(3): 57-60.Xu Jian-gang, Qi Yi, Chi You-zhong, et al. The digital report system of planning examination and approval based on the customized design[J]. Planners, 2006, 22(3): 57-60. (in Chinese) [6] 陈征. 交通方式划分——交通分布组合模型研究与软件设计[D]. 南京: 东南大学, 2004. [7] 姚荣涵, 王殿海. 出行分布的信息熵模型[J]. 交通运输系统工程与信息, 2005, 5(3): 116-126.Yao Rong-han, Wang Dian-hai. Information entropy models of trip distribution[J]. Journal of Transportation Systems Engineering and Information Technology, 2005, 5(3): 116-126. (in Chinese) [8] Ortuzar J D, Willumsen L G. Modeling Transport[M]. 2nd Edition. Sussex: John Wiley and Sons Ltd., 1999. [9] 费舍里松. 城市交通[M]. 第二版. 北京: 中国建筑工业出版社, 1984. [10] 曾松, 杨佩昆. 城市道路网络结构布局相对评价指标研究[J]. 中国公路学报, 2000, 13(3): 93-96.Zeng Song, Yang Pei-kun. A study of evaluation of urban road network by relativeindex[J]. China Journal of Highway and Transport, 2000, 13(3): 93-96. (in Chinese) -


 点击查看大图
计量
- 文章访问数: 417
- HTML全文浏览量: 126
- PDF下载量: 743
- 被引次数: 0
