

Path analysis method of driving factors of carbon emissions for Chinese transportation industry
Article Text (Baidu Translation)
-
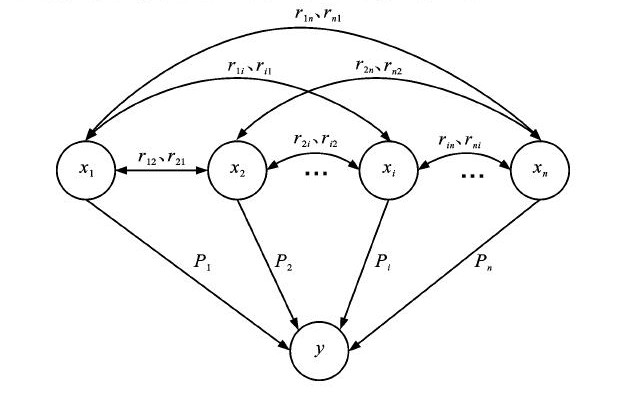
摘要: 分析了中国交通运输业碳排放驱动因素, 基于多元回归分析方法, 提出了碳排放驱动因素的通径分析方法; 基于中国近20年交通运输业碳排放的面板数据, 计算了碳排放驱动因素的直接通径系数与间接通径系数, 分析了主要驱动因素对碳排放的直接影响程度及其相互作用产生的间接影响程度。分析结果表明: 经济水平、运输强度、能源强度是影响交通运输业碳排放的主要因素, 直接通径系数越大, 对交通运输业碳排放拉动能力越大, 间接通径系数越大, 对其他因素依赖性越大; 经济水平的直接通径系数为1.338, 表明经济增长直接刺激了中国交通运输业碳排放的增长, 间接通径系数之和为-0.350, 表明经济水平对其他2个因素依赖较小, 且具有较强的拉动效应; 运输强度的直接通径系数为0.422, 表明运输强度推动了交通运输业碳排放的增长, 间接通径系数之和为1.171, 表明运输强度对经济水平有较大的依赖性, 单位GDP所消耗的物流量与物流成本较高, 所附加的产业价值较低; 能源强度的直接通径系数为0.216, 表明能源强度是中国交通运输业碳排放增长的重要推动因素, 间接通径系数之和为0.119, 表明经济发展拉动了能源的快速消费, 造成二氧化碳的大量排放, 且单位周转量消耗的能源较高, 能源的集约利用程度较低, 造成了高昂的经济成本和环境成本。Abstract: The driving factors of carbon emissions for Chinese transportation industry were analyzed, and the path analysis method of carbon emissions' driving factors was proposed based on multi-element regression analysis method.Based on the last two decades' panel data of carbon emissions for Chinese transportation industry, the direct and indirect path coefficients of the factors were computed, and the direct influence degrees of main driving factors and the indirect influence degrees of their interactions were studied.Analysis result shows that economic level, transportation intensity and energy intensity are main influence factors of transportation carbon emissions.The larger the direct path coefficient is, the greaterthe promotion to transportation carbon emissions is.The larger the indirect path coefficient is, the greater the dependence on other factors is.Economic level's direct path coefficient is 1.338, which indicates that economic growth directly stimulates the increase of carbon emissions.The sum of economic level's indirect path coefficients is-0.350, so economic level has little dependence on other two factors but has strong promotion effect.Transportation intensity's direct path coefficient is 0.422, which indicates that transportation intensity increases transportation carbon emissions. The sum of transportation intensity's indirect path coefficients is 1.171, so transportation intensity has strong dependence on economic level, the logistic quantity and logistic cost of unit GDP consumption are higher, and the added value of industry is lower.Energy intensity's direct path coefficient is 0.216, which indicates that energy intensity is an important factor to increase transportation carbon emissions.The sum of energy intensity's indirect coefficients is 0.119, so economic development increases energy consumption, which results in a large amount of carbon dioxide emission, and the high economic and environmental costs results from the higher energy consumption of unit turnover and the lower intensive using degree of energy.
-
Key words:
- transportation /
- carbon emission /
- path analysis method /
- driving factor /
- path coefficient
-
[1] HEIDARI H, KATIRCIOGLU S T, SAEIDPOUR L. Economic growth, CO2emissions, and energy consumption in the five ASEAN countries[J]. Electrical Power and Energy Systems, 2015, 64: 785-791. doi: 10.1016/j.ijepes.2014.07.081 [2] LIN Bo-qiang, XIE Chun-ping. Reduction potential of CO2emissions in China's transport industry[J]. Renewable and Sustainable Energy Reviews, 2014, 33: 689-700. doi: 10.1016/j.rser.2014.02.017 [3] ZWAAN B V, KEPPO I, JOHNSSON F. How to decarbonize the transport sector?[J]. Energy Policy, 2013, 61 (7): 562-573. [4] ANDREONI V, GALMARINI S. European CO2emission trends: a decomposition analysis for water and aviation transport sectors[J]. Energy, 2012, 45 (1): 595-602. doi: 10.1016/j.energy.2012.07.039 [5] CHANDRAN V G R, TANG C F. The impacts of transport energy consumption, foreign direct investment and income on CO2emissions in ASEAN-5economies[J]. Renewable and Sustainable Energy Reviews, 2013, 24 (10): 445-453. [6] ZHANG Ming, LI Hua-nan, ZHOU Min, et al. Decomposition analysis of energy consumption in Chinese transportation sector[J]. Applied Energy, 2011, 88 (6): 2279-2285. doi: 10.1016/j.apenergy.2010.12.077 [7] BELLASIO R, BIANCONI R, CORDA G, et al. Emission inventory for the road transport sector in Sardinia (Italy)[J]. Atmospheric Environment, 2007, 41 (4): 677-691. doi: 10.1016/j.atmosenv.2006.09.017 [8] 黄文伟, 强明明, 孙龙林, 等. 基于MOVES的车辆排放因子测试[J]. 交通运输工程学报, 2017, 17 (1): 140-148. doi: 10.3969/j.issn.1671-1637.2017.01.016HUANG Wen-wei, QIANG Ming-ming, SUN Long-lin, et al. Emission factor measurement of vehicles based on MOVES[J]. Journal of Traffic and Transportation Engineering, 2017, 17 (1): 140-148. (in Chinese). doi: 10.3969/j.issn.1671-1637.2017.01.016 [9] XU Bin, LIN Bo-qiang. Carbon dioxide emissions reduction in China's transport sector: a dynamic VAR (vector autoregression) approach[J]. Energy, 2015, 83: 486-495. doi: 10.1016/j.energy.2015.02.052 [10] RYAN L, FERREIRA S, CONVERY F. The impact of fiscal and other measures on new passenger car sales and CO2emissions intensity: Evidence from Europe[J]. Energy Economics, 2009, 31 (3): 365-374. doi: 10.1016/j.eneco.2008.11.011 [11] TIMILSINA G R, SHRESTHA A. Transport sector CO2emission growth in Asia: underlying factors and policy options[J]. Energy Policy, 2009, 37 (11): 4523-4539. doi: 10.1016/j.enpol.2009.06.009 [12] ZHANG Chuan-guo, NIAN Jiang. Panel estimation for transport sector CO2emissions and its affecting factors: a reginal analysis in China[J]. Energy Policy, 2013, 63 (4): 918-926. [13] 纪建悦, 孔胶胶. 基于STIRFDT模型的海洋交通运输业碳排放预测研究[J]. 科技管理研究, 2012 (6): 79-81. doi: 10.3969/j.issn.1000-7695.2012.06.019JI Jian-yue, KONG Jiao-jiao. Prediction research on carbon emissions of marine transportation based on STIRFDT model[J]. Science and Technology Management Research, 2012 (6): 79-81. (in Chinese). doi: 10.3969/j.issn.1000-7695.2012.06.019 [14] 魏庆琦, 赵嵩正, 肖摇伟. 我国交通运输结构优化的碳减排能力研究[J]. 交通运输系统工程与信息, 2013, 13 (3): 10-17, 32. doi: 10.3969/j.issn.1009-6744.2013.03.002WEI Qing-qi, ZHAO Song-zheng, XIAO Yao-wei. A quantitative analysis of carbon emissions reduction ability of transportation structure optimization in China[J]. Journal of Transportation Systems Engineering and Information Technology, 2013, 13 (3): 10-17, 32. (in Chinese). doi: 10.3969/j.issn.1009-6744.2013.03.002 [15] PAPAGIANNAKI K, DIAKOULAKI D. Decomposition analysis of CO2emissions from passenger cars: The cases of Greece and Denmark[J]. Energy Policy, 2009, 37 (8): 3259-3267. doi: 10.1016/j.enpol.2009.04.026 [16] 呙小明, 张宗益. 我国交通运输业能源强度影响因素研究[J]. 管理工程学报, 2012, 26 (4): 90-99. doi: 10.3969/j.issn.1004-6062.2012.04.013GUO Xiao-ming, ZHANG Zong-yi. What is keeping energy intensity in China's transportation sector from deterioration?[J]. Journal of Industrial Engineering/Engineering Management, 2012, 26 (4): 90-99. (in Chinese). doi: 10.3969/j.issn.1004-6062.2012.04.013 [17] 杨琦, 朱容辉, 赵小强. 中国交通运输业的碳排放情景预测模型[J]. 长安大学学报: 自然科学版, 2014, 34 (5): 77-83. https://www.cnki.com.cn/Article/CJFDTOTAL-XAGL201405013.htmYANG Qi, ZHU Rong-hui, ZHAO Xiao-qiang. Calculation decoupling analysis and scenario prediction of carbon emissions of transportation in China[J]. Journal of Chang'an University: Natural Science Edition, 2014, 34 (5): 77-83. (in Chinese). https://www.cnki.com.cn/Article/CJFDTOTAL-XAGL201405013.htm [18] 王韶华, 于维洋, 张伟. 低碳经济的驱动因素及其驱动机理分析[J]. 环境工程, 2014, 32 (12): 143-147. https://www.cnki.com.cn/Article/CJFDTOTAL-HJGC201412036.htmWANG Shao-hua, YU Wei-yang, ZHANG Wei. Research on the influence factor and influencemechanism of low-carbon economy[J]. Environmental Engineering, 2014, 32 (12): 143-147. (in Chinese). https://www.cnki.com.cn/Article/CJFDTOTAL-HJGC201412036.htm [19] 程新意, 李少疆. 通径分析的数学模型[J]. 工科数学, 1990, 6 (4): 99-105. https://www.cnki.com.cn/Article/CJFDTOTAL-GKSX199004033.htmCHENG Xin-yi, LI Shao-jiang. Mathematical models of path analysis[J]. Journal of Mathematics EOR Technology, 1990, 6 (4): 99-105. (in Chinese). https://www.cnki.com.cn/Article/CJFDTOTAL-GKSX199004033.htm [20] 崔党群. 通径分析的矩阵算法[J]. 生物数学学报, 1994, 9 (1): 71-76. https://www.cnki.com.cn/Article/CJFDTOTAL-SWSX199401011.htmCUI Dang-qun. The matrix solutions on path analysis[J]. Journal of Biomathematics, 1994 (1): 71-76. (in Chinese). https://www.cnki.com.cn/Article/CJFDTOTAL-SWSX199401011.htm [21] SABOORI B, SAPRI M, BABA M. Economic growth, energy consumption and CO2 emissions in OECD (Organization for Economic Co-operation and Development) 's transport sector: a fully modified bi-directional relationship approach[J]. Energy, 2014, 66: 150-161. [22] HEINRICHS H, JOCHEM P, FICHTNER W. Including road transport in the EU ETS (european emissions trading system): a model-based analysis of the German electricity and transport sector[J]. Energy, 2014, 69 (5): 708-720. [23] TIAN Yi-hui, ZHU Qing-hua, LAI K H, et al. Analysis of greenhouse gas emissions of freight transport sector in China[J]. Journal of Transport Geography, 2014, 40: 43-52. [24] MRAIHI R, ABDALLAH K B, ABID M. Road transportrelated energy consumption: analysis of driving factors in Tunisia[J]. Energy Policy, 2013, 62 (7): 247-253. [25] 吴巧生, 成金华, 王华. 中国工业化进程中的能源消费变动[J]. 中国工业经济, 2005 (4): 30-37. https://www.cnki.com.cn/Article/CJFDTOTAL-GGYY200504003.htmWU Qiao-sheng, CHENG Jin-hua, WANG Hua. Change of energy consumption with the process of industrialization in China[J]. China Industrial Economy, 2005 (4): 30-37. (in Chinese). https://www.cnki.com.cn/Article/CJFDTOTAL-GGYY200504003.htm [26] 赵涛, 郑丹. 1996-2010年中国能源碳足迹生态压力研究[J]. 干旱区资源与环境, 2014, 28 (8): 1-6. https://www.cnki.com.cn/Article/CJFDTOTAL-GHZH201408001.htmZHAO Tao, ZHENG Dan. The ecological pressure intensity of carbon footprint in China from 1996to 2010[J]. Journal of Arid Land Resources and Environment, 2014, 28 (8): 1-6. (in Chinese). https://www.cnki.com.cn/Article/CJFDTOTAL-GHZH201408001.htm -

 下载:
下载:


 点击查看大图
图(2) / 表(11)
计量
- 文章访问数: 1047
- HTML全文浏览量: 265
- PDF下载量: 554
- 被引次数: 0
