

-
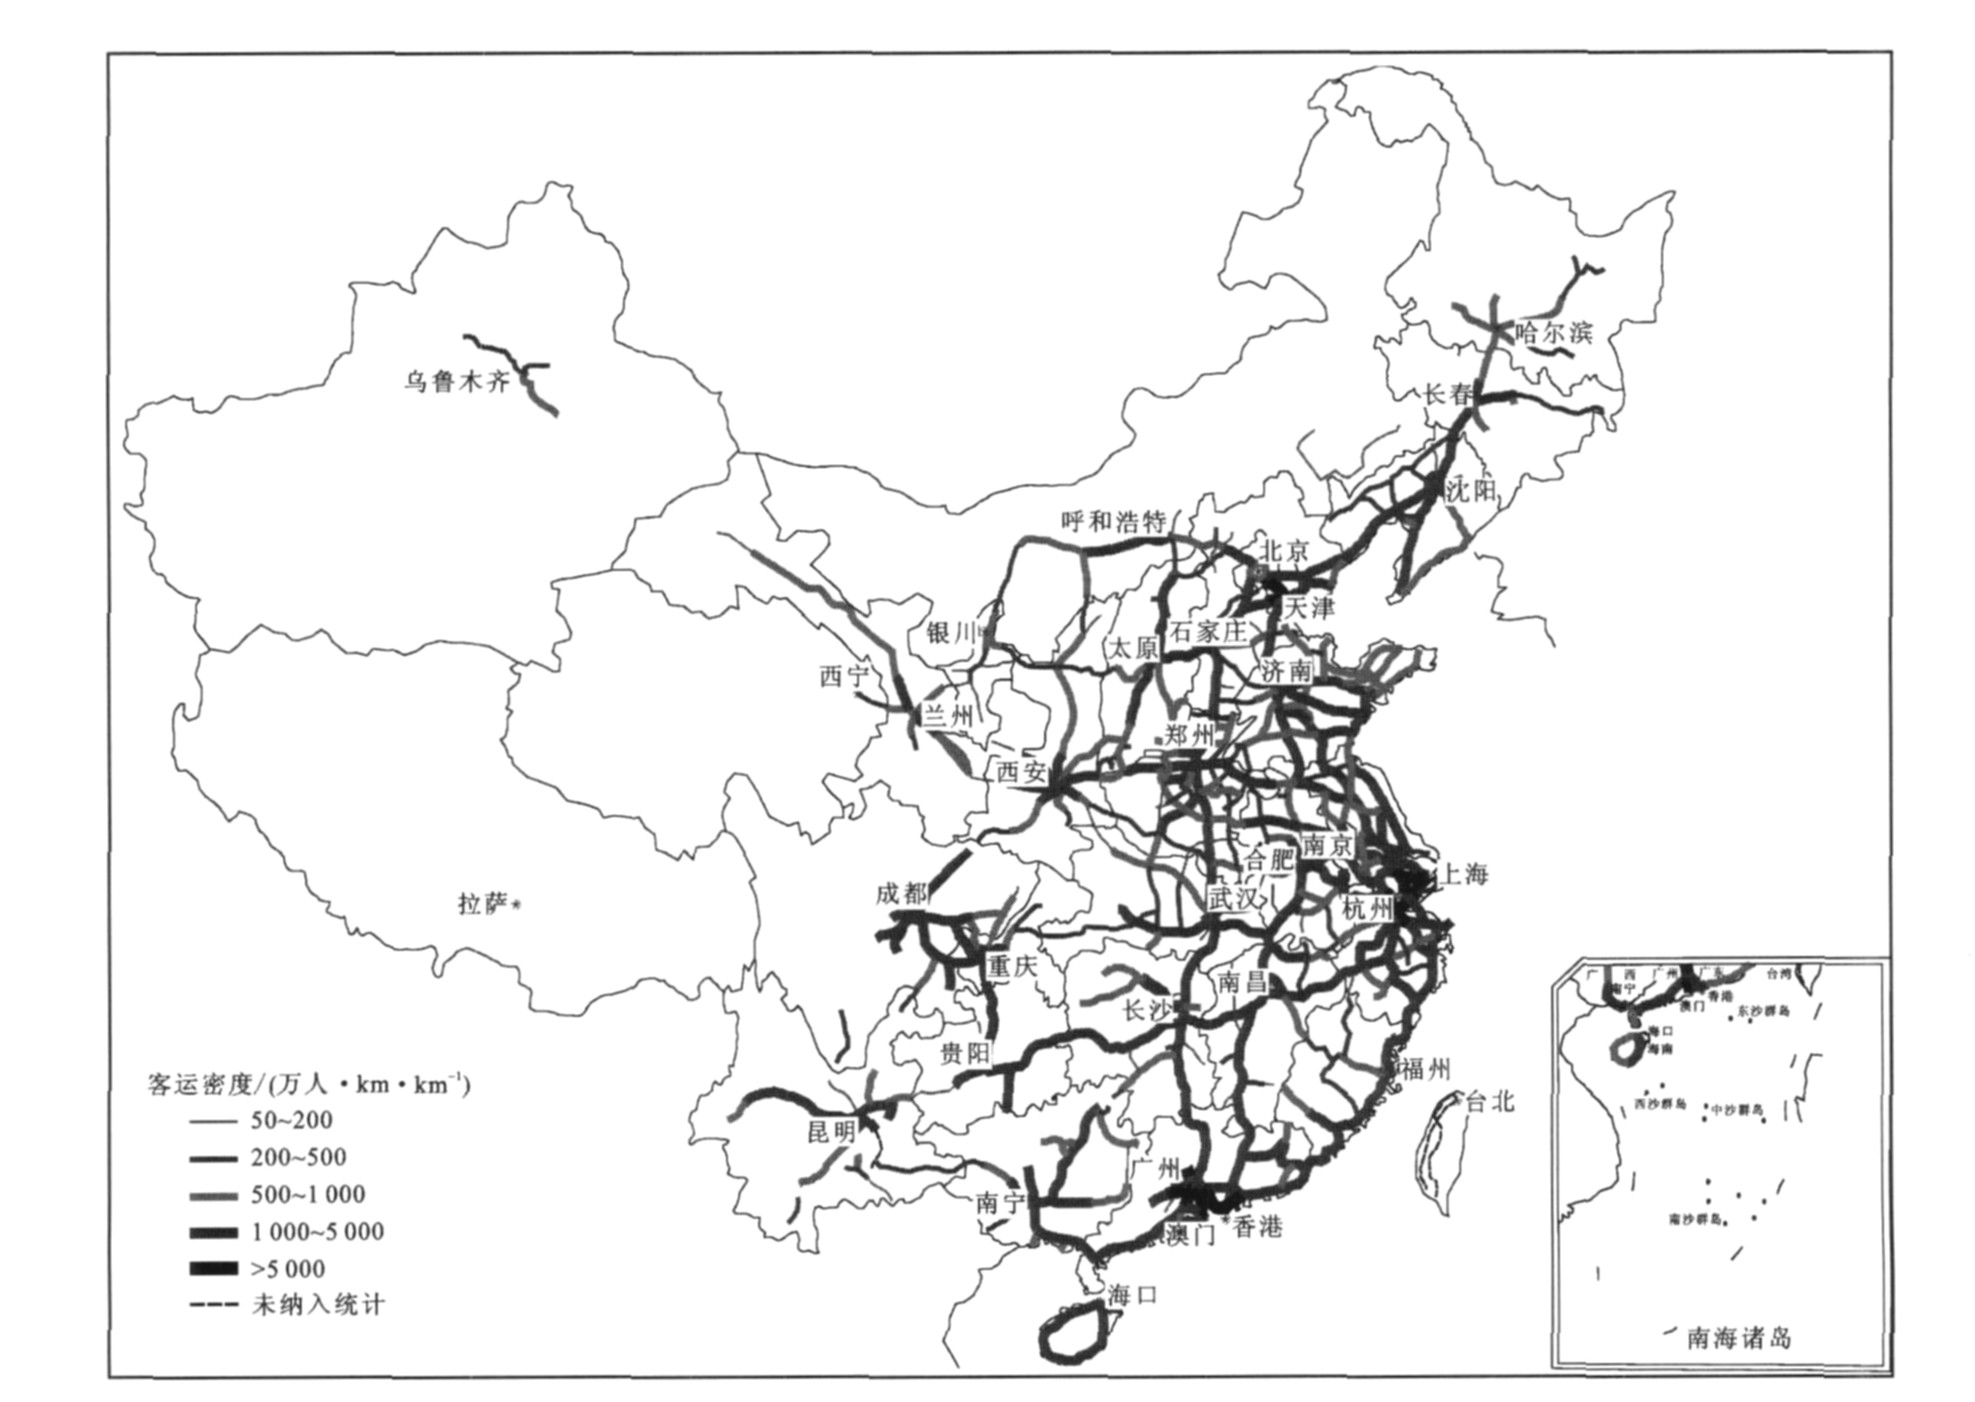
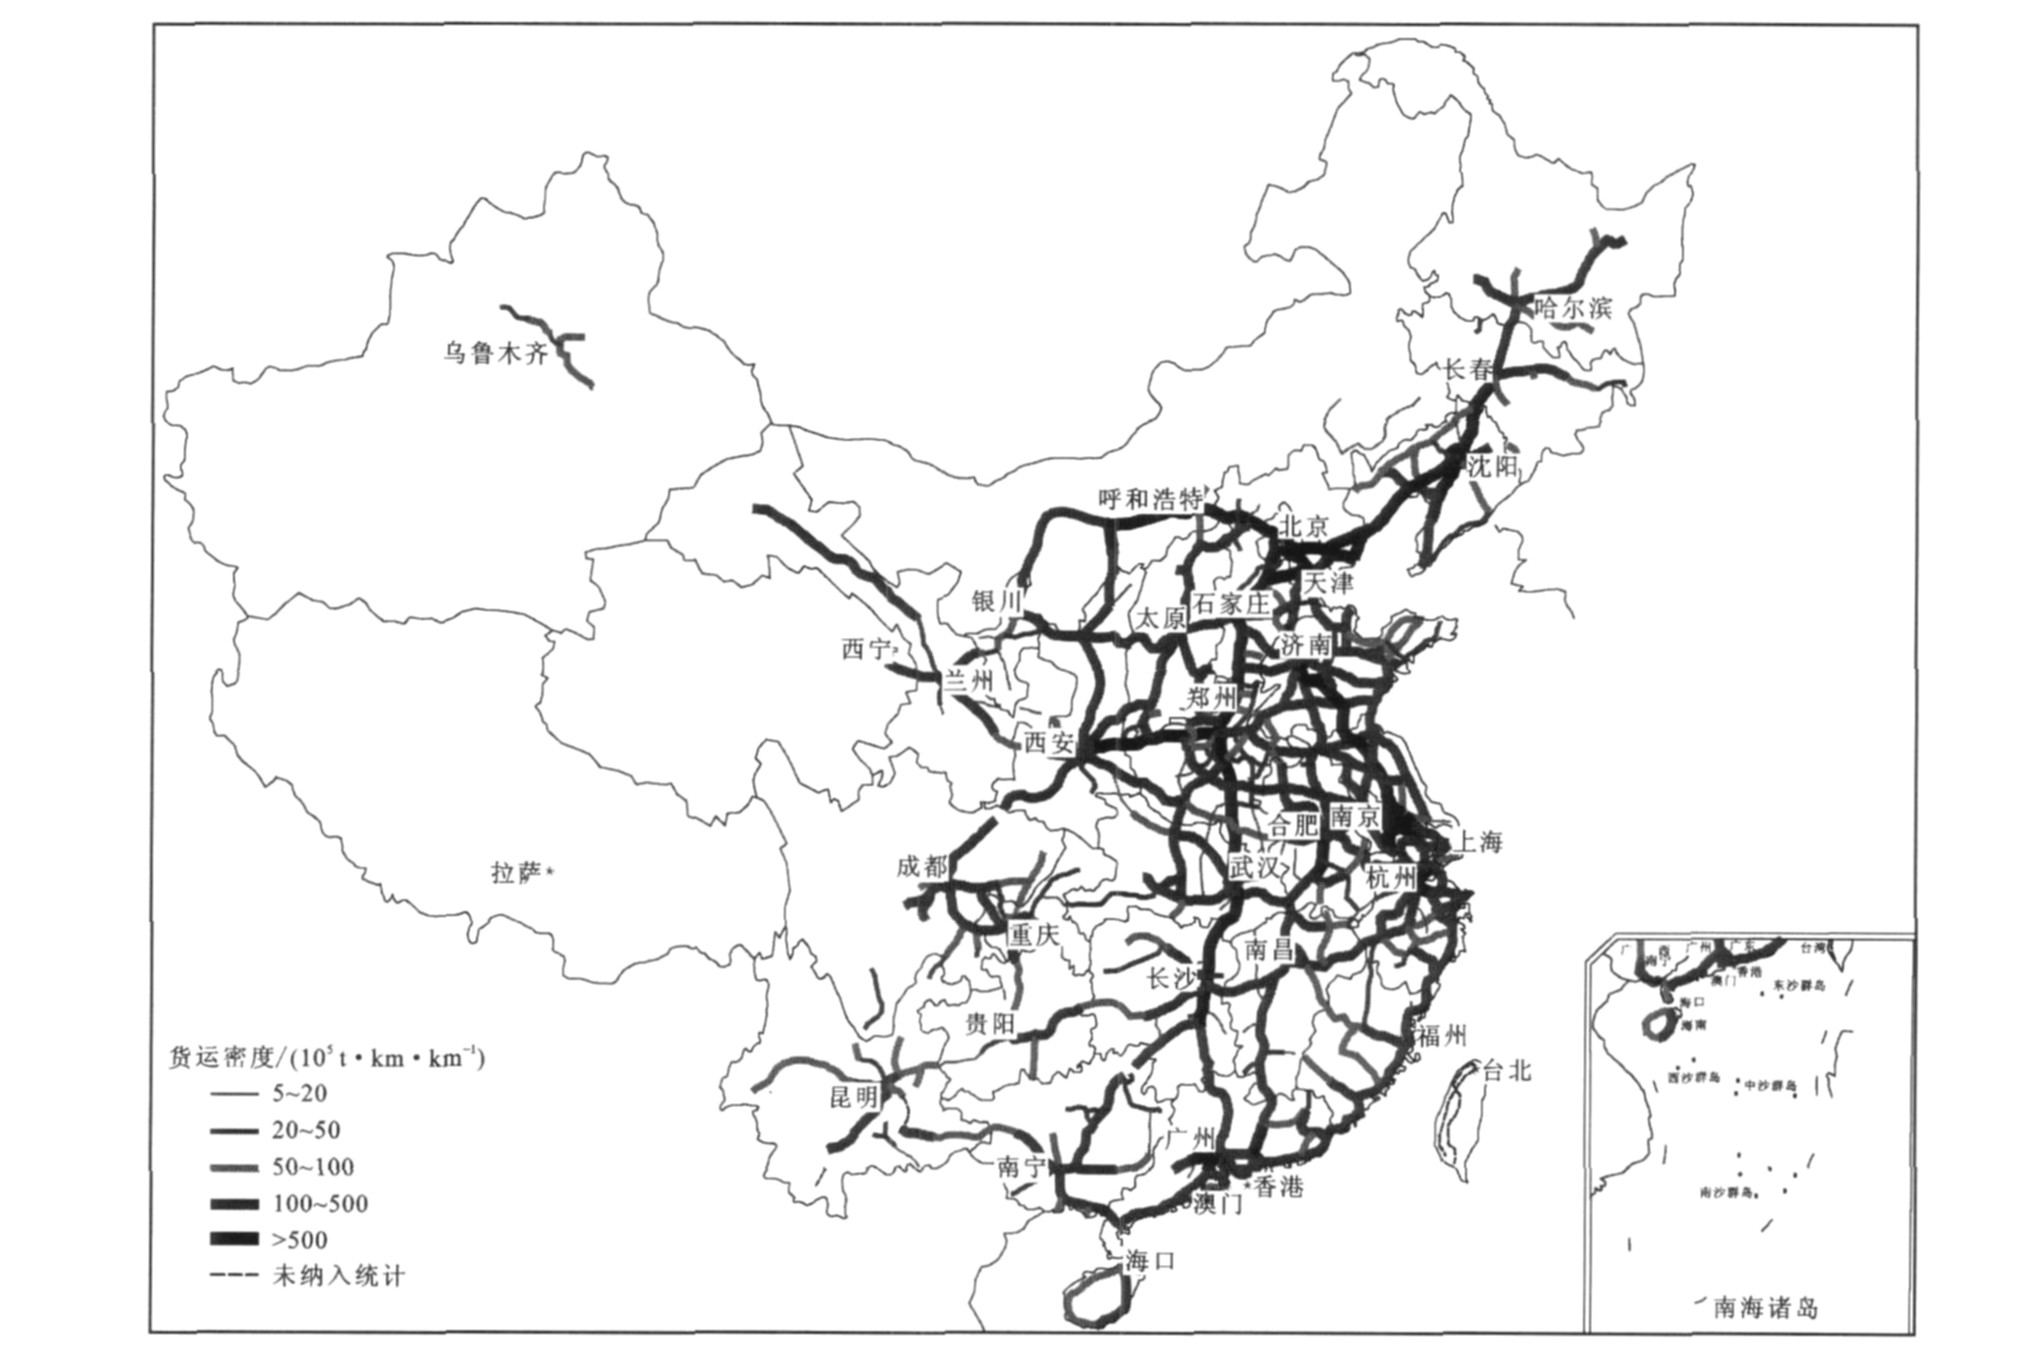
摘要: 以中国高速公路联网收费系统数据库为主, 并辅以收费站典型抽样调查, 分析了中国高速公路网运输状态。与2008年相比, 2009年高速公路网客运密度同比增长7.96%;小客车(不大于7座) 完成旅客周转量的43.30%, 同比上升了2.29%;Ⅰ型和Ⅳ型客车平均运行速度略有下降, 而Ⅱ型和Ⅲ型客车平均运行速度略有上升; 货运密度同比上升了4.58%, 汽车列车完成货物周转量的76.14%, 货运车辆的空车走行率为19.84%, 同比略有下降; 超限30%以上的货车比重为4.62%;2009年中国高速公路运输保持高速增长态势, 高速公路交通事故呈现平稳下降态势, 同比下降了13.40%。Abstract: Based on the database of expressway network toll system and the typical sampling investigation data at toll stations, the transportation status of Chinese expressway network was analyzed. Compared with the transportation status in 2008, in 2009, passenger transportation density in expressway network rises by 7.96%, and 43.30% of passenger turnover volume is produced by mini-type buses (the seat amount of every bus is less than 8), which rises by 2. 29%. The average speeds of Ⅰ-type (the seat amount of every bus is less than 8) and Ⅳ-type buses (the seat amount of every bus is more than 40) decrease slightly, but the average speeds of Ⅱ-type and Ⅲ-type buses (the seat amount of every bus is between 8 and 40) rise slightly. Freight transportation density rises by 4.58%, and 76.14% of freight turnover volume is produced by tractor-trailer vehicles. The percentage of empty to loaded truck kilometers of trucks is 19. 84%, which decreases slightly. The percentage of trucks with overweight more than 30% is 4.62%. In 2009, the transportation of Chinese expressway network keeps high-speed growth, but the rate of traffic accidents on expressways declines steady, and decreases by 13.40%.
-

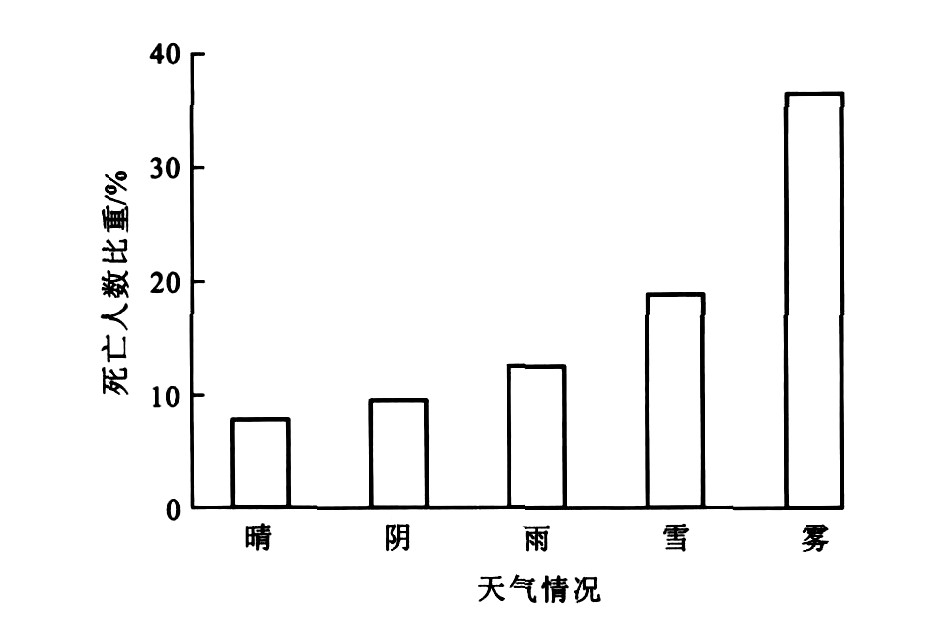
图 5 高速公路交通事故死亡人数比重
Figure 5. Proportions of death tolls in expressway traffic accidents
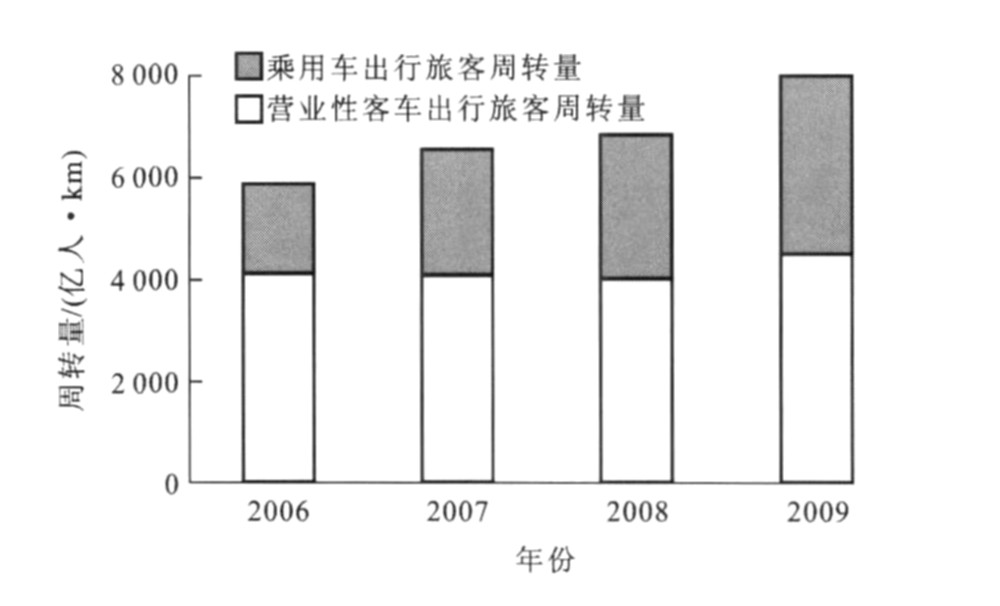
表 1 微型客车客运比重
Table 1. Passenger transportation proportions of mini-type buses
年份 2006 2007 2008 2009 旅客周转量比重/% 29.75 38.12 41.01 43.30 客运量比重/% 41.07 46.54 48.54 53.94  下载: 导出CSV
表 2 客车平均座位数和乘坐率
Table 2. Average amounts of seats and utilization rates for buses
车型 座位数 平均座位数 乘坐率/% Ⅰ ≤7 5.27 48.75 Ⅱ 8~19 11.52 47.99 Ⅲ 20~39 33.23 74.98 Ⅳ ≥40 45.98 76.43
下载: 导出CSV
表 3 客车平均速度
Table 3. Average speeds of buses
车型 座位数 平均速度/ (km·h-1) 样本数/万辆 Ⅰ ≤7 89.87 73 666 Ⅱ 8~19 82.70 3 626 Ⅲ 20~39 83.89 4 088 Ⅳ ≥40 85.70 1 902
下载: 导出CSV
表 4 2006~2009年货物周转量发展趋势
Table 4. Growth trends of freight turnover volumes in 2006-2009
运输方式 2006年 2007年 2008年 2009年 周转量/ (108 t·km) 周转量/ (108 t·km) 增长率/% 周转量/ (108 t·km) 增长率/% 周转量/ (108 t·km) 增长率/% 铁路 21 715 23 954 10.3 24 817 14.3 24 943 14.9 内河和沿海水运 12 908 15 599 20.8 17 413 34.9 18 031 39.7 高速公路 7 458 9 970 33.7 11 981 60.6 13 517 81.2
下载: 导出CSV
表 5 货车平均速度
Table 5. Average speeds of trucks
车型 轴型 平均速度/ (km·h-1) 样本数/万辆 单车 2轴4胎 67.24 5 125 2轴6胎 61.16 13 399 3轴和4轴 57.44 6 055 半挂列车 3~6轴 56.46 15 421
下载: 导出CSV
表 6 2009年高速公路货车主要轴型
Table 6. Chief axis types of trucks in 2009

表 7 货车车数比重
Table 7. Amount proportions of trucks
% 车型 2006年 2007年 2008年 2009年 2轴4胎单车 17.58 12.40 10.24 13.39 2轴6胎单车 48.79 42.43 35.36 33.31 3轴与4轴单车 13.26 16.42 19.68 15.97 半挂列车 20.47 28.75 34.68 37.33
下载: 导出CSV
表 8 货车行驶量比重
Table 8. Kilometer proportions of trucks
% 车型 2006年 2007年 2008年 2009年 2轴4胎单车 7.74 6.25 6.84 7.82 2轴6胎单车 38.24 33.67 27.81 24.93 3轴与4轴单车 17.60 19.13 18.07 17.22 半挂列车 36.42 40.95 47.25 50.03
下载: 导出CSV
表 9 货车完成的货物周转量比重
Table 9. Proportions of freight turnover volumes for trucks
% 车型 2006年 2007年 2008年 2009年 2轴4胎单车 1.42 0.95 0.40 1.12 2轴6胎单车 18.64 13.02 9.87 7.47 3轴与4轴单车 20.25 19.83 18.07 15.27 半挂列车 59.73 66.20 71.49 76.14
下载: 导出CSV
表 10 空车走行率
Table 10. Percentages of empty to loaded truck kilometers
车型 年度 省内运输/% 跨省运输/% 总量/% 2轴单车 2009 34.77 24.95 30.48 2008 32.78 18.84 26.33 2007 36.17 15.03 24.95 2006 36.01 15.87 26.52 3轴与4轴单车 2009 35.03 9.46 16.95 2008 36.40 10.81 18.05 2007 33.24 8.38 15.00 2006 32.82 9.38 17.73 半挂列车 2009 34.14 7.90 14.73 2008 42.67 10.16 18.37 2007 28.74 10.37 15.28 2006 35.02 9.28 13.93 合计 2009 34.56 11.68 19.84 2008 36.71 12.37 20.97 2007 33.30 11.37 18.93 2006 35.33 10.97 20.13
下载: 导出CSV
表 11 装载货车车数比重
Table 11. Percentages of trucks classified by load conditions
% 治超标准 空车 不超限重车 超限0~30% 超限30%~50% 超限50%~100% 超限大于100% 超限合计 GB 1589标准 25.67 45.67 24.04 2.93 1.52 0.17 28.66 路政治超标准 25.67 64.60 8.45 0.88 0.37 0.03 9.73
下载: 导出CSV
表 12 铁路运输主要货类运量比重
Table 12. Proportions of chief goods for railway transportation
% 货类 2005年 2006年 2007年 2008年 2009年 煤炭 48.08 48.02 49.31 51.41 52.51 冶炼物资 21.91 23.15 22.85 22.12 23.30 粮食 4.41 3.75 3.59 3.78 3.04 石油 5.69 5.34 4.89 4.52 3.97 化肥及农药 2.91 2.80 2.85 2.55 2.51 小计 83.00 83.06 83.49 84.38 85.33
下载: 导出CSV
表 13 公路运输货类周转量比重
Table 13. Proportions of freight turnover volumes for expressway transportation
货类 比重/% 货类 比重/% 煤炭 14.7 机械设备、电器 10.3 石油、天然气及制品 2.0 农林牧渔业产品 11.8 冶炼物资 12.5 轻工、医药制品 7.8 粮食 4.8 化工原料及制品 5.4 化肥及农药 0.8 水泥 4.1 矿物性建筑材料 8.1 木材 2.7 小计 42.9 盐 0.5 其他 14.5 小计 57.1
下载: 导出CSV
-
[1] 交通运输部综合规划司. 2008中国高速公路运输量调查分析报告[M]. 北京: 人民交通出版社, 2009.Department of Comprehensive Planning, Ministry of Transport. Survey and Statistics of Chinese Expressway Transportation Volume in 2008[M]. Beijing: China Communications Press, 2009. (in Chinese) [2] 陈荫三. 高速公路运输量研究[J]. 中国公路学报, 2005, 18 (2): 94-98. https://www.cnki.com.cn/Article/CJFDTOTAL-ZGGL20050200I.htmCHEN Yin-san. Study of freeway transportation volume[J]. China Journal of Highway and Transport, 2005, 18 (2): 94-98. (in Chinese) https://www.cnki.com.cn/Article/CJFDTOTAL-ZGGL20050200I.htm [3] Bureau of Transportation Statistics, US Department of Transportation. Transportation statistics annual report 2003[R]. Washington DC: Bureau of Transportation Statistics, US Department of Transportation, 2003. [4] Bureau of Transportation Statistics, US Depart ment ofTransportation. Transportation statistics annual report 2007[R]. Washington DC: Bureau of Transportation Statistics, USDepart ment of Transportation, 2007. [5] Bureau of Transportation Statistics, US Department of Transportation. National transportation statistics 2007[R]. Washington DC: Bureau of Transportation Statistics, US Department of Transportation, 2007. [6] 陈荫三, 肖润谋, 马暕, 等. 2006年全国高速公路网运输分析[J]. 交通运输工程学报, 2008, 8 (3): 91-96. http://transport.chd.edu.cn/article/id/200803020CHEN Yin-san, XIAO Run-mou, MAJian, et al. Transportation analysis of Chinese expressway network in 2006[J]. Journal of Traffic and Transportation Engineering, 2008, 8 (3): 91-96. (in Chinese) http://transport.chd.edu.cn/article/id/200803020 [7] 陈荫三, 肖润谋, 秦华容. 2007年中国高速公路网运输分析[J]. 交通运输工程学报, 2009, 9 (2): 83-88. http://transport.chd.edu.cn/article/id/200902015CHEN Yin-san, XIAO Run-mou, QIN Hua-rong. Transportation analysis of Chinese expressway network in 2007[J]. Journal of Traffic and Transportation Engineering, 2009, 9 (2): 83-88. (in Chinese) http://transport.chd.edu.cn/article/id/200902015 [8] 交通运输部综合规划司, 长安大学运输科学研究院. 2009中国高速公路运输量统计调查分析报告[M]. 北京: 人民交通出版社, 2010.Department of Comprehensive Planning, Ministry of Transport, Research Institute of Transportation Science, Chang'an University. Survey and Statistics of Chinese Expressway Transportation Volume in 2009[M]. Beijing: China Communications Press, 2010. (in Chinese) [9] Bureau of Transportation Statistics, US Depart ment of Transportation. National transportation statistics 2007[R]. Washington DC: Bureau of Transportation Statistics, US Department of Transportation, 2003. [10] 秦华容, 杨铭. 美国货运数据需求与供给分析[J]. 物流技术, 2009, 28 (2): 145-147. https://www.cnki.com.cn/Article/CJFDTOTAL-WLJS200902047.htmQIN Hua-rong, YANG Ming. Analysis on demand and supply of freight transportation data in America[J]. Logistics Technology, 2009, 28 (2): 145-147. (in Chinese) https://www.cnki.com.cn/Article/CJFDTOTAL-WLJS200902047.htm [11] Federal Highway Administration, US Department of Trans-portation. 1997 Federal highway cost allocation study[R]. Washington DC: Federal Highway Administration, US Department of Transportation, 1997. [12] Bureau of Transportation Statistics, US Department of Transportation. Transportation statistics annual report 2005[R]. Washington DC: Bureau of Transportation Statistics, US Department of Transportation, 2006. [13] Bureau of Transportation Statistics, US Department of Transportation. Transportation statistics annual report 2001[R]. Washington DC: Bureau of Transportation Statistics, US Department of Transportation, 2001. [14] American Association of State Highway and Transportation Officials (AASHTO). Intercity passenger rail: achieving thevision[R]. Washington DC: AASHTO, 2009. -

 点击查看大图
计量
- 文章访问数: 452
- HTML全文浏览量: 79
- PDF下载量: 425
- 被引次数: 0
