

-
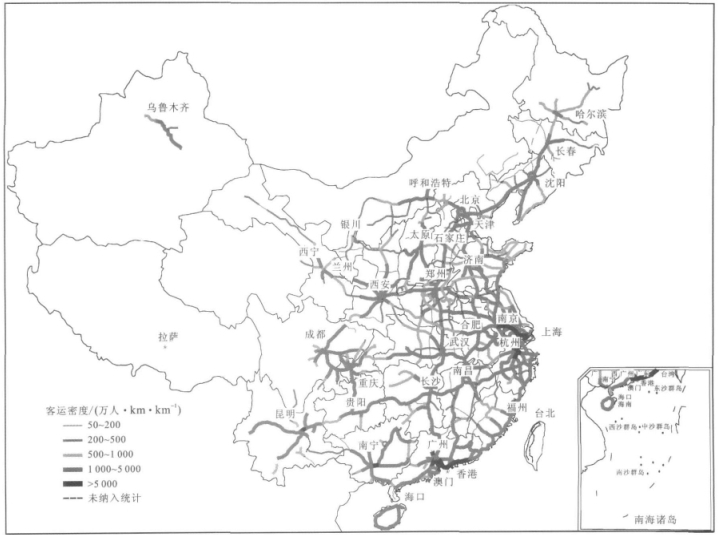
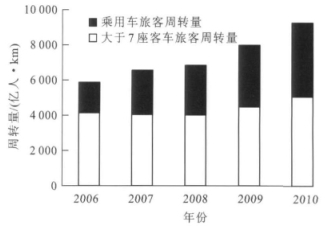
摘要: 以中国高速公路联网收费系统数据库为基础, 辅以收费站典型抽样调查, 分析了中国高速公路网运输状态。分析结果表明: 相比2009年, 2010年中国高速公路网客运密度增长了2.25%;微型客车(不大于7座)完成旅客周转量的45.09%, 同比增长了1.79%;Ⅰ型客车平均速度增长了0.68%, Ⅱ型客车、Ⅲ型客车、Ⅳ型客车速度分别下降了0.26%、1.70%、1.73%;货运密度同比增长了13.32%, 汽车列车完成货物周转量的80.95%, 货车的空车走行率为20.05%, 同比增长了0.21%;按GB 1589—2004制超标准, 超限30%以上的货车比重为4.85%。2010年中国高速公路运输持续保持了高速增长态势。Abstract: Based on the database of expressway network toll system and the typical sampling investigation data at toll stations, the transportation status of Chinese expressway network was analyzed.Analysis result shows that compared with the transportation status in 2009, in 2010, passenger transportation density in expressway network rose by 2.25%.49.05% of passenger turnover volume was produced by mini-type buses(the seat amount of every bus is less than 8), and the volume rose by 1.79%.The average speed of Ⅰ-type bus rose by 0.68%, while the speeds of Ⅱ-type, Ⅲ-type and Ⅳ-type buses decreased by 0.26%, 1.70% and 1.73% respectively.Freight transportation density rose by 13.32%, and 80.95% of freight turnover volume was produced by tractor-trailer vehicles.The percentage of empty to loaded truck kilometers of trucks was 20.05% and rose by 0.21%.According to the standard of GB 1589—2004, the percentage of trucks with the overweights more than 30% is 4.85%.The transportation of Chinese expressway network kept continuous high-speed growth in 2010.
-
表 1 微型客车客运比重
Table 1. Passenger transportation proportions of mini-type buses
年份 2006 2007 2008 2009 2010 旅客周转量比重/% 29.75 38.12 41.01 43.30 45.09 客运量比重/% 41.07 46.54 48.54 53.94 56.56  下载: 导出CSV
表 2 客车平均座位数和乘坐率
Table 2. Average amounts of seats and utilization rates for buses
车型 座位数 平均座位数 乘坐率/% Ⅰ ≤7 5.25 48.76 Ⅱ 8~19 11.07 51.67 Ⅲ 20~39 34.32 78.85 Ⅳ ≥40 49.57 70.18
下载: 导出CSV
表 3 客车平均速度
Table 3. Average speeds of buses
车型 座位数 平均速度/(km·h-1) 样本数/万辆 Ⅰ ≤7 90.47 94 434 Ⅱ 8~19 82.48 3 595 Ⅲ 20~39 82.46 4 558 Ⅳ ≥40 84.22 2 607
下载: 导出CSV
表 4 旅客周转量变化
Table 4. Change of passenger turnover volumes
% 路段 高铁开通前、后旅客周转量的比值 乘用车(≤7座) 营业性客车(≥20座) 济南—青岛 135.79 117.81 福州—温州 132.83 115.67 武汉—鄂湘界 121.75 119.25 南昌—九江 118.70 115.56 合宁高速安徽段 111.64 118.60 郑州—洛阳 111.36 105.36 武汉—合肥 113.92 101.20 宁波—温州 109.30 102.37 京珠高速湖南段 108.43 100.09 南京—上海 100.36 88.91 太原—旧关 100.86 85.49 福州—厦门 84.39 84.04 杭州—上海 73.81 46.82
下载: 导出CSV
表 5 2006~2010年货物周转量发展趋势
Table 5. Growth trends of freight turnover volumes in 2006-2010
运输方式 2006年 2007年 2008年 2009年 2010年 周转量/(108 t·km) 周转量/(108 t·km) 增长率/% 周转量/(108 t·km) 增长率/% 周转量/(108 t·km) 增长率/% 周转量/(108 t·km) 增长率/% 铁路 21 954 24 214 10.3 25 106 14.4 25 239 15.0 27 644 25.9 内河和沿海水运 12 908 15 599 20.8 17 413 34.9 18 031 39.7 22 428 73.8 高速公路 7 458 9 970 33.7 11 981 60.6 13 517 81.2 17 452 134.0
下载: 导出CSV
表 6 货车平均速度
Table 6. Average speeds of trucks
车型 轴型 平均速度/(km·h-1) 样本数/万辆 单车 2轴4胎 68.66 5 519 2轴6胎 61.97 15 285 3轴和4轴 57.03 7 617 半挂列车 3~6轴 56.05 20 967
下载: 导出CSV
表 7 2010年高速公路货车主要轴型
Table 7. Chief axis types of trucks in 2010
% 
表 8 货车车数比重
Table 8. Amount proportions of trucks
% 车型 2006年 2007年 2008年 2009年 2010年 2轴4胎 17.48 12.40 10.28 13.39 11.43 2轴6胎 48.79 42.43 35.36 33.31 31.00 3轴与4轴单车 13.26 16.42 19.68 15.97 15.76 半挂列车 20.47 28.75 34.68 37.33 41.81
下载: 导出CSV
表 9 货车行驶量比重
Table 9. Kilometer proportions of trucks
% 车型 2006年 2007年 2008年 2009年 2010年 2轴4胎 7.74 6.25 6.84 7.82 6.84 2轴6胎 38.24 33.67 27.84 24.93 22.62 3轴与4轴单车 17.60 19.13 18.07 17.22 15.54 半挂列车 36.42 40.95 47.25 50.03 55.00
下载: 导出CSV
表 10 货车完成的货物周转量比重
Table 10. Proportions of freight turnover volumes for trucks
% 车型 2006年 2007年 2008年 2009年 2010年 2轴4胎 1.42 0.95 0.57 1.12 0.78 2轴6胎 18.60 13.02 9.87 7.47 5.83 3轴与4轴单车 20.25 19.83 18.07 15.27 12.44 半挂列车 59.73 66.20 71.49 76.14 80.95
下载: 导出CSV
表 11 空车走行率
Table 11. Percentages of empty to loaded truck kilometers
% 车型 年份 省内运输 跨省运输 总量 2轴单车 2010 37.60 29.10 33.30 2009 34.77 24.95 30.48 2008 32.78 18.84 26.33 2007 36.17 15.03 24.95 2006 36.01 15.87 26.52 3轴与4轴单车 2010 34.17 12.42 17.93 2009 35.03 9.46 16.95 2008 36.40 10.81 18.05 2007 33.24 8.38 15.00 2006 32.82 9.38 17.73 半挂列车 2010 31.34 13.14 14.90 2009 34.14 7.90 14.73 2008 42.67 10.16 18.37 2007 28.74 10.37 15.28 2006 35.02 9.28 13.93 合计 2010 34.42 16.37 20.05 2009 34.56 11.68 19.84 2008 36.71 12.37 20.97 2007 33.30 11.37 18.93 2006 35.33 10.97 20.13
下载: 导出CSV
表 12 装载货车车数比重
Table 12. Percentages of trucks classified by loading conditions
% 治超标准 空车 不超限重车 超限0~30% 超限30%~50% 超限50%~100% 超限大于100% 超限合计 GB 1589—2004 26.49 43.17 25.49 2.66 1.76 0.43 30.34 路政治超标准 26.49 64.81 6.79 1.04 0.72 0.15 8.70
下载: 导出CSV
-
[1] 交通运输部综合规划司, 长安大学运输科学研究院. 2010中国高速公路运输量统计调查分析报告[M]. 北京: 人民交通出版社, 2011.Department of Comprehensive Planning, Ministry of Transport, Research Institute of Transportation Science, Chang'an University. Survey and Statistics of Chinese Expressway Transportation Volume in 2010[M]. Beijing: China Communications Press, 2011. (in Chinese) [2] 交通运输部综合规划司, 长安大学运输科学研究院. 2009中国高速公路运输量统计调查分析报告[M]. 北京: 人民交通出版社, 2010.Department of Comprehensive Planning, Ministry of Transport, Research Institute of Transportation Science, Chang'an University. Survey and Statistics of Chinese Expressway Transportation Volume in 2009[M]. Beijing: China Communications Press, 2010. (in Chinese) [3] 陈荫三. 高速公路运输量研究[J]. 中国公路学报, 2005, 18(2): 94-98. doi: 10.3321/j.issn:1001-7372.2005.02.019CHEN Yin-san. Study of freeway transportation volume[J]. China Journal of Highway and Transport, 2005, 18(2): 94-98. (in Chinese) doi: 10.3321/j.issn:1001-7372.2005.02.019 [4] Bureau of Transportation Statistics, US Department of Transportation. Transportation statistics annual report 2003[R]. Washington DC: Bureau of Transportation Statistics, US Department of Transportation, 2003. [5] Bureau of Transportation Statistics, US Department of Transportation. Transportation statistics annual report 2007[R]. Washington DC: Bureau of Transportation Statistics, US Department of Transportation, 2007. [6] Bureau of Transportation Statistics, US Department of Transportation. National transportation statistics 2007[R]. Washington DC: Bureau of Transportation Statistics, US Department of Transportation, 2007. [7] 肖润谋, 陈荫三, 李彬. 2009年中国高速公路网运输状态[J]. 交通运输工程学报, 2011, 11(3): 61-67. http://transport.chd.edu.cn/article/id/201103011XIAO Run-mou, CHEN Yin-san, LI Bin. Transportation status of Chinese expressway network in 2009[J]. Journal of Traffic and Transportation Engineering, 2011, 11(3): 61-67. (in Chinese) http://transport.chd.edu.cn/article/id/201103011 [8] 交通运输部综合规划司. 2008中国高速公路运输量调查分析报告[M]. 北京: 人民交通出版社, 2009.Department of Comprehensive Planning, Ministry of Tran-port. Survey and Statistics of Chinese Expressway Transportation Volume in 2008[M]. Beijing: China Communications Press, 2009. (in Chinese) [9] 陈荫三, 肖润谋, 马暕, 等. 2006年全国高速公路网运输分析[J]. 交通运输工程学报, 2008, 8(3): 91-96. doi: 10.3321/j.issn:1671-1637.2008.03.020CHEN Yin-san, XIAO Run-mou, MA Jian, et al. Transportation analysis of Chinese expressway network in 2006[J]. Journal of Traffic and Transportation Engineering, 2008, 8(3): 91-96. (in Chinese) doi: 10.3321/j.issn:1671-1637.2008.03.020 [10] 陈荫三, 肖润谋, 秦华容. 2007年中国高速公路网运输分析[J]. 交通运输工程学报, 2009, 9(2): 83-88. doi: 10.3321/j.issn:1671-1637.2009.02.015CHEN Yin-san, Xiao Run-mou, QIN Hua-rong. Transportation analysis of Chinese expressway network in 2007[J]. Journal of Traffic and Transportation Engineering, 2009, 9(2): 83-88. (in Chinese) doi: 10.3321/j.issn:1671-1637.2009.02.015 [11] 秦华容, 杨铭. 美国货运数据需求与供给分析[J]. 物流技术, 2009, 28(2): 145-147. doi: 10.3969/j.issn.1005-152X.2009.02.047QIN Hua-rong, YANG Ming. Analysis on demand and supply of freight transportation data in America[J]. Logistics Technology, 2009, 28(2): 145-147. (in Chinese) doi: 10.3969/j.issn.1005-152X.2009.02.047 [12] Federral Highway Administration, US Department of Transportation. 2001 Federal highway cost allocation study[R]. Washington DC: Federal Highway Administration, US Department of Transportation, 2001. [13] Federral Highway Administration, US Department of Transportation. 2005 Federal highway cost allocation study[R]. Washington DC: Federal Highway Administration, US Department of Transportation, 2005. [14] American Association of State Highway and Transportation Officials(AASHTO). Intercity passenger rail: achieving the vision[R]. Washington DC: AASHTO, 2009. -


 点击查看大图
计量
- 文章访问数: 561
- HTML全文浏览量: 74
- PDF下载量: 441
- 被引次数: 0
