

Macroscopic econometrics model of traffic accident
Article Text (Baidu Translation)
-
摘要: 从经济发展水平、人口数量、汽车保有量、道路情况等宏观因素入手, 研究了国内外道路交通事故规律, 分析了人均GDP与千人汽车保有量、万车死亡率、10万人口死亡率之间的关系。以宏观计量经济学和柯布-道格拉斯函数为基础, 利用7个国家的历史数据构建了交通事故面板数据模型。分别采用固定效应模型和随机效应模型进行参数估计, 并进行了Hausman检验, 得到7个国家的交通事故宏观计量经济学模型。计算结果表明: 在交通事故参数中, 10万人口死亡率与人均GDP、人均道路长度呈正相关, 与千人汽车保有量呈负相关; 通过Hausman检验, 自由度为3的卡方分布值为3.91, 概率为0.02, 小于0.05的置信区间; 与随机效应模型相比, 固定效应模型各变量的置信区间都小于0.05, 拟合优度更好。可见, 本文模型有效。Abstract: From the points of macroscopic factors such as economic development level, population number, vehicle ownership and road condition, the regularities of traffic accidents at home and abroad were analyzed.The relations among per capita GDP and vehicle ownership per 1 000 population, mortality per 10 000 vehicles, mortality per 100 000 population were studied.Based on macroscopic econometrics and Cobb-Douglas function, the panel data model of traffic accident was set up by using the historical data in seven countries.Fixed effect model and random effect model were used to estimate parameters respectively, Hausman test was carried out, and the macroscopic econometrics models of traffic accidents for the seven countries were set up.Calculation result shows that among the parameters of traffic accidents, mortality per 100 000 population is negative correlation with per capita GDP and per capita road length, mortality per 100 000 population is positive correlation with vehicle ownership per 1 000 population.Through Hausman test, chi-square distribution value is 3.91 when freedom is 3, the probability is 0.02 and less than the confidence level which is 0.05.Compared with the random effect model, all the confidence levels of variables for fixed effect model are less than 0.05, and the goodness of fit is better.So the fixed effect model is effective.
-
Key words:
- traffic safety /
- accident model /
- panel data /
- macroscopic estimation /
- fixed effect /
- random effect /
- Hausman test
-

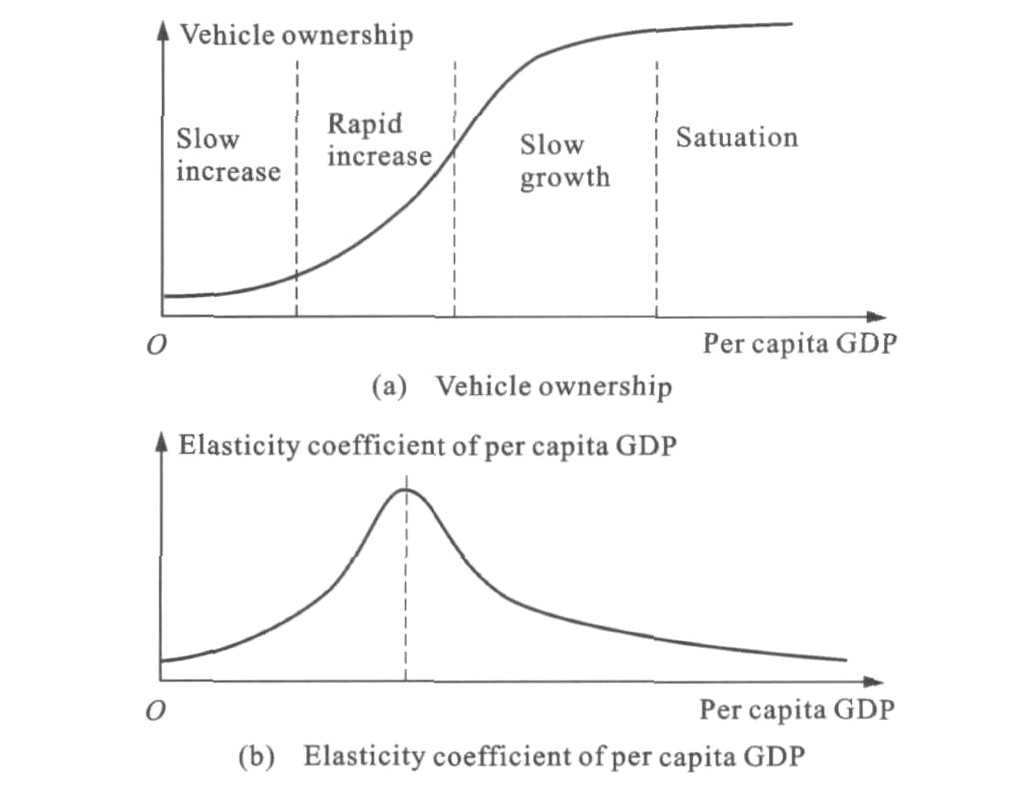
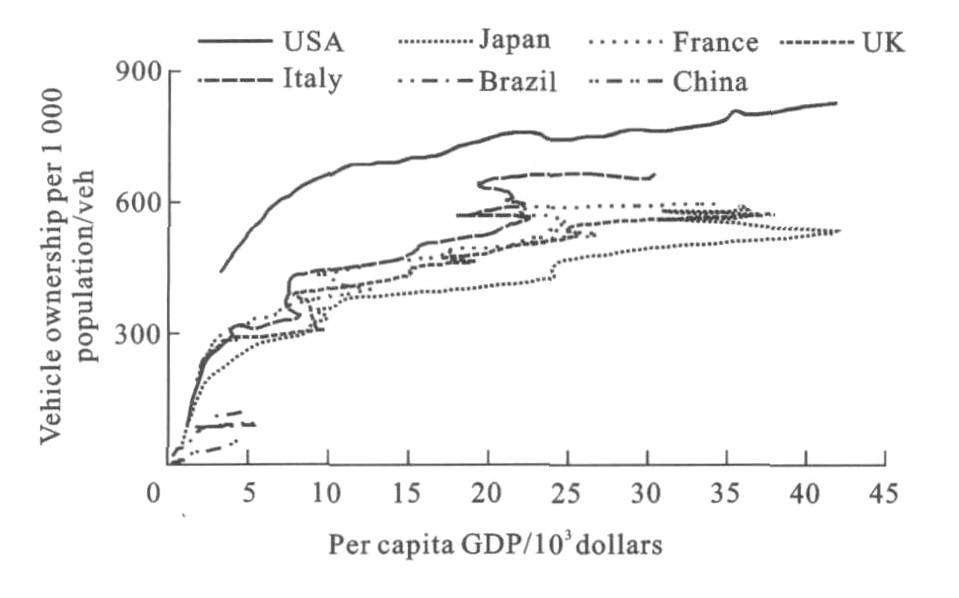
Figure 1. Relations between per capita GDPs and vehicle ownerships per 1 000 population
Table 1. Regression result of fixed effect model
Parameters 
t test value p value ln(G) -0.644 60 -25.68 0.000 ln(R) -0.293 15 -3.28 0.027 ln(V) 1.035 67 24.69 0.000 a 0.977 37 1.95 0.000 u 0.476 64  下载: 导出CSV
Table 2. Regression result of random effect model
Parameters 
t test value p value ln(G) -0.642 87 -25.69 0.000 ln(R) -0.302 62 -3.57 0.001 ln(V) 1.033 13 24.85 0.000 a 0.919 29 24.85 0.072 u 0.471 88
下载: 导出CSV
Table 3. Hausman test
Parameters 
ln(G) -0.644 60 -0.642 87 -0.001 73 ln(R) -0.293 15 -0.302 63 0.009 48 ln(V) 1.035 67 1.033 13 0.002 54
下载: 导出CSV
-
[1] JIA Shou-zhen, LI Zhao-peng, CHEN Si-yuan, et al. The applicability discussion of the Smeed model[J]. Journal of Xi'an Highway University, 1998, 18(3): 276-279. [2] ZHANG Wei-hua, LU Hua-pu. Analysis of vehicle delay of intersections with persignals based on bus priority[J]. China Journal of Highway and Transport, 2005, 18(4): 78-82. [3] LASSARRE S. Analysis of progress in road safety in ten European countries[J]. Accident Analysis and Prevention, 2001, 33(6): 743-751. doi: 10.1016/S0001-4575(00)00088-9 [4] KOPITS E, CROPPER M. Traffic fatalities and economic growth[R]. Washington DC: World Bank Group, 2003. [5] AN Wu-mei. Macroscopical analysis and modeling in traffic safety[D]. Beijing: Beijing University of Technology, 2002. [6] YE Xing-cheng. A systemic research on the road safety[D]. Wuhan: Wuhan University of Technology, 2005. [7] LIU Yun-tong. A fuzzy-based model for macroscopic evaluation of road traffic safety[J]. China Journal of Highway and Transport, 1995, 8(S1): 169-175. [8] PAGE Y. A statistical model to compare road mortality in OECD countries[J]. Accident Analysis and Prevention, 2001, 33(3): 371-385. doi: 10.1016/S0001-4575(00)00051-8 [9] XU Ting, SUN Xiao-duan, WANG Wei-li, et al. Highway accidents statistical analysis with panel data model[J]. Journal of Beijing University of Technology, 2010, 36(4): 495-499. [10] State Statistical Bureau. China Statistical Yearbook in 2010[M]. Beijing: China Statistics Press, 2010. [11] International Road Federation. World road statistics[D]. Washington DC: International Road Federation, 2009. [12] Japan Automobile Manufacturers Association. World motor vehicle statistics in 2010[R]. Tokyo: Japan Automobile Manufacturers Association, 2011. [13] World Bank Group. World development indicators[R]. Washington DC: World Bank Group, 2009. [14] PAULOZZI L J, RYAN G W, ESPITIA-HARDEMAN V E, et al. Economic development's effect on road transport-related mortality among different types of road users: a cross-sectional international study[J]. Accident Analysis and Prevention, 2007, 39(3): 606-617. doi: 10.1016/j.aap.2006.10.007 [15] SCUFFHAM P A, LANGLEY J D. A model of traffic crashes in New Zealand[J]. Accident Analysis and Prevention, 2002, 34(5): 673-687. doi: 10.1016/S0001-4575(01)00067-7 [16] LI Ju-ping. Mechanism improvement for road traffic accidents indentification[J]. Journal of Chang'an University: Social Science Edition, 2009, 11(3): 26-29, 35. [17] QIAO Xiang-ming, XU An, SHU Wei. Developing tendency fore cast of road traffic accident in China[J]. Journal of Chang'an University: Natural Science Edition, 2004, 24(6): 64-66. [18] YANG Shao-wei, WANG Hai-jun, ZHANG Chi, et al. Reation between possible speed and traffic acciderct[J]. Journal of Chang'an University: Natural Science Edition, 2009, 29(4): 34-38. -


 点击查看大图
图(6) / 表(3)
计量
- 文章访问数: 790
- HTML全文浏览量: 75
- PDF下载量: 1122
- 被引次数: 0
