

-
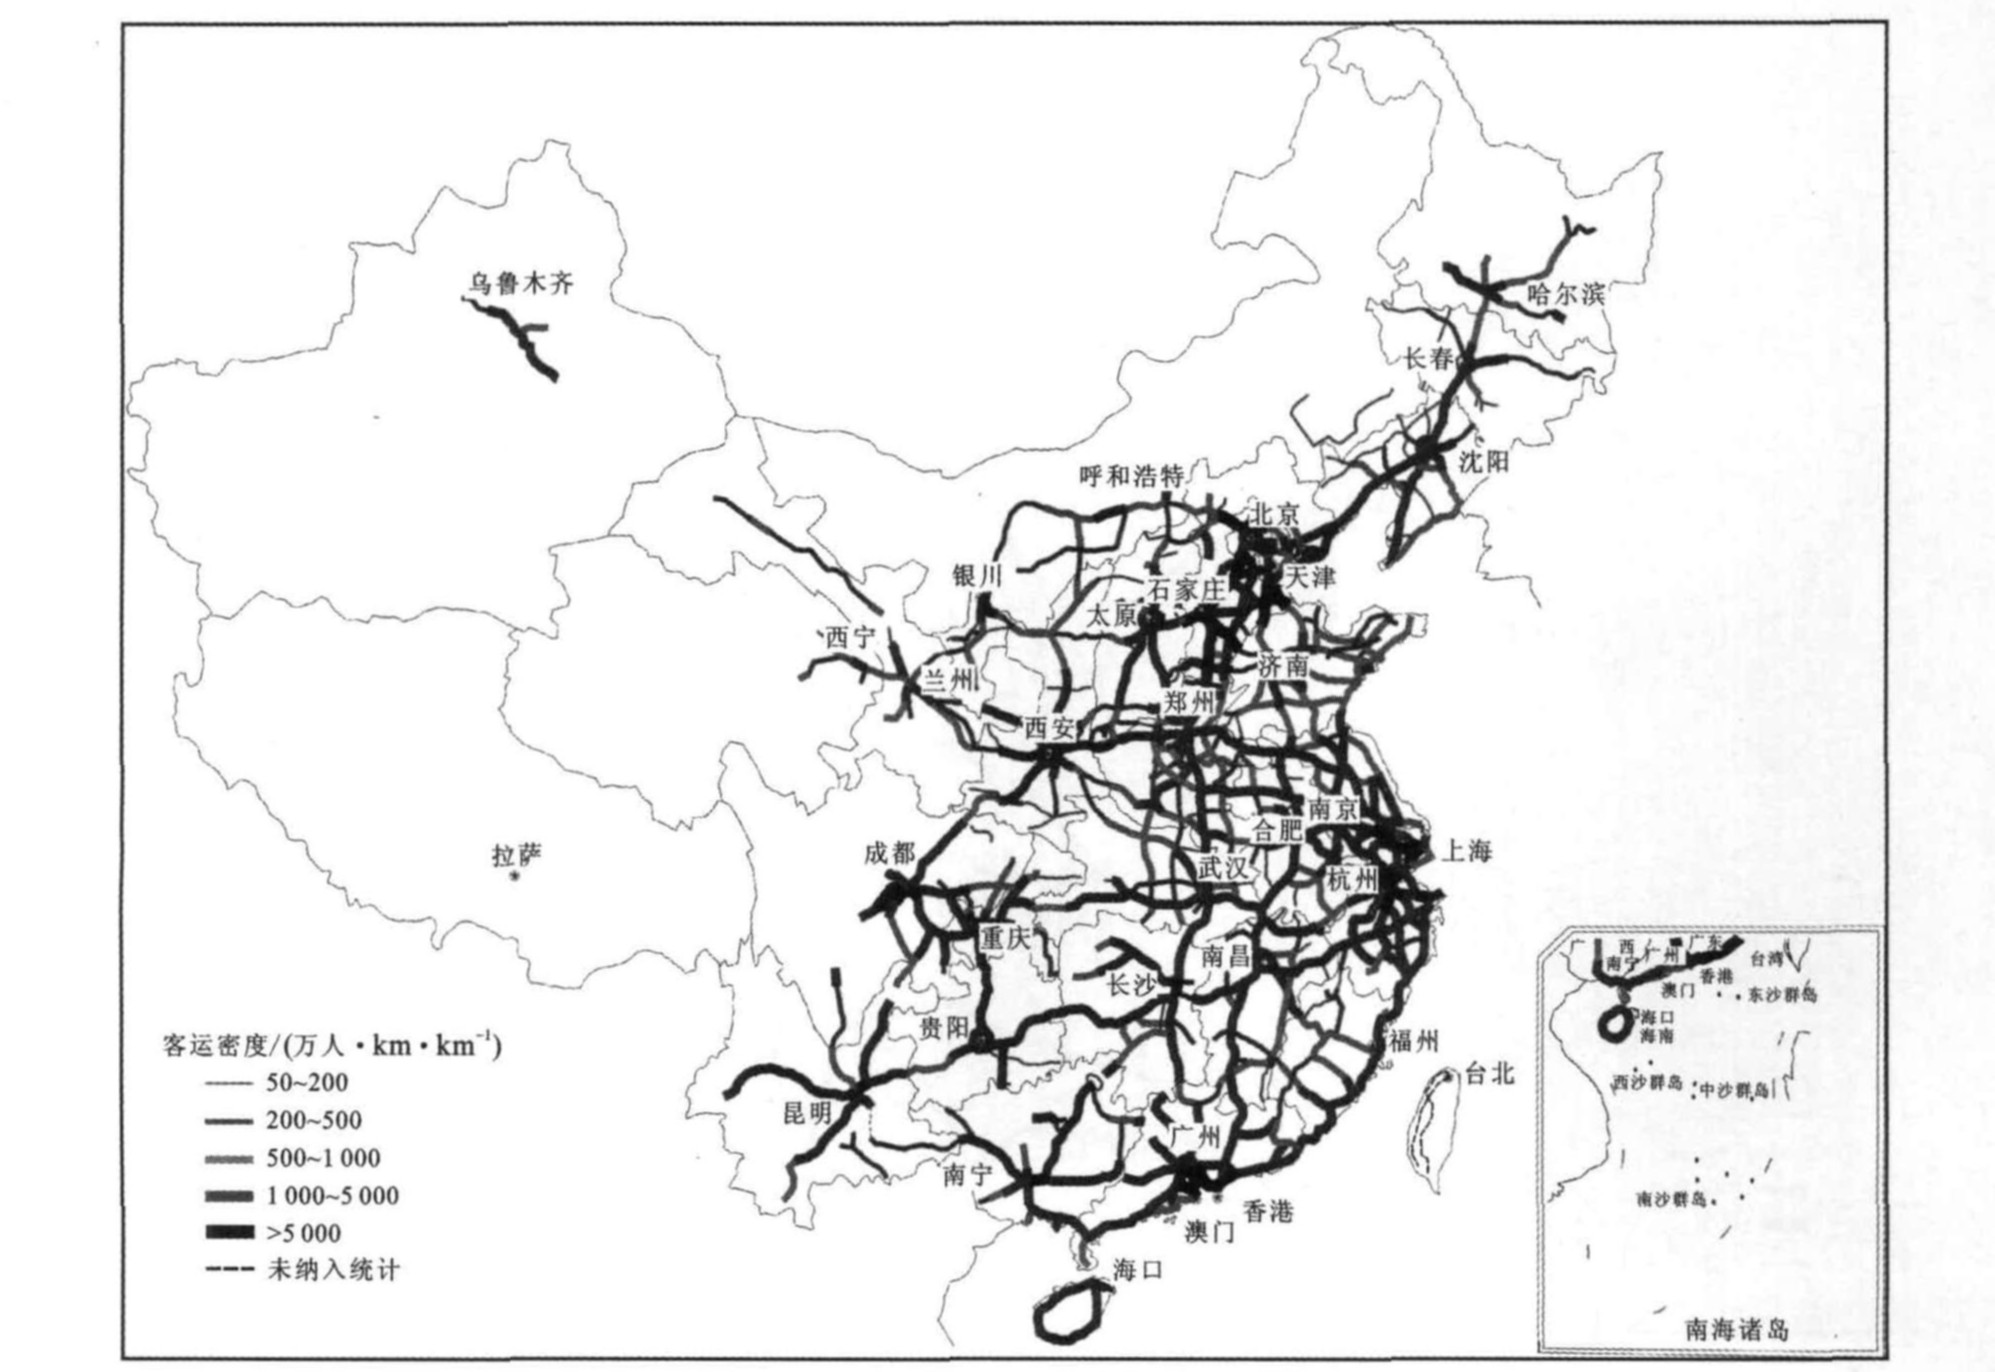
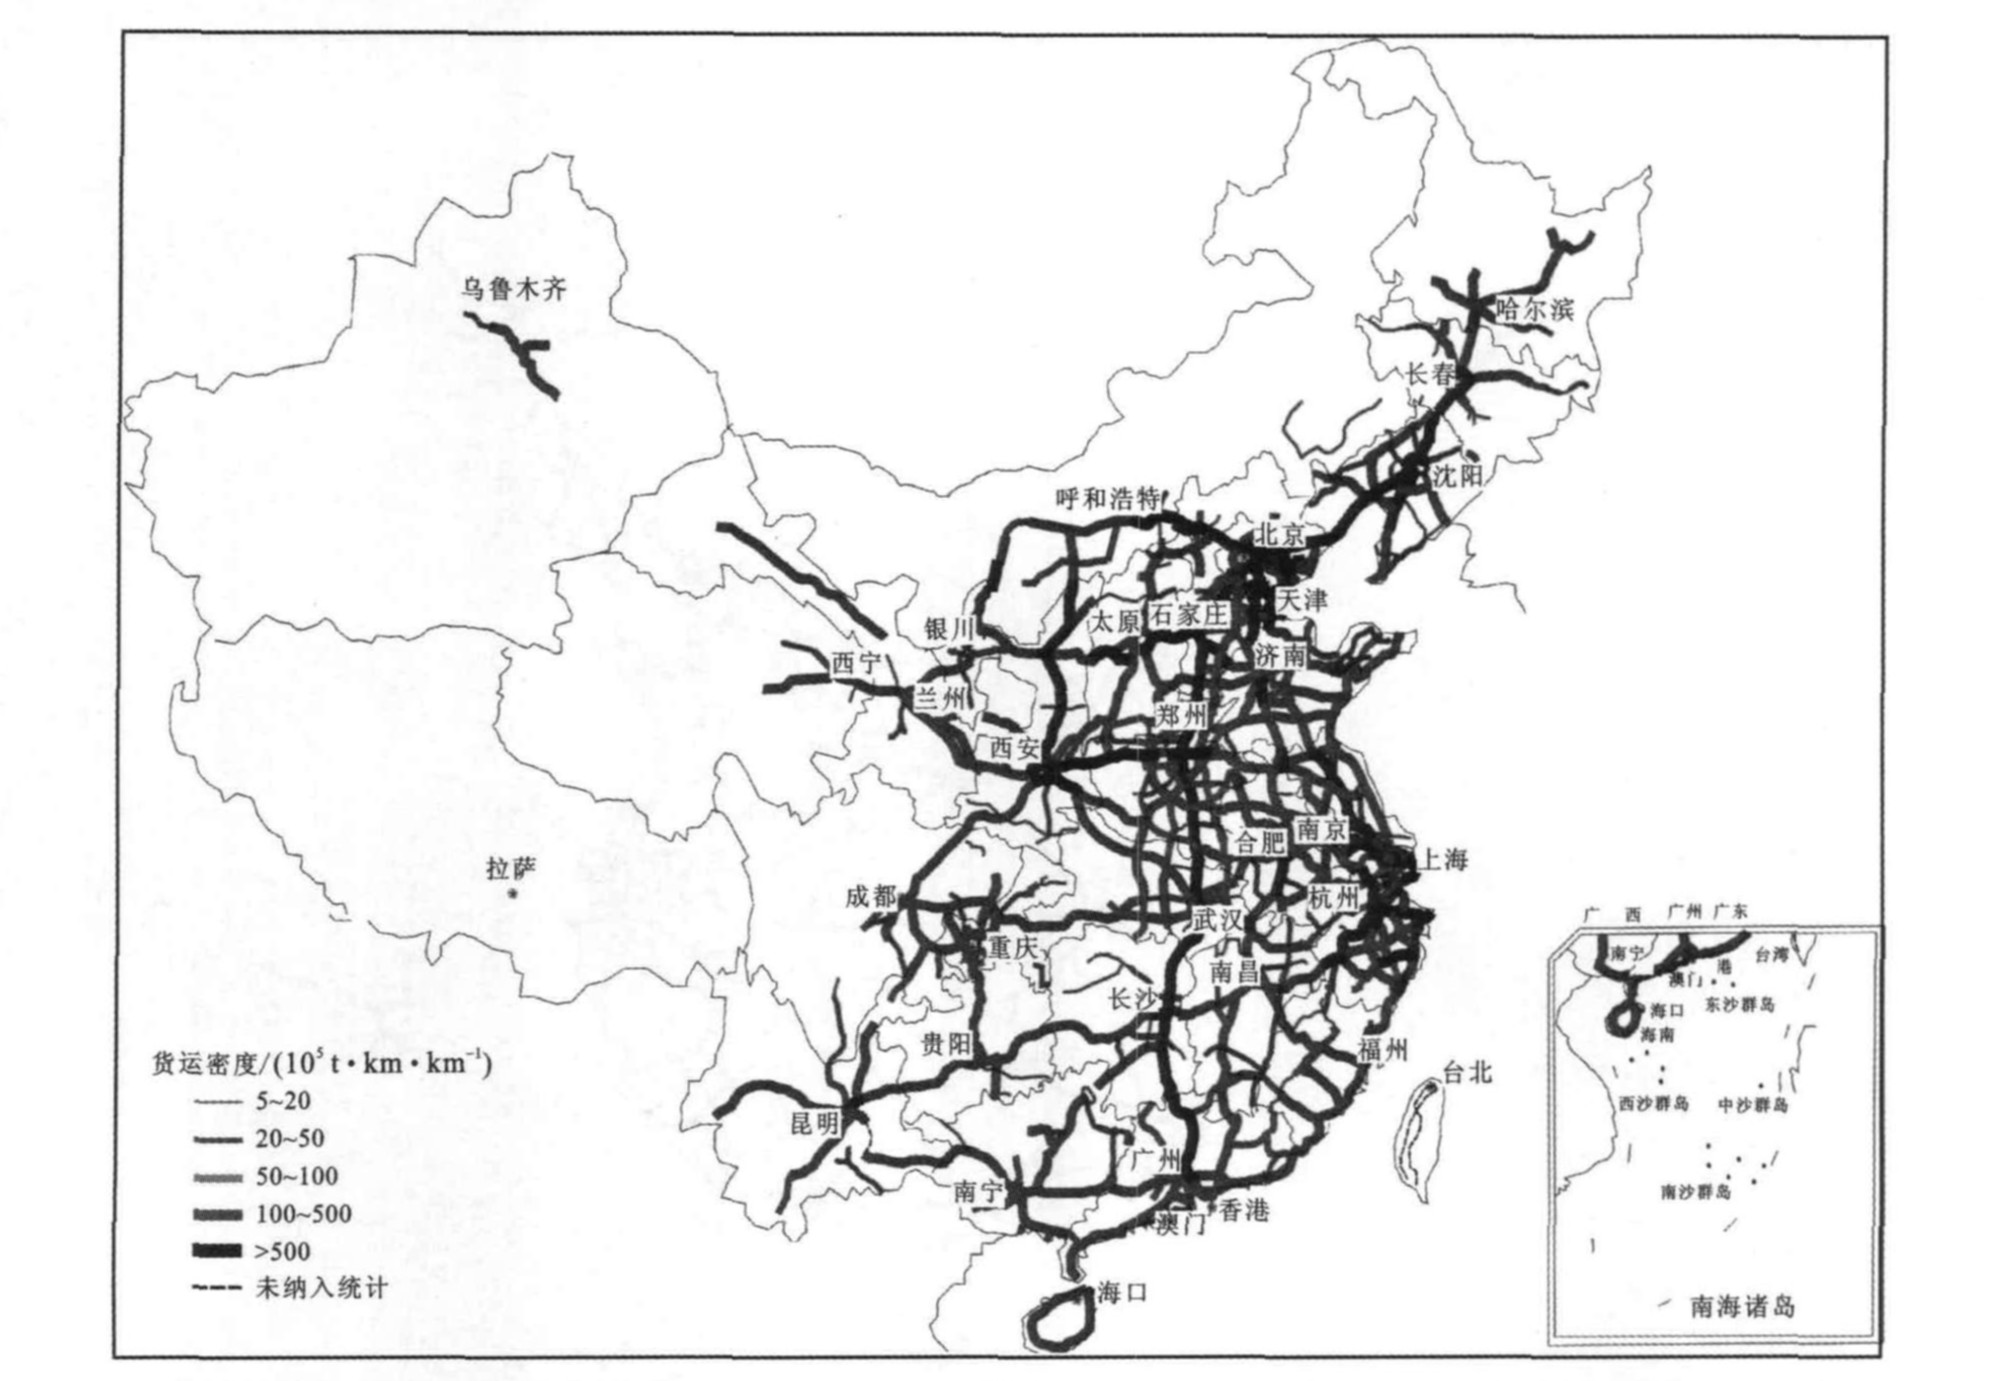
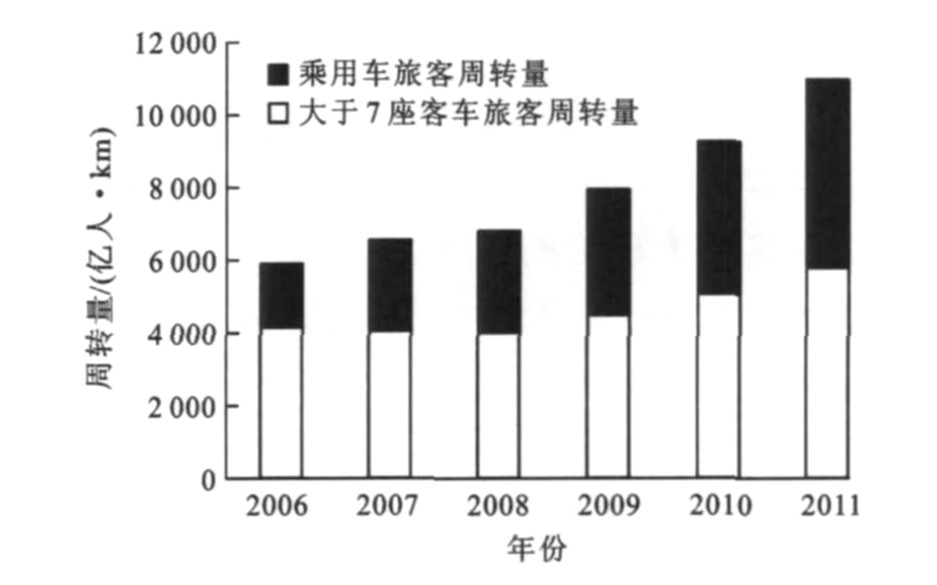
摘要: 以中国高速公路联网收费系统数据库为主, 辅以收费站典型抽样调查, 分析了2011年中国高速公路网运输状态。分析结果表明: 与2010年相比, 2011年度高速公路网客运密度增长4.09%;小客车(不大于7座)完成的周转量在旅客周转量中的比重为47.10%, 同比上升2.01%;Ⅰ型客车平均速度下降1.97%, Ⅱ型客车平均速度上升2.07%, Ⅲ型客车平均速度下降0.84%, Ⅳ型客车平均速度下降0.35%;货运密度同比下降1.01%, 汽车列车完成货物周转量的82.31%, 货运车辆的空车走行率为22.24%, 同比上升2.19%;按照GB 1589-2004治超标准, 超限30%以上的货车比重为3.92%。2011年, 中国高速公路旅客运输持续保持了高速增长态势, 货物运输增长态势有所放缓。Abstract: Based on the database of expressway network toll system and the typical sampling investigation data at toll stations, the transportation status of Chinese expressway network in 2011 was analyzed. Analysis result shows that compared with the transportation status in 2010, passenger transportation density in expressway network in 2011 rose by 4.09%. 47.10% of passenger turnover volume was produced by mini-type buses(the seat amount of every bus is less than 8), and the volume rose by 2.01%. The average speed of Ⅰ-type bus reduced by 1.97%, the average speed of Ⅱ-type bus rose by 2.07%, the average speed of Ⅲ-type bus reduced by 0.84%, and the average speed of Ⅳ-type bus reduced by 0.35%. Freight transportation density reduced by 1.01%, and 82.31% of freight turnover volume was produced by tractor-trailer combination. The percentage of empty to loaded truck kilometers was 22.24% and rose by 2.19%. According to the standard of GB 1589—2004, the percentage of trucks with the overweight more than 30% was 3.92%. In 2011, the passenger transportation of Chinese expressway network kept continuous high-speed growth, however, the increasing speed of freight transportation reduced.
-
表 1 乘用车客运比重
Table 1. Passenger transportation proportions of passenger cars
年份 2006 2007 2008 2009 2010 2011 旅客周转量比重/% 29.75 38.12 41.01 43.30 45.09 47.10 客运量比重/% 41.07 46.54 48.54 53.94 56.56 60.09  下载: 导出CSV
表 2 客车平均速度
Table 2. Average speeds of buses
车型 座位数量 平均速度/(km·h-1) 样本数量/104 veh Ⅰ ≤7 88.69 115 726 Ⅱ 8~19 84.19 3 062 Ⅲ 20~39 81.77 4 936 Ⅳ ≥40 83.93 3 243
下载: 导出CSV
表 3 2006~2011年货物周转量发展趋势
Table 3. Growth trends of freight turnover volumes in 2006-2011
运输方式 2006年 2007年 2008年 2009年 2010年 2011年 周转量/(108 t·km) 周转量/(108 t·km) 增长率/% 周转量/(108 t·km) 增长率/% 周转量/(108 t·km) 增长率/% 周转量/(108 t·km) 增长率/% 周转量/(108 t·km) 增长率/% 铁路 21 954 24 214 10.3 25 106 14.4 25 239 15.0 27 644 25.9 29 130 32.7 内河和沿海水运 12 908 15 599 20.8 17 413 34.9 18 031 39.7 22 428 73.8 26 068 102.0 高速公路 7 458 9 970 33.7 11 981 60.6 13 517 81.2 17 452 134.0 19 802 165.5
下载: 导出CSV
表 4 货车平均速度
Table 4. Average speeds of trucks
车型 轴型 平均速度/(km·h-1) 样本数量/104 veh 单车 2轴4胎 68.78 6 307 2轴6胎 61.09 16 399 3轴和4轴 57.51 8 240 半挂列车 3~6轴 55.65 23 208
下载: 导出CSV
表 5 2011年高速公路货车主要轴型
Table 5. Chief axis types of trucks in 2011

表 6 货车车数比重
Table 6. Amount proportions of trucks
% 车型 2006年 2007年 2008年 2009年 2010年 2011年 2轴4胎 17.48 12.40 10.28 13.39 11.43 11.44 2轴6胎 48.79 42.43 35.36 33.31 31.00 30.84 3轴与4轴单车 13.26 16.42 19.68 15.97 15.76 15.17 半挂列车 20.47 28.75 34.68 37.33 41.81 42.55
下载: 导出CSV
表 7 货车行驶量比重
Table 7. Kilometers proportions of trucks
% 车型 2006年 2007年 2008年 2009年 2010年 2011年 2轴4胎 7.74 6.25 6.84 7.82 6.84 6.76 2轴6胎 38.24 33.67 27.84 24.93 22.62 22.49 3轴与4轴单车 17.60 19.13 18.07 17.22 15.54 14.74 半挂列车 36.42 40.95 47.25 50.03 55.00 56.01
下载: 导出CSV
表 8 货车完成的货物周转量比重
Table 8. Proportions of freight turnover volumes for trucks
% 车型 2006年 2007年 2008年 2009年 2010年 2011年 2轴4胎 1.42 0.95 0.57 1.12 0.78 0.69 2轴6胎 18.60 13.02 9.87 7.47 5.83 5.54 3轴与4轴单车 20.25 19.83 18.07 15.27 12.44 11.46 半挂列车 59.73 66.20 71.49 76.14 80.95 82.31
下载: 导出CSV
表 9 空车走行率
Table 9. Percentages of empty to loaded truck kilometers
% 车型 年份 省内运输 跨省运输 总量 2轴单车 2011 35.30 26.13 31.65 2010 37.60 29.10 33.30 2009 34.77 24.95 30.48 2008 32.78 18.84 26.33 2007 36.17 15.03 24.95 2006 36.01 15.87 26.52 3轴与4轴单车 2011 34.44 12.30 20.23 2010 34.17 12.42 17.93 2009 35.03 9.46 16.95 2008 36.40 10.81 18.05 2007 33.24 8.38 15.00 2006 32.82 9.38 17.73 半挂列车 2011 43.27 10.84 18.48 2010 31.34 13.14 14.90 2009 34.14 7.90 14.73 2008 42.67 10.16 18.37 2007 28.74 10.37 15.28 2006 35.02 9.28 13.93 合计 2011 38.33 13.55 22.24 2010 34.42 16.37 20.05 2009 34.56 11.68 19.84 2008 36.71 12.37 20.97 2007 33.30 11.37 18.93 2006 35.33 10.97 20.13
下载: 导出CSV
表 10 装载货车车数比重
Table 10. Proportions of trucks classified by load conditions
% 治超标准 空车 不超限重车 超限0~30% 超限30%~50% 超限50%~100% 超限大于100% 超限合计 国家强制标准 26.95 44.05 25.08 2.28 1.39 0.25 100.00 路政治超标准 26.95 65.72 6.06 0.76 0.43 0.08 100.00
下载: 导出CSV
表 11 绿色通道运输车辆构成比重
Table 11. Percentages of trucks through green path
轴数 2轴 3轴 4轴 5轴 6轴 绿色通道车辆数比重/% 64.00 7.09 15.11 0.65 13.15 全国高速公路总体车辆数比重/% 42.28 7.74 11.56 5.29 33.13
下载: 导出CSV
表 12 ETC系统相关数据
Table 12. Related data of ETC system
类别 北京 上海 江苏 收费站总数量 181 103 316 设置ETC的收费站数量 175 75 260 ETC覆盖率/% 96.68 72.82 82.28 ETC出口交通量与总出口交通量之比/% 23.23 13.04 10.44 ETC出口车道数量 193 95 303 ETC出口车道平均交通量/(veh·h-1) 38 34 13 ETC出口车道平均交通量小于4 veh·h-1的收费站数量 42 4 116
下载: 导出CSV
-
[1] 交通运输部综合规划司, 长安大学运输科学研究院. 2010中国高速公路运输量统计调查分析报告[M]. 北京: 人民交通出版社, 2011.Department of Comprehensive Planning, Ministry of Transport, Research Institute of Transporation Science, Chang'an University. Survey and Statistics of Chinese Expressway Transport Volume in 2010[M]. Beijing: China Communications Press, 2011. (in Chinese). [2] 交通运输部综合规划司. 2011年公路水路交通运输行业发展统计公报[R]. 北京: 交通运输部综合规划司, 2012.Department of Comprehensive Planning, Ministry of Transport. Highway and waterway transportation industry statistical bulletin in 2011[R]. Beijing: Department of Comprehensive Planning, Ministry of Transport, 2012. (in Chinese). [3] PARK J Y, GORDON P, MOORE J E, et al. A two-step approach to estimating state-to-state commodity trade flows[J]. The Annals of Regional Science, 2008, 43(4): 1033-1072. [4] WOLF J, BONSALL P, OLIVEIRA M, et al. Review of the potential role of new technologies in the national travel survey[R]. Leeds: University of Leeds, 2009. [5] 秦华容, 杨铭. 美国货运数据需求与供给分析[J]. 物流技术, 2009, 28(2): 145-147. https://www.cnki.com.cn/Article/CJFDTOTAL-WLJS200902047.htmQIN Hua-rong, YANG Ming. Analysis on demand and supply of freight transportation data in America[J]. Logistics Technology, 2009, 28(2): 145-147. (in Chinese). https://www.cnki.com.cn/Article/CJFDTOTAL-WLJS200902047.htm [6] 陈荫三, 李彬, 肖润谋. 2010年中国高速公路网运输状态[J]. 交通运输工程学报, 2011, 11(6): 68-73. http://transport.chd.edu.cn/article/id/201106011CHEN Yin-san, LI Bin, XIAO Run-mou. Transportation status of Chinese expressway network in 2010[J]. Journal of Traffic and Transportation Engineering, 2011, 11(6): 68-73. (in Chinese). http://transport.chd.edu.cn/article/id/201106011 [7] 杨铭, 秦华容, 陈荫三. 区域公路货物周转量结构分析与推算方法[J]. 交通运输工程学报, 2011, 11(5): 93-99. http://transport.chd.edu.cn/article/id/201105015YANG Ming, QIN Hua-rong, CHEN Yin-san. Structure analysis and calculation method of freight turnover for regional highway[J]. Journal of Traffic and Transportation Engineering, 2011, 11(5): 93-99. (in Chinese). http://transport.chd.edu.cn/article/id/201105015 [8] 中华人民共和国铁道部. 2011年铁道统计公报[R]. 北京: 中华人民共和国铁道部, 2012.The Ministry of Railways of the People's Republic of China. Railway annual statistics bulletin in 2011[R]. Beijing: The Ministry of Railways of the People's Republic of China, 2012. (in Chinese). [9] Bureau of Transportation Statistics, US Department of Transportation. National transportation statistics 2007[R]. Washington DC: Bureau of Transportation Statistics, US Department of Transportation, 2007. [10] Bureau of Transportation Statistics, US Department of Transportation. National transportation statistics 2010[R]. Washington DC: Bureau of Transportation Statistics, US Department of Transportation, 2010. [11] Bureau of Transportation Statistics, US Department of Transportation. National transportation statistics 2011[R]. Washington DC: Bureau of Transportation Statistics, US Department of Transportation, 2011. [12] Bureau of Transportation Statistics, US Department of Transportation. National transportation statistics 2012[R]. Washington DC: Bureau of Transportation Statistics, US Department of Transportation, 2012. [13] 董忠红, 吕彭民. 高等级路面上的车辆动载荷[J]. 长安大学学报: 自然科学版, 2011, 30(1): 95-99. https://www.cnki.com.cn/Article/CJFDTOTAL-XAGL201001021.htmDONG Zhong-hong, LU Peng-min. Dynamic load of vehicle on high-class pavement[J]. Journal of Chang'an University: Natural Science Edition, 2011, 30(1): 95-99. (in Chinese). https://www.cnki.com.cn/Article/CJFDTOTAL-XAGL201001021.htm [14] 温德坤. 关于高速公路绿色通道车辆快速检查方案的探讨[J]. 交通标准化, 2010(16): 222-224. https://www.cnki.com.cn/Article/CJFDTOTAL-JTBH201015064.htmWEN De-kun. Expeditious vehicle detection scheme in green channel on expressway[J]. Communications Standardization, 2010(16): 222-224. (in Chinese). https://www.cnki.com.cn/Article/CJFDTOTAL-JTBH201015064.htm [15] 张玉玲, 林莉贤, 解晓玲. 关于收费公路降低费率和推广ETC问题的分析[J]. 中国交通信息化, 2011(12): 20-23. https://www.cnki.com.cn/Article/CJFDTOTAL-YSZH201111007.htmZHANG Yu-ling, LIN Li-xian, XIE Xiao-ling. Analysis on toll roads to reduce rates and promotion ETC[J]. China ITS Journal, 2011(12): 20-23. (in Chinese). https://www.cnki.com.cn/Article/CJFDTOTAL-YSZH201111007.htm [16] 交通运输部综合规划司. 2001年公路水路交通行业发展统计公报[R]. 北京: 交通运输部综合规划司, 2002.Department of Comprehensive Planning, Ministry of Transport. Highway and waterway transportation industry statistical bulletin in 2001[R]. Beijing: Department of Comprehensive Planning, Ministry of Transport, 2002. (in Chinese). -

 点击查看大图
计量
- 文章访问数: 655
- HTML全文浏览量: 81
- PDF下载量: 795
- 被引次数: 0
