

Dynamic situation combination decomposition model of urban traffic energy consumption
-
摘要: 分析了现有的城市交通结构, 以机动车保有量、百公里油耗与年行驶里程为影响因素, 引入影响因素的变化率作为参数, 运用迪氏指数分解模型, 建立了城市交通能耗动态情景组合分解模型。根据3个影响因素的变化情况, 设置了12种情景组合模式, 分析了不同情景组合模式下的城市交通能耗变化趋势。分析结果表明: 最大总能耗增量为174.92万吨标准煤, 3个影响因素的能耗贡献率分别为91.79%、-9.57%、17.78%, 最小总能耗增量为55.06万吨标准煤, 3个影响因素的能耗贡献率分别为128.10%、-52.34%、24.24%;按机动车保有量增速将12种情景模式分为低速增长、中速增长、高速增长3类方案, 3类方案能耗增量的最大值分别为87.02、130.97、174.92万吨标准煤, 最小值分别为55.06、94.08、134.55万吨标准煤。Abstract: The existing urban traffic structure was analyzed.The motor vehicle population, 100-kilometer fuel consumption and annual driving distance were taken as influence factors, the rate of influence factor was introduced as parameter, and the dynamic situation combination decomposition model of urban traffic energy consumption was set up by using logarithmic mean Divisia index(LMDI) model.Based on the change conditions of 3 influence factors, 12 situation combination modes were designed, and the change trends of urban traffic energy consumption under different situation combination modes were analyzed.Analysis result shows that the maximum increase amount of total energy consumption is 1.749 2×10⁶ t standard coal, the energy consumption rates of 3 influence factors are 91.79%, -9.57%, 17.78% respectively. The minimum increase amount of total energy consumption is 5.506×10⁵ t standard coal, the energy consumption rates of 3 influence factors are 128.10%, -52.34%, 24.24% respectively.Based on the increase speed of motor vehicle population, the 12 situation combination modes can be divided into 3 schemes such as low-speed increase scheme, middle-speed increase scheme and high-speed increase scheme.The maximum increase amounts of energy consumption for 3 schemes are 8.702×10⁵, 1.309 7×10⁶, 1.749 2×10⁶ t standard coal, the minimum values are 5.506×10⁵, 9.408×10⁵, 1.345 5×10⁶ t standard coal.
-

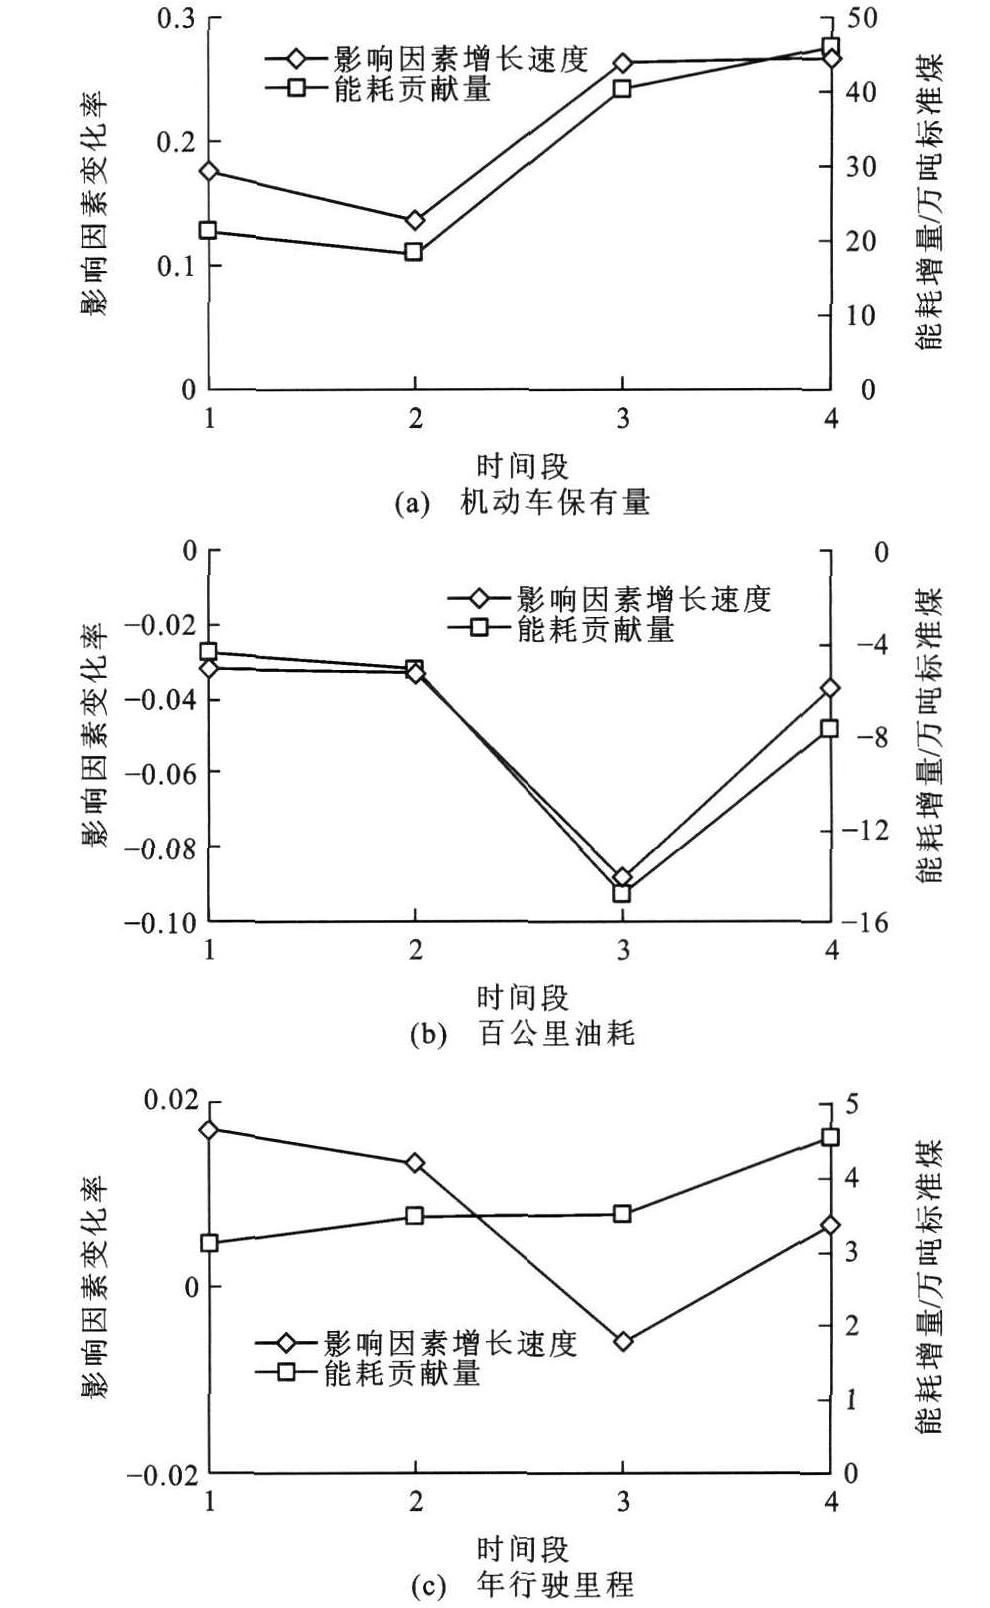
图 5 三个影响因素的能耗贡献率与贡献量
Figure 5. Energy contribution rates and contribution amounts of 3 influence factors
表 1 三个影响因素的能耗贡献量
Table 1. Energy consumption contribution amounts of three influence factors
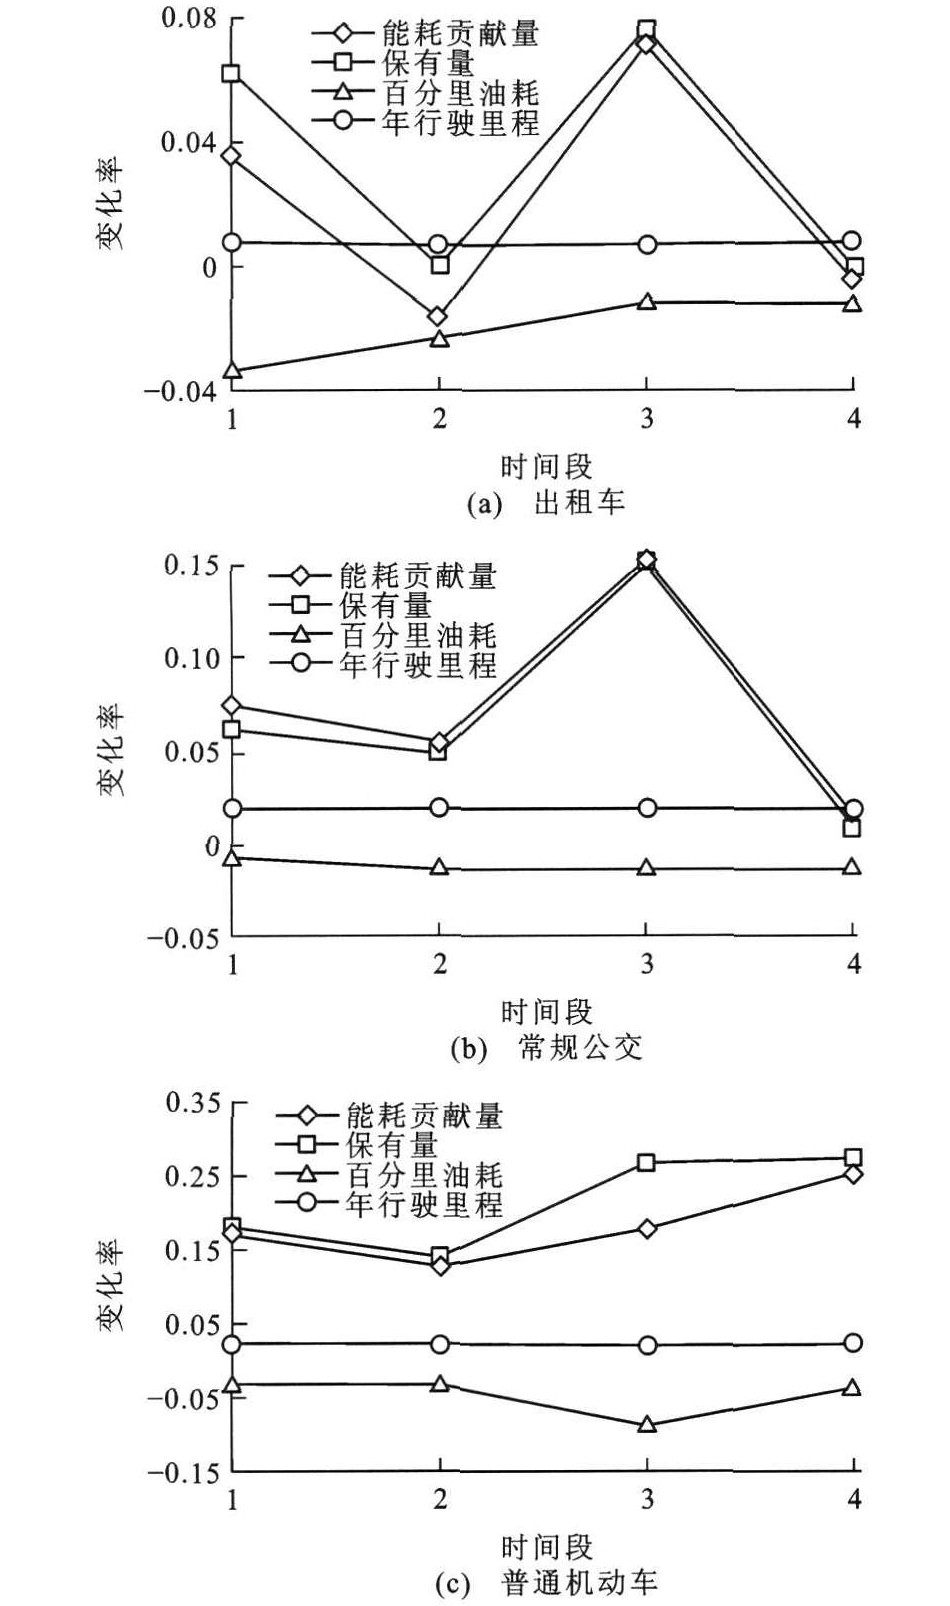
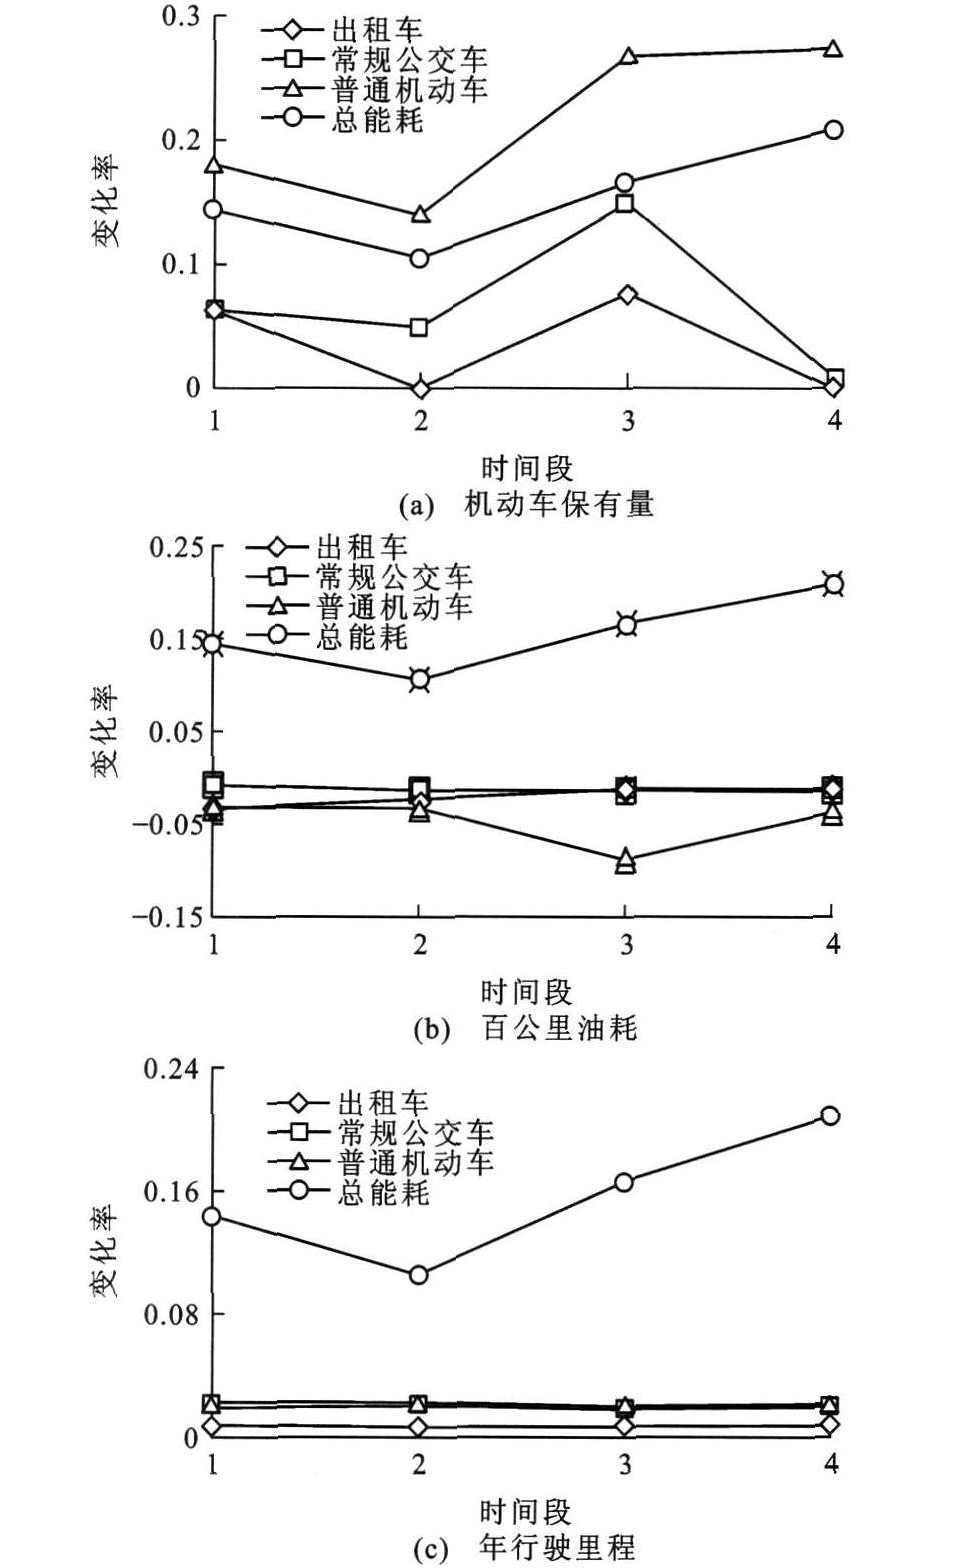
统计年份 总能耗变化量 保有量的能耗贡献量 百公里油耗的能耗贡献量 年行驶里程的能耗贡献量 2006~2007(时间段1) 19.98 21.35 -4.47 3.09 2007~2008(时间段2) 16.70 18.36 -5.10 3.44 2008~2009(时间段3) 29.08 40.37 -14.79 3.50 2009~2010(时间段4) 42.62 45.72 -7.64 4.55  下载: 导出CSV
表 2 能耗量分解结果
Table 2. Devision result of energy consumption amounts
情景组合 总能耗变化量 保有量能耗贡献量 百公里油耗能耗贡献量 年行驶里程能耗贡献量 2010年总能耗 2015年总能耗 1 71.84 72.54 -14.43 13.73 246.98 318.82 2 87.02 74.33 -14.79 27.47 246.98 334.00 3 55.06 70.53 -28.82 13.35 246.98 302.04 4 69.44 72.26 -29.52 26.71 246.98 316.42 5 113.79 114.54 -15.40 14.64 246.98 360.77 6 130.97 117.43 -15.78 29.33 246.98 377.95 7 94.80 111.31 -30.73 14.23 246.98 341.79 8 111.08 114.08 -31.50 28.49 246.98 358.06 9 155.75 156.54 -16.32 15.53 246.98 402.73 10 174.92 160.56 -16.74 31.10 246.98 421.91 11 134.55 152.04 -32.57 15.08 246.98 381.53 12 152.72 155.90 -33.39 30.21 246.98 399.70
下载: 导出CSV
表 3 各种情景组合模式下的能耗贡献率
Table 3. Energy consumption rates under different situation combination modes
情景组合 保有量的贡献率 百公里油耗的贡献率 年行驶里程的贡献率 1 100.98 -20.09 19.11 2 85.42 -16.99 31.57 3 128.10 -52.34 24.24 4 104.06 -42.52 38.46 5 100.66 -13.53 12.87 6 89.66 -12.05 22.39 7 117.40 -32.42 15.01 8 102.70 -28.36 25.65 9 100.51 -10.48 9.97 10 91.79 -9.57 17.78 11 112.99 -24.20 11.21 12 102.09 -21.86 19.78
下载: 导出CSV
-
[1] 黄建中. 1980年代以来我国特大城市居民出行特征分析[J]. 城市规划学刊, 2005(3): 71-75. doi: 10.3969/j.issn.1000-3363.2005.03.013HUANG Jian-zhong. Analysis on the characteristics of resident trip in Chinese mega-cities since1980s[J]. Urban Planning Forum, 2005(3): 71-75. (in Chinese). doi: 10.3969/j.issn.1000-3363.2005.03.013 [2] 张明, 穆海林. 基于LMDI分解方法的中国特大城市客运能源消耗研究[J]. 北京大学学报: 自然科学版, 2010, 46(3): 483-486. https://www.cnki.com.cn/Article/CJFDTOTAL-BJDZ201003029.htmZHANG Ming, MU Hai-lin. Research on the change of motorized passenger transport energy consumption in selected Chinese cities based on LMDI method[J]. Acta Scientiarum Naturalium Universitatis Pekinensis, 2010, 46(3): 483-486. (in Chinese). https://www.cnki.com.cn/Article/CJFDTOTAL-BJDZ201003029.htm [3] ZHANG Zhong-xiang. Decoupling Chinas carbon emissions increase from economic growth: an economic analysis and policy implications[J]. World Development, 2000, 28(4): 739-752. doi: 10.1016/S0305-750X(99)00154-0 [4] FAN Ying, LIU Lan-cui, WU Gang, et al. Change in carbon intensity in China: empirical findings from1980-2003[J]. Ecological Economics, 2007, 62(3/4): 683-691. [5] VINUYA F, DIFURIO F, SANDOVAL E. A decomposition analysis of CO 2 emissions in the United States[J]. AppliedEconomics Letters, 2010, 17(10): 925-931. [6] ANG B W, ZHANG F Q. A survey of index decomposition analysis in energy and environmental analysis[J]. Energy, 2000, 25(12): 1149-1176. doi: 10.1016/S0360-5442(00)00039-6 [7] ANG B W. Decomposition analysis for policy making in energy: which is the preferred method?[J]. Energy Policy, 2004, 32(9): 1131-1139. doi: 10.1016/S0301-4215(03)00076-4 [8] SORRELL S, LEHTONEN M, STADLETON L, et al. Decoupling of road freight energy use from economic growth in the United Kingdom[J]. Energy Policy, 2013, 41(2): 84-97. [9] BALEZENTIS A, BALEZENTIS T, STREIMIKIENE D. The energy intensity in Lithuania during1995-2009: a LMDI approach[J]. Energy Policy, 2011, 39(11): 7322-7334. doi: 10.1016/j.enpol.2011.08.055 [10] 李政, 付峰, 高丹. 中国特大城市客运交通能源需求变化的因素分析[J]. 清华大学学报: 自然科学版, 2008, 48(11): 1945-1948. doi: 10.3321/j.issn:1000-0054.2008.11.018LI Zheng, FU Feng, GAO Dan. Decomposition analysis of motorized passenger transport energy demand changes in selected Chinese cities[J]. Journal of Tsinghua University: Science and Technology, 2008, 48(11): 1945-1948. (in Chinese). doi: 10.3321/j.issn:1000-0054.2008.11.018 [11] 汪宏韬. 基于LMDI的上海市能源消费碳排放实证分析[J]. 环境与资源, 2010, 20(5): 143-146. https://www.cnki.com.cn/Article/CJFDTOTAL-ZGRZ2010S2038.htmWANG Hong-tao. Logarithmic mean divisia index model and the carbon emission mechanism of energy sector in Shanghai[J]. Resources and Environment, 2010, 20(5): 143-146. (in Chinese). https://www.cnki.com.cn/Article/CJFDTOTAL-ZGRZ2010S2038.htm [12] 朱松丽. 北京、上海城市交通能耗和温室气体排放比较[J]. 城市交通, 2010, 8(3): 58-63. https://www.cnki.com.cn/Article/CJFDTOTAL-CSJT201003015.htmZHU Song-li. Comparison of transportation energy consumption and greenhouse gas emission between Beijing and Shanghai[J]. Urban Transport of China, 2010, 8(3): 58-63. (in Chinese). https://www.cnki.com.cn/Article/CJFDTOTAL-CSJT201003015.htm [13] 贾顺平, 毛保华, 刘爽, 等. 中国交通运输能源消耗水平测算与分析[J]. 交通运输系统工程与信息, 2010, 10(1): 22-27. https://www.cnki.com.cn/Article/CJFDTOTAL-YSXT201001003.htmJIA Shun-ping, MAO Bao-hua, LIU Shuang, et al. Calculation and analysis of transportation energy consumption level in China[J]. Journal of Transportation Systems Engineering and Information Technology, 2010, 10(1): 22-27. (in Chinese). https://www.cnki.com.cn/Article/CJFDTOTAL-YSXT201001003.htm [14] EOM J Y, SCHIPPER L. Trends in passenger transport energy use in South Korea[J]. Energy Policy, 2010, 38(7): 3598-3607. [15] ANG B W. The LMDI approach to decomposition analysis: a practical guide[J]. Energy Policy, 2005, 33(7): 867-871. -


计量
- 文章访问数: 946
- HTML全文浏览量: 239
- PDF下载量: 736
- 被引次数: 0
