

Temporal-spatial features of probability distribution of vertical irregularity in ballasted track
-
摘要: 为研究有砟轨道不同线形区段上高低不平顺标准差所服从的最优概率分布函数及其时空特征, 采用三参数概率分布函数拟合有砟轨道高低不平顺标准差峰值及尾部特性, 选取了5种三参数理论分布函数, 并确定了最优概率分布函数的选择原则; 以既有沪昆线为例, 拟合了有砟轨道上6种不同线形区段上高低不平顺标准差服从的最优概率分布函数; 分析了高低不平顺标准差的时间特征, 采用非线性函数拟合了分布函数参数随时间的变化情况; 分析了高低不平顺标准差的空间特征, 比较了轨道质量状态在空间维度上的不同。分析结果表明: 在高低不平顺标准差大值区域, 三参数Lognormal分布理论值与实际值的相对误差小于5%, 而正态分布理论值与实际值的相对误差则大于50%, 因此, 采用三参数概率分布函数能有效解决两参数概率分布函数理论值在此区域与实际值发生偏离的问题; 在描述线形区段的统计分布特性时, 不同线形区段应选择不同的分布函数, 同一线形区段宜选取同一种分布函数; 既有沪昆线桥隧区段上, Burr分布有5次是最优概率分布, 且P值之差的均值和标准差分别为0.09和0.12;各区段高低不平顺标准差所服从分布的3个参数用非线性函数拟合的优度均大于0.6, 因此, 采用非线性函数可有效拟合3个参数随时间的变化规律; 维修与养护作业前后桥隧区段高低不平顺标准差的超限百分比都小于3%, 圆曲线、缓和曲线和直线区段上高低不平顺标准差的超限百分比为3.5%~12.8%, 而限速区段和道岔区段上均大于25%。确定的最优概率分布函数选择原则可应用于轨道不平顺概率分布特征研究。Abstract: To study the optimum probability distribution function and the temporal-spatial features of vertical irregularity standard deviations on different sections of ballasted track, the three-parameter probability distribution function was used to fit the features of peak value and the tail of vertical irregularity standard deviations of ballasted track. Five three-parameter theoretical distribution functions were selected, and the selection principle of the optimum probability distribution function was determined. Taking the existing Shanghai-Kunming Line as an example, the optimum probability distribution functions of vertical irregularity standard deviations on six different linear sections of ballasted track were fitted. The temporal feature of vertical irregularity standard deviation was analyzed. The variations of distribution function parameters with time were fitted by non-linear functions. The spatial feature of vertical irregularity standard deviation was analyzed. The differences of track quality statuses in spatial dimension were compared. Analysis result shows that in the large value region of vertical irregularity standard deviations, the relative error between the theoretical value obtained from the three-parameter Lognormal distribution and the actual value is less than 5%, while the relative error between the theoretical value obtained from the normal distribution and the actual value is more than 50%. Therefore, the three-parameter probability distribution function can effectively solve the deviated problem between the theoretical value of two-parameter probability distribution function and the actual value in this region. When describing the statistical distribution features of linear sections, different distribution functions should be selected on different linear sections, and the same distribution function should be selected on the same linear section. On the bridge and tunnel sections of existing Shanghai-Kunming Line, the Burr distribution obtains the optimum probability distribution for five times, and the mean and standard deviation of difference of P values are 0.09 and 0.12, respectively. When using the non-linear function to fit the parameters of the distribution obeyed by the vertical irregularity standard deviation on each section, the fitting goodnesses of three parameters are all greater than 0.6. Therefore, the non-linear function can be used to fit the variations of three parameters with time. Both the over-range percentages of vertical irregularity standard deviations on bridge and tunnel sections before and after the repair and maintenance operations are less than 3%. The over-range percentages of vertical irregularity standard deviations on circular, transition and straight line sections are 3.5%-12.8%, while the values on the speed-limit and switch sections are greater than 25%. Therefore, the determined selection principle of the optimum probability distribution function can be used to study the probability distribution feature of track irregularity.
-

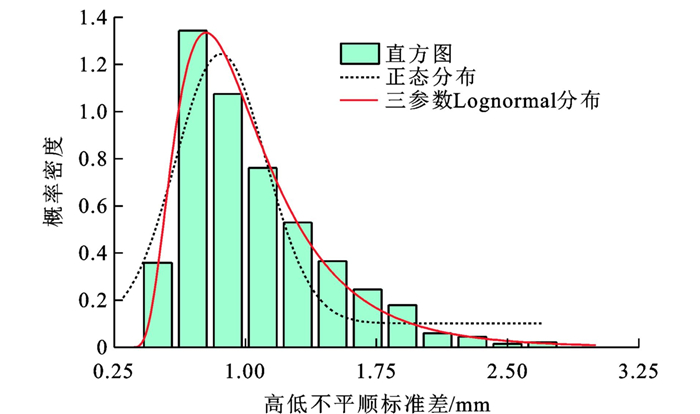
图 1 两种分布函数拟合的直线段高低不平顺标准差
Figure 1. Vertical irregularity standard deviations on straight line section fitted by two distribution functions

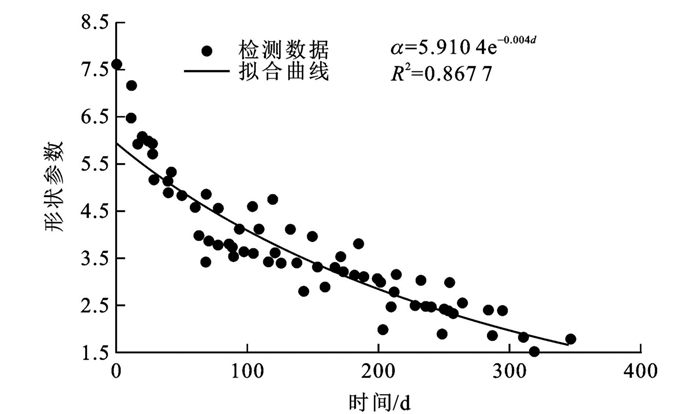
图 3 圆曲线区段三参数Loglogistic分布中形状参数随时间变化
Figure 3. Variation of shape parameter with time in three- parameter Loglogistic distribution on circular section

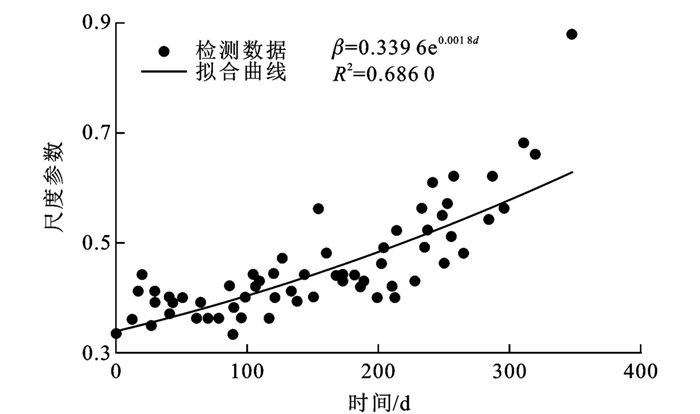
图 4 圆曲线区段三参数Loglogistic分布中尺度参数随时间变化
Figure 4. Variation of scale parameter with time in three- parameter Loglogistic distribution on circular section

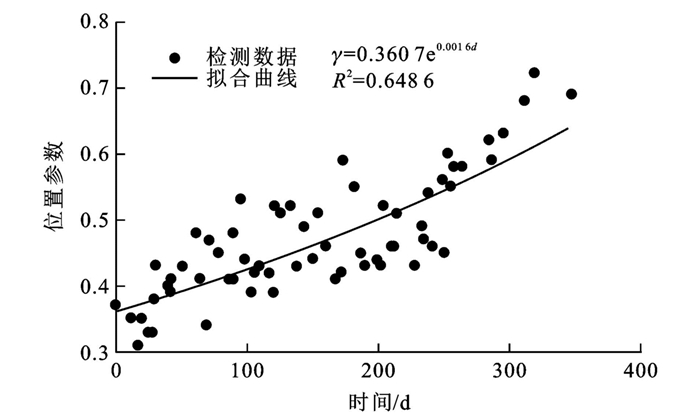
图 5 圆曲线区段三参数Loglogistic分布中位置参数随时间变化
Figure 5. Variation of location parameter with time in three- parameter Loglogistic distribution on circular section

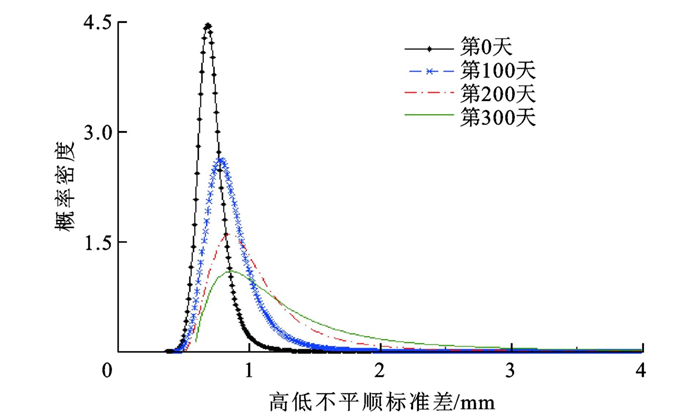
图 6 圆曲线区段上三参数Loglogistic分布在各时间点的概率密度曲线
Figure 6. Probability density curves of three-parameter Loglogistic distribution on circular section at each time point

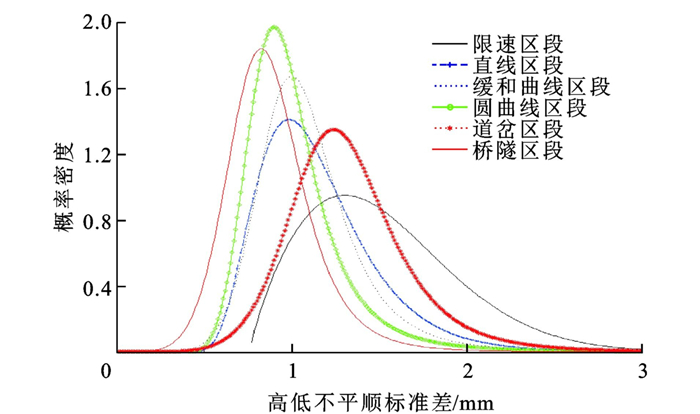
图 7 4月8日沪昆上行线6种区段概率密度曲线
Figure 7. Probability density curves of 6 sections of Shanghai-Kunming Upline on April 8th

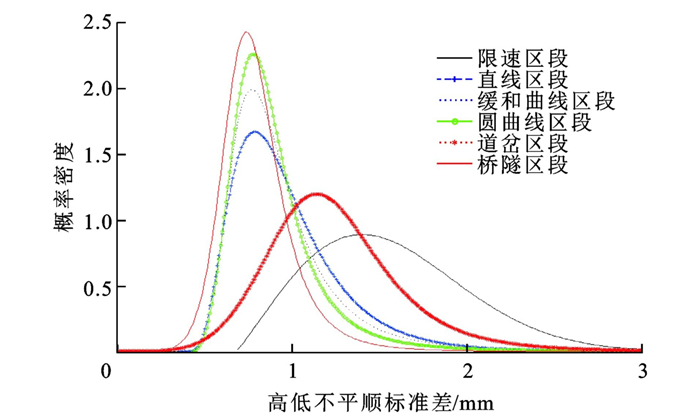
图 8 7月23日沪昆上行线6种区段概率密度曲线
Figure 8. Probability density curves of 6 sections of Shanghai-Kunming Upline on July 23th
表 1 五种理论分布函数的概率密度函数、累积分布函数和期望
Table 1. Probability density functions, cumulative distribution functions and expectations of five theoretical distribution functions

 下载: 导出CSV
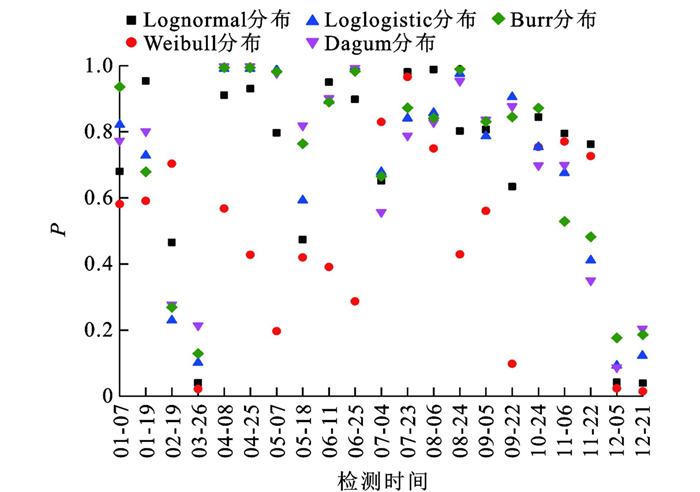
表 2 2013年5~11月某区段样本数据P值
Table 2. P values of sample data on one section from May to November 2013
日期 Lognormal分布 Weibull分布 Loglogistic分布 Dagum分布 Burr分布 05-15 0.005 0.000 1 0.240 0.060 0.118 06-12 0.043 0.000 1 0.583 0.227 0.475 07-25 0.024 0.001 0 0.525 0.172 0.442 08-18 0.003 0.001 0 0.288 0.057 0.131 09-13 0.027 0.007 0 0.435 0.339 0.464 11-13 0.027 0.001 0 0.421 0.176 0.349
下载: 导出CSV
表 3 某区段各理论分布函数P值之差的均值和标准差
Table 3. Means and standard deviations of difference of P value between theoretic distribution functions on one section
统计项 Lognormal分布 Weibull分布 Loglogistic分布 Dagum分布 Burr分布 成为拟合优度最佳分布的次数 0 0 5 0 1 P值之差的均值 0.399 0.418 0.005 0.248 0.090 P值之差的标准差 0.109 0.122 0.011 0.084 0.049
下载: 导出CSV
表 4 不同线形区段上高低不平顺数据所服从的最优概率分布函数
Table 4. Optimum probability distribution functions of vertical irregularity data on different linear sections
区段 最优概率分布函数 限速 Weibull分布 直线 Lognormal分布 缓和曲线 Dagum分布 圆曲线 Loglogistic分布 道岔 Burr分布 桥隧 Burr分布
下载: 导出CSV
表 5 既有沪昆线各区段上3个参数随时间变化的拟合函数
Table 5. Fitting functions of three parameters changing with time on each section of existing Shanghai-Kunming Line
 下载: 导出CSV
表 6 不同线形区段轨道质量统计
Table 6. Statistics of track qualities of different sections
% 区段 4月8日 7月23日 超限百分比 一个标准差范围内的百分比 超限百分比 一个标准差范围内的百分比 限速 46.2 68.0 51.1 67.3 直线 12.8 73.5 6.7 75.9 缓和曲线 8.8 76.1 5.4 83.9 圆曲线 5.3 79.2 3.5 85.3 道岔 25.9 74.3 27.3 74.2 桥隧 2.2 73.3 1.1 76.1
下载: 导出CSV
-
[1] 王建西, 李海锋, 许玉德. 基于概率分布推移变化的铁路轨道几何状态评价与预测方法[J]. 中国铁道科学, 2008, 29(5): 31-34. doi: 10.3321/j.issn:1001-4632.2008.05.006WANG Jian-xi, LI Hai-feng, XU Yu-de. Evaluation and prediction method for railway track geometric state based on probability distribution change[J]. China Railway Science, 2008, 29(5): 31-34. (in Chinese). doi: 10.3321/j.issn:1001-4632.2008.05.006 [2] 高建敏, 翟婉明, 徐涌, 等. 基于概率分布的轨道不平顺发展统计预测[J]. 铁道科学与工程学报, 2006, 3(6): 55-60. doi: 10.3969/j.issn.1672-7029.2006.06.011GAO Jian-min, ZHAI Wan-ming, XU Yong, et al. Development forecast model of track irregularity based on probability distribution[J]. Journal of Railway Science and Engineering, 2006, 3(6): 55-60. (in Chinese). doi: 10.3969/j.issn.1672-7029.2006.06.011 [3] 高建敏. 铁路有砟轨道下沉及高低不平顺发展预测研究[D]. 成都: 西南交通大学, 2008.GAO Jian-min. Study on settlement of railway ballasted track and growth forecast of track vertical profile irregularity[D]. Chengdu: Southwest Jiaotong University, 2008. (in Chinese). [4] ZHANG Yu-jiang, EL-SIBAIE M, LEE S, FRA track quality indices and distribution characteristics[C]//AREMA. 2004 AREMA Annual Conference. Nashville: AREMA, 2004: 1-26. [5] EL-SIBAIE M, ZHANG Yu-jiang. Objective track quality indices[J]. Transportation Research Record, 2004(1863): 81-87. [6] OYAMA T, MIWA M. Mathematical modeling analyses for obtaining an optimal railway track maintenance schedule[J]. Japan Journal of Industrial and Applied Mathematics, 2006, 23(2): 207-224. doi: 10.1007/BF03167551 [7] JOVANOVIC S. Railway track quality assessment and related decision making[C]//IEEE. 2004 IEEE International Conference on Systems, Man and Cybernetics. New York: IEEE, 2004: 5038-5043. [8] SADEGHI J, ASKARINEJAD H. Development of improved railway track degradation models[J]. Structure and Infrastructure Engineering, 2010, 6(6): 675-688. doi: 10.1080/15732470801902436 [9] SADEGHI J, ASKARINEJAD H. An investigation into the effects of track structural conditions on railway track geometry deviations[J]. Proceedings of the Institution of Mechanical Engineers Part F: Journal of Rail and Rapid Transit, 2009, 223(4): 415-425. doi: 10.1243/09544097JRRT266 [10] SADEGHI J. Development of railway track geometry indexes based on statistical distribution of geometry data[J]. Journal of Transportation Engineering, 2010, 136(8): 693-700. doi: 10.1061/(ASCE)0733-947X(2010)136:8(693) [11] SADEGHI J, AKBARI B. Field investigation on effects of railway track geometric parameters on rail wear[J]. Journal of Zhejiang University—Science A: Applied Physics and Engineering, 2006, 7(11): 1846-1855. [12] GULER H, JOVANOVIC S, EVREN G. Modelling railway track geometry deterioration[J]. Proceedings of the Institution of Civil Engineers—Transport, 2011, 164(2): 65-75. doi: 10.1680/tran.2011.164.2.65 [13] 许玉德, 李海峰, 周宇. 铁路轨道高低不平顺的预测方法[J]. 同济大学学报(自然科学版), 2003, 31(3): 291-295. doi: 10.3321/j.issn:0253-374X.2003.03.009XU Yu-de, LI Hai-feng, ZHOU Yu. Forecast methods of track longitudinal level irregularity[J]. Journal of Tongji University (Natural Science), 2003, 31(3): 291-295. (in Chinese). doi: 10.3321/j.issn:0253-374X.2003.03.009 [14] 许玉德, 周宇. 既有线轨道质量指数的分布与不平顺权重系数统计分析[J]. 中国铁道科学, 2006, 27(4): 71-75. doi: 10.3321/j.issn:1001-4632.2006.04.014XU Yu-de, ZHOU Yu. Statistics analysis of distribution of track quality index and weight coefficient of track irregularity[J]. China Railway Science, 2006, 27(4): 71-75. (in Chinese). doi: 10.3321/j.issn:1001-4632.2006.04.014 [15] 周宇, 许玉德, 李浩然. 轨道不平顺非线性预测模型[J]. 交通运输工程学报, 2004, 4(4): 21-24. doi: 10.3321/j.issn:1671-1637.2004.04.006ZHOU Yu, XU Yu-de, LI Hao-ran. Nonlinear track irregularity forecast model[J]. Journal of Traffic and Transportation Engineering, 2004, 4(4): 21-24. (in Chinese). doi: 10.3321/j.issn:1671-1637.2004.04.006 [16] 木东升, 周宇, 韩延彬, 等. 轨道综合作业对高速铁路有砟轨道几何不平顺改善效果[J]. 交通运输工程学报, 2018, 18(5): 90-99. doi: 10.3969/j.issn.1671-1637.2018.05.009MU Dong-sheng, ZHOU Yu, HAN Yan-bin, et al. Effect of track comprehensive maintenance on geometry irregularity improvement of ballast track in high-speed railway[J]. Journal of Traffic and Transportation Engineering, 2018, 18(5): 90-99. (in Chinese). doi: 10.3969/j.issn.1671-1637.2018.05.009 [17] PATRA A P, SODERHOLM P, KUMAR U. Uncertainty estimation in railway track life-cycle cost: a case study from Swedish National Rail Administration[J]. Proceedings of the Institution of Mechanical Engineers, Part F: Journal of Rail and Rapid Transit, 2009, 223(3): 285-293. doi: 10.1243/09544097JRRT235 [18] ANDRADE A R, TEIXEIRA P F. A Bayesian model to assess rail track geometry degradation through its life-cycle[J]. Research in Transportation Economics, 2012, 36(1): 1-8. doi: 10.1016/j.retrec.2012.03.011 [19] MEIER-HIRMER C, RIBOULET G, SOURGET F, et al. Maintenance optimization for a system with a gamma deterioration process and intervention delay: application to tract maintenance[J]. Proceedings of the Institution of Mechanical Engineers, Part O: Journal of Risk and Reliability, 2009, 223(3): 189-198. doi: 10.1243/1748006XJRR234 [20] MERCIER S C, MEIER-HIRMER C, ROUSSIGNOL M. Bivariate Gamma wear processes for track geometry modelling, with application to intervention scheduling[J]. Structure and Infrastructure Engineering, 2012, 8(4): 357-366. doi: 10.1080/15732479.2011.563090 [21] QUIROGA L M, SCHNIEDER E. Modelling of high speed railroad geometry ageing as a discrete-continuous process[C]//SMTDA. Stochastic Modeling Techniques and Data Analysis International Conference. Chania: SMTDA, 2010: 655-666. [22] QUIROGA L M, SCHNIEDER E. Monte Carlo simulation of railway track geometry deterioration and restoration[J]. Proceedings of the Institution of Mechanical Engineers, Part O: Journal of Risk and Reliability, 2012, 226(3): 274-282. doi: 10.1177/1748006X11418422 [23] ANDRADE A R, TEIXEIRA P F. Uncertainty in rail-track geometry degradation: Lisbon-Oporto Line case study[J]. Journal of Transportation Engineering, 2011, 137(3): 193-200. doi: 10.1061/(ASCE)TE.1943-5436.0000206 [24] ANDRADE A R, TEIXEIRA P F. Hierarchical Bayesian modelling of rail track geometry degradation[J]. Proceedings of the Institution of Mechanical Engineers, Part F: Journal of Rail and Rapid Transit, 2013, 227(4): 364-375. doi: 10.1177/0954409713486619 [25] VALE C, LURDES S M. Stochastic model for the geometrical rail track degradation process in the Portuguese Railway Northern Line[J]. Reliability Engineering and System Safety, 2013, 116: 91-98. doi: 10.1016/j.ress.2013.02.010 [26] AUDLEY M, ANDREWS J D. The effects of tamping on railway track geometry degradation[J]. Proceedings of the Institution of Mechanical Engineers, Part F: Journal of Rail and Rapid Transit, 2013, 227(4): 376-391. doi: 10.1177/0954409713480439 [27] ANDREWS J. A modelling approach to railway track asset management[J]. Proceedings of the Institution of Mechanical Engineers, Part F: Journal of Rail and Rapid Transit, 2013, 227(1): 56-73. [28] PRESCOTT D, ANDREWS J. A track ballast maintenance and inspection model for a rail network[J]. Proceedings of the Institution of Mechanical Engineers, Part O: Journal of Risk and Reliability, 2013, 227(3): 251-266. [29] ANDREWS J, PRESCOTT D, DE ROZIÈRES F. A stochastic model for railway track asset management[J]. Reliability Engineering and System Safety, 2014, 130: 76-84. [30] PRESCOTT D, ANDREWS J. Investigating railway track asset management using a Markov analysis[J]. Proceedings of the Institution of Mechanical Engineers, Part F: Journal of Rail and Rapid Transit, 2015, 229(4): 402-416. [31] LESTOILLE N. Stochastic model of high-speed train dynamics for the prediction of long-time evolution of the track irregularities[D]. Paris: Université Paris-Est. 2015. [32] 徐磊, 翟婉明. 轨道不平顺概率模型[J]. 交通运输工程学报, 2018, 18(3): 56-63. http://transport.chd.edu.cn/article/id/201803006XU Lei, ZHAI Wan-ming. Track irregularity probabilistic model[J]. Journal of Traffic and Transportation Engineering, 2018, 18(3): 56-63. (in Chinese). http://transport.chd.edu.cn/article/id/201803006 -

 点击查看大图
计量
- 文章访问数: 777
- HTML全文浏览量: 145
- PDF下载量: 432
- 被引次数: 0
