

-
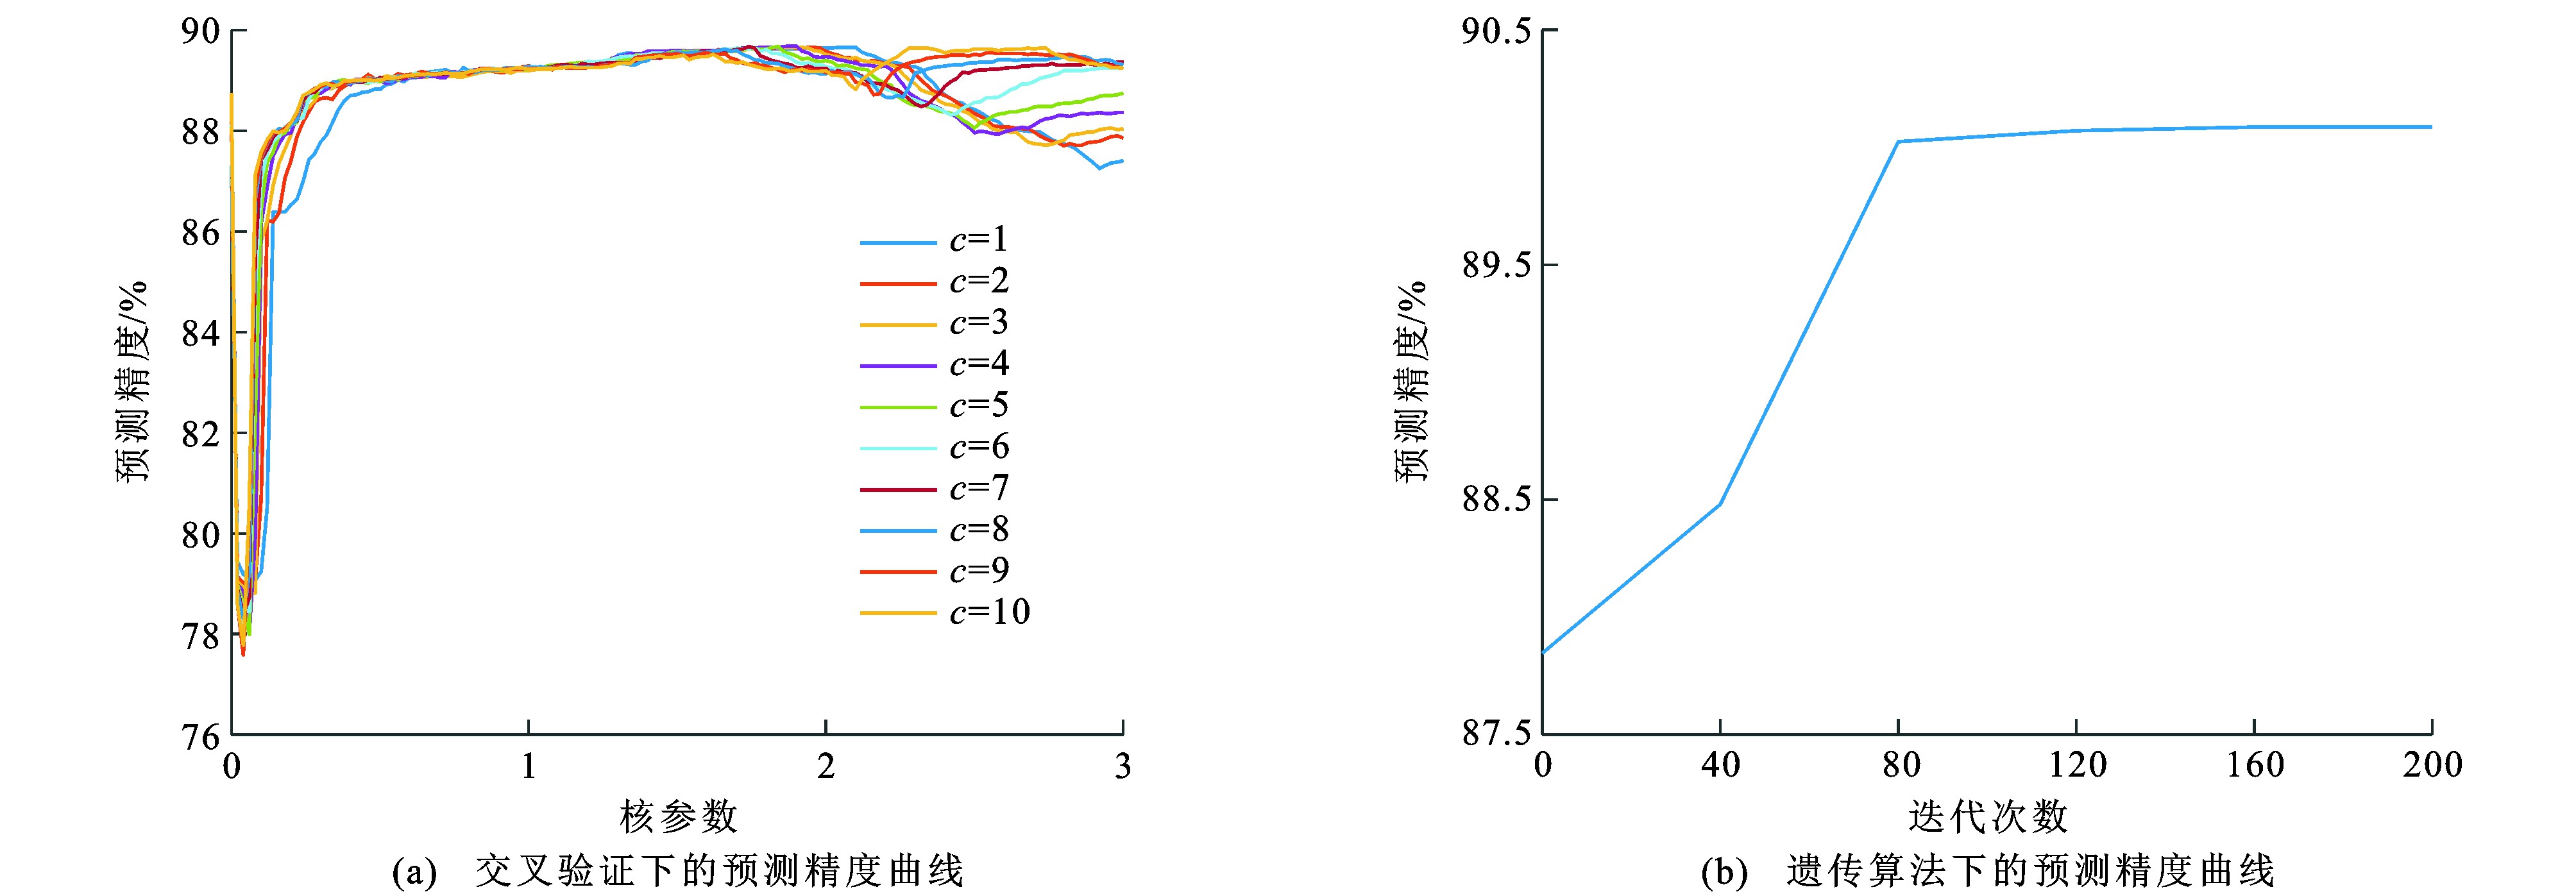
摘要: 应用手机传感器与调查问卷, 同步采集了校园内高校学生2周的真实出行轨迹; 考虑了真实出行环境下的手机传感器数据特征, 结合高斯滤波预处理数据, 根据轨迹点的时空聚类特性, 用时空聚类算法识别了出行端点和出行时间, 结合轨迹点速度、加速度特征, 利用支持向量机识别了出行方式; 将手机传感器数据与调查问卷、查核线数据对比, 分析了手机传感器数据出行特征识别的准确程度, 验证了出行特征的提取效果。分析结果表明: 手机传感器与问卷调查识别出行链的成功匹配比例为81.66%, 说明手机传感器数据可有效记录出行轨迹; 时空聚类算法参数中核心点空间半径为26.92 m, 最小样本点为129, 时间约束为129 s时, 出行端点识别准确率为93.02%, 出行时间识别准确率为90.84%, 说明手机传感器识别出行端点和出行时间的效果较好; 当支持向量机设置类型为经典支持向量机, 核函数为径向基函数, 惩罚系数为0.797, 核参数为2.260时, 出行方式识别准确率为89.86%, 即利用手机传感器能够有效识别出行方式。可见, 手机传感器数据识别结果合理, 能为手机传感器数据应用于实际出行调查做支撑。Abstract: The mobile phone sensor and questionnaire were used to collect the real travel trajectories of college students on campus for 2 weeks. The characteristics of mobile phone sensor data in real travel environment were considered, and the Gaussian filter was applied to pre-process the data. According to the spatio-temporal clustering characteristics of trajectory points, the travel endpoints and travel times were identified by spatio-temporal clustering algorithm. Based on the characteristics of velocity and acceleration of trajectory points, the travel modes were identified by using support vector machine. Comparing the data of mobile phone sensor with the data of questionnaire and screen line, the accuracies of travel feature recognition of mobile phone sensor data were analyzed, and the extraction effect of travel feature was verified. Analysis result shows that the matching degree of travel chain between the mobile phone sensor and questionnaire is 81.66%, which indicates that mobile phone sensor data can effectively record the travel trajectory. When the spatial radius of the core point is 26.92 m, the minimum sample points are 129, and the time constraint is 129 s in the parameters of the spatio-temporal clustering algorithm, the travel endpoint and travel time identification accuracy are 93.02% and 90.84%, respectively, which indicates that the mobile phone sensor can identify the travel endpoint and travel time effectively. The accuracy of travel mode identification is 89.86% when the support vector machine type is classical, the kernel function is radial basis function, the penalty coefficient is 0.797, and the kernel parameter is 2.260, which indicates that mobile phone sensor can effectively identify the travel modes. Therefore, the recognition result of mobile phone sensor data is reasonable, which can support the application of mobile phone sensor data in actual travel survey.
-

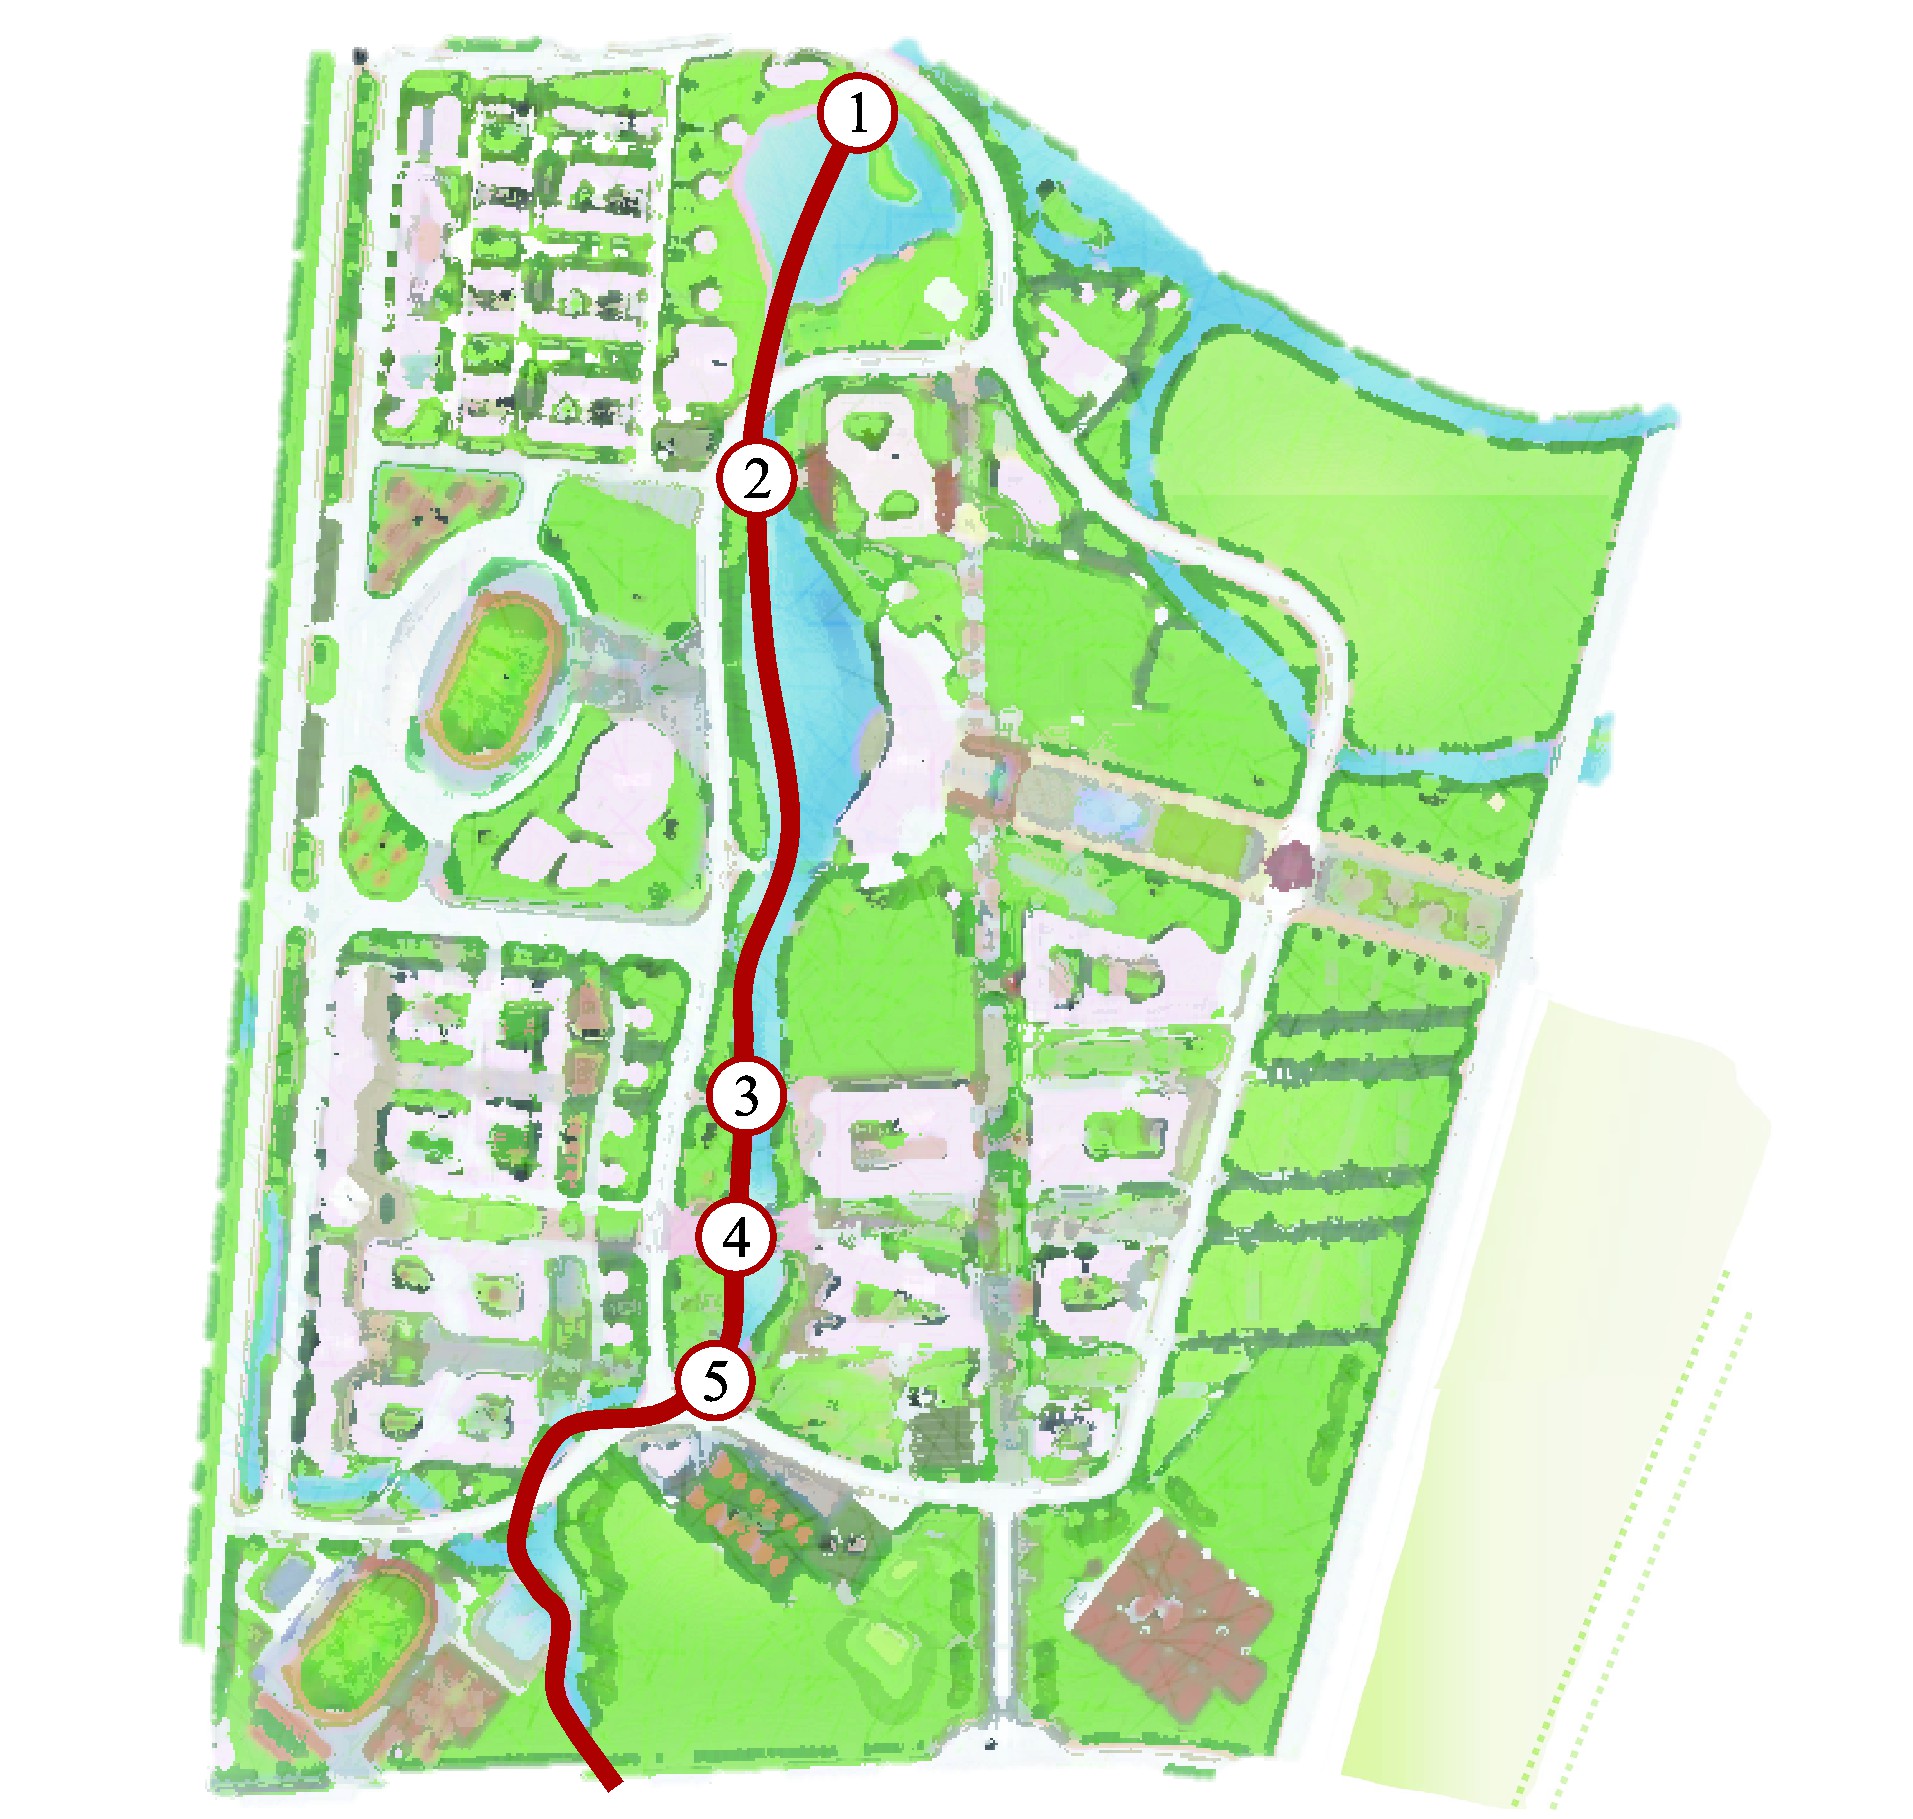
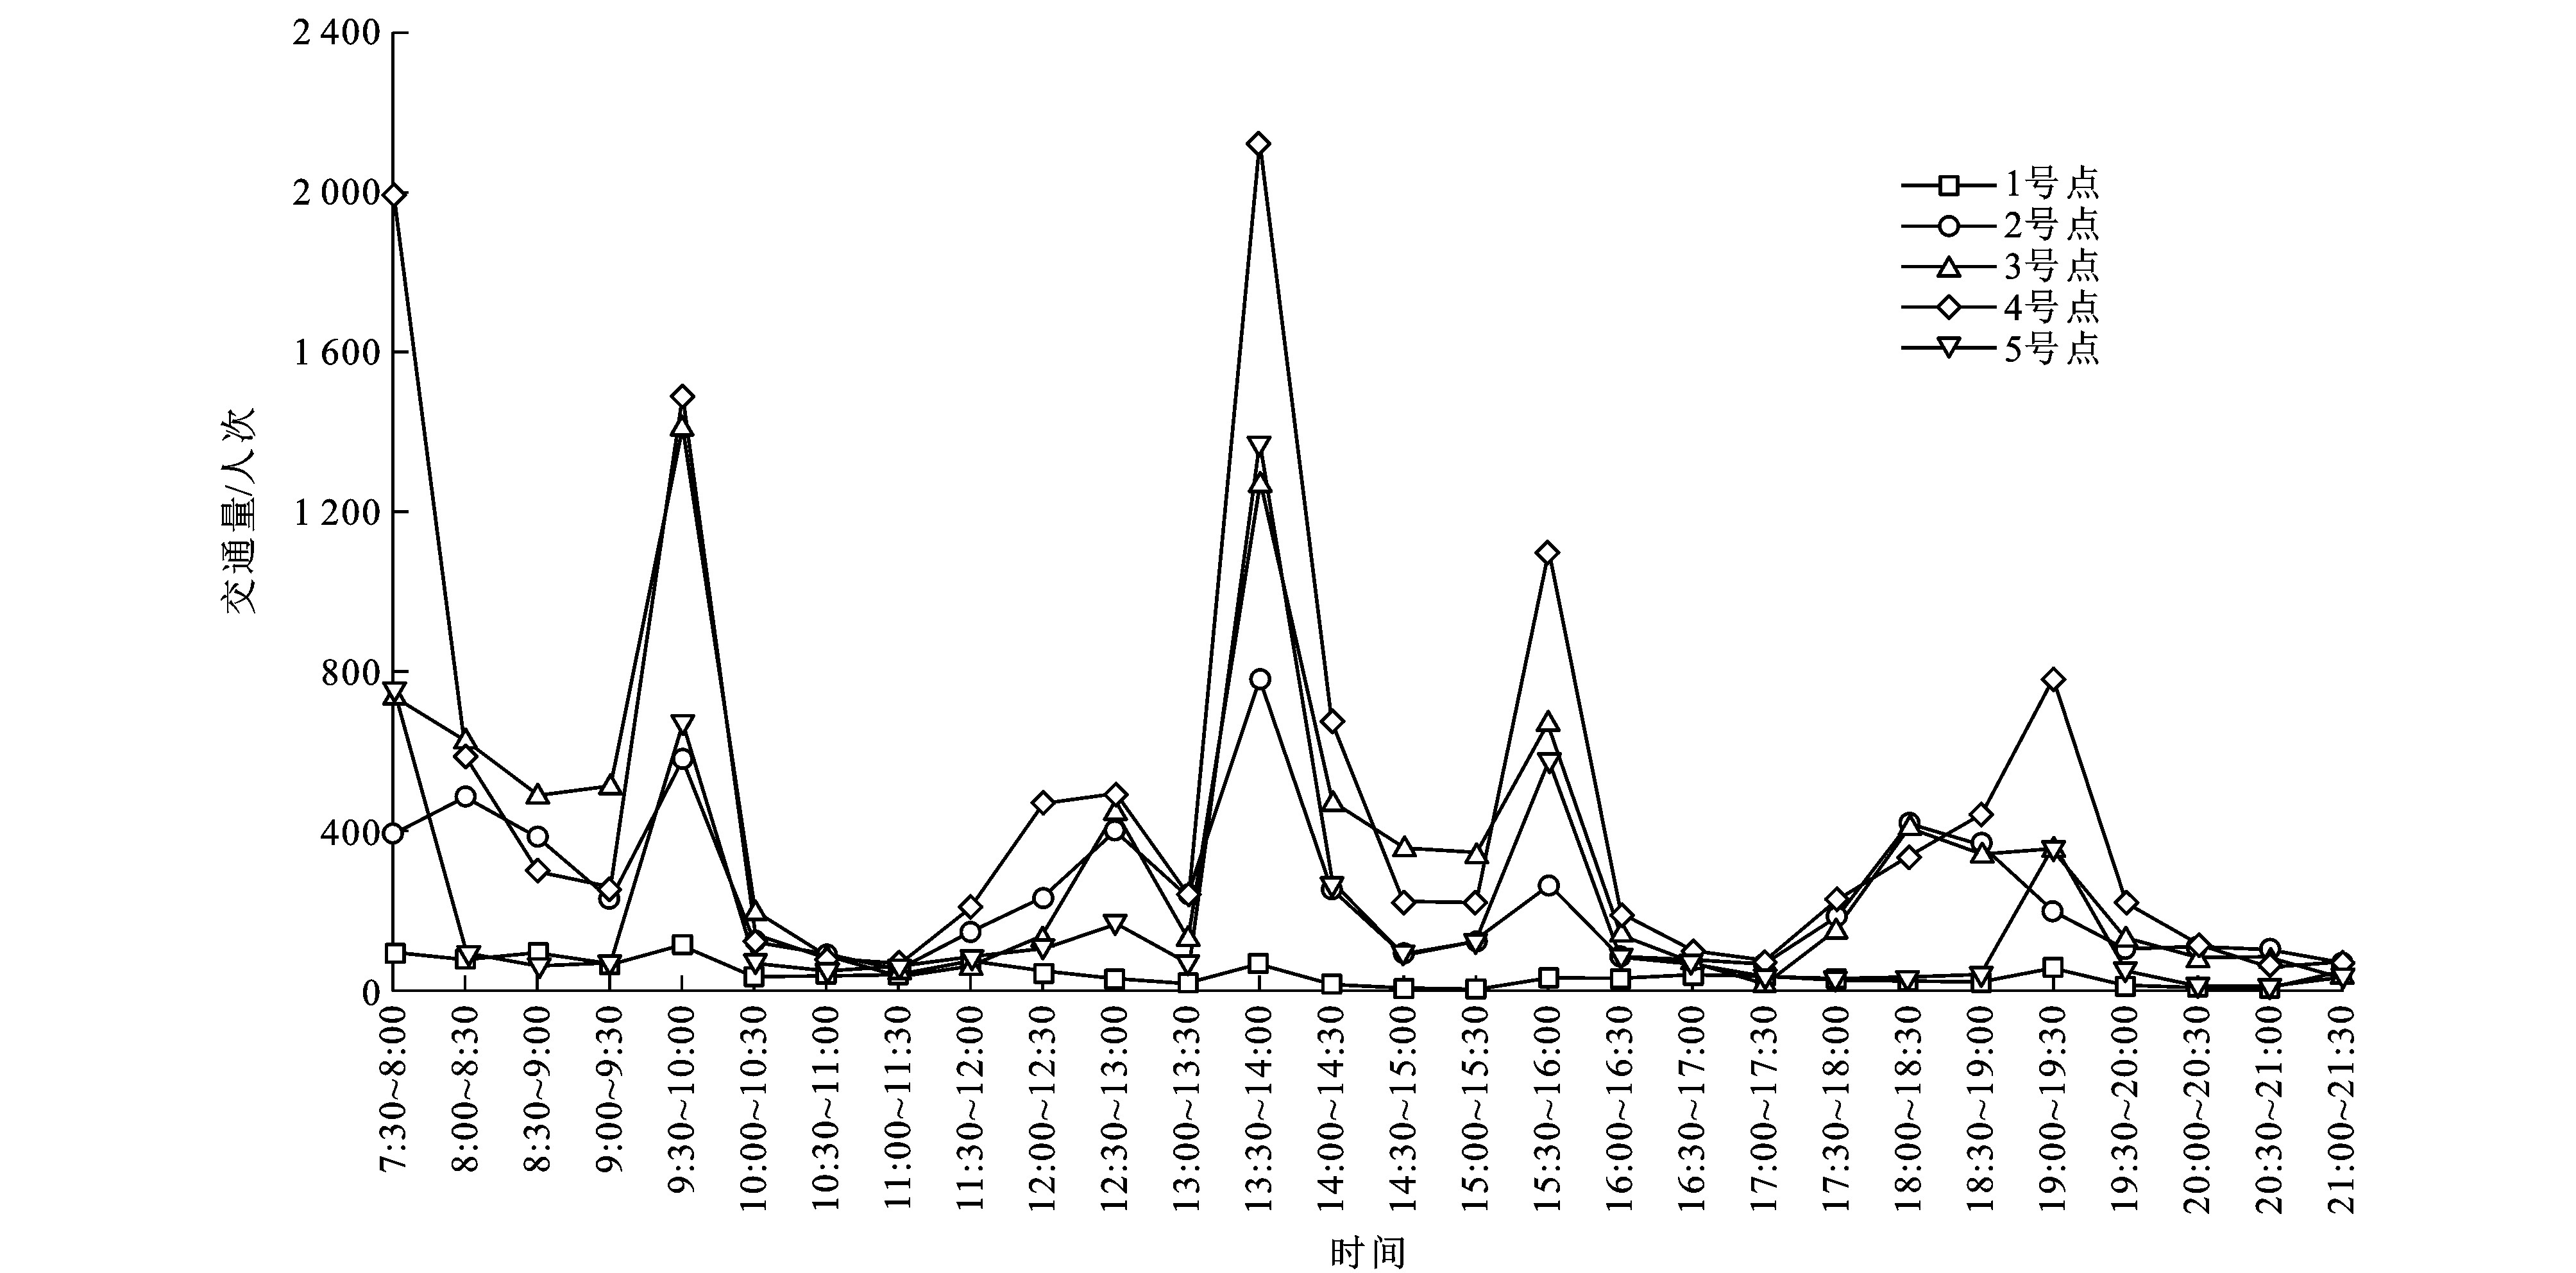
图 4 查核点1~5由西向东交通量分布
Figure 4. Traffic volume distributions of check points 1-5 from west to east

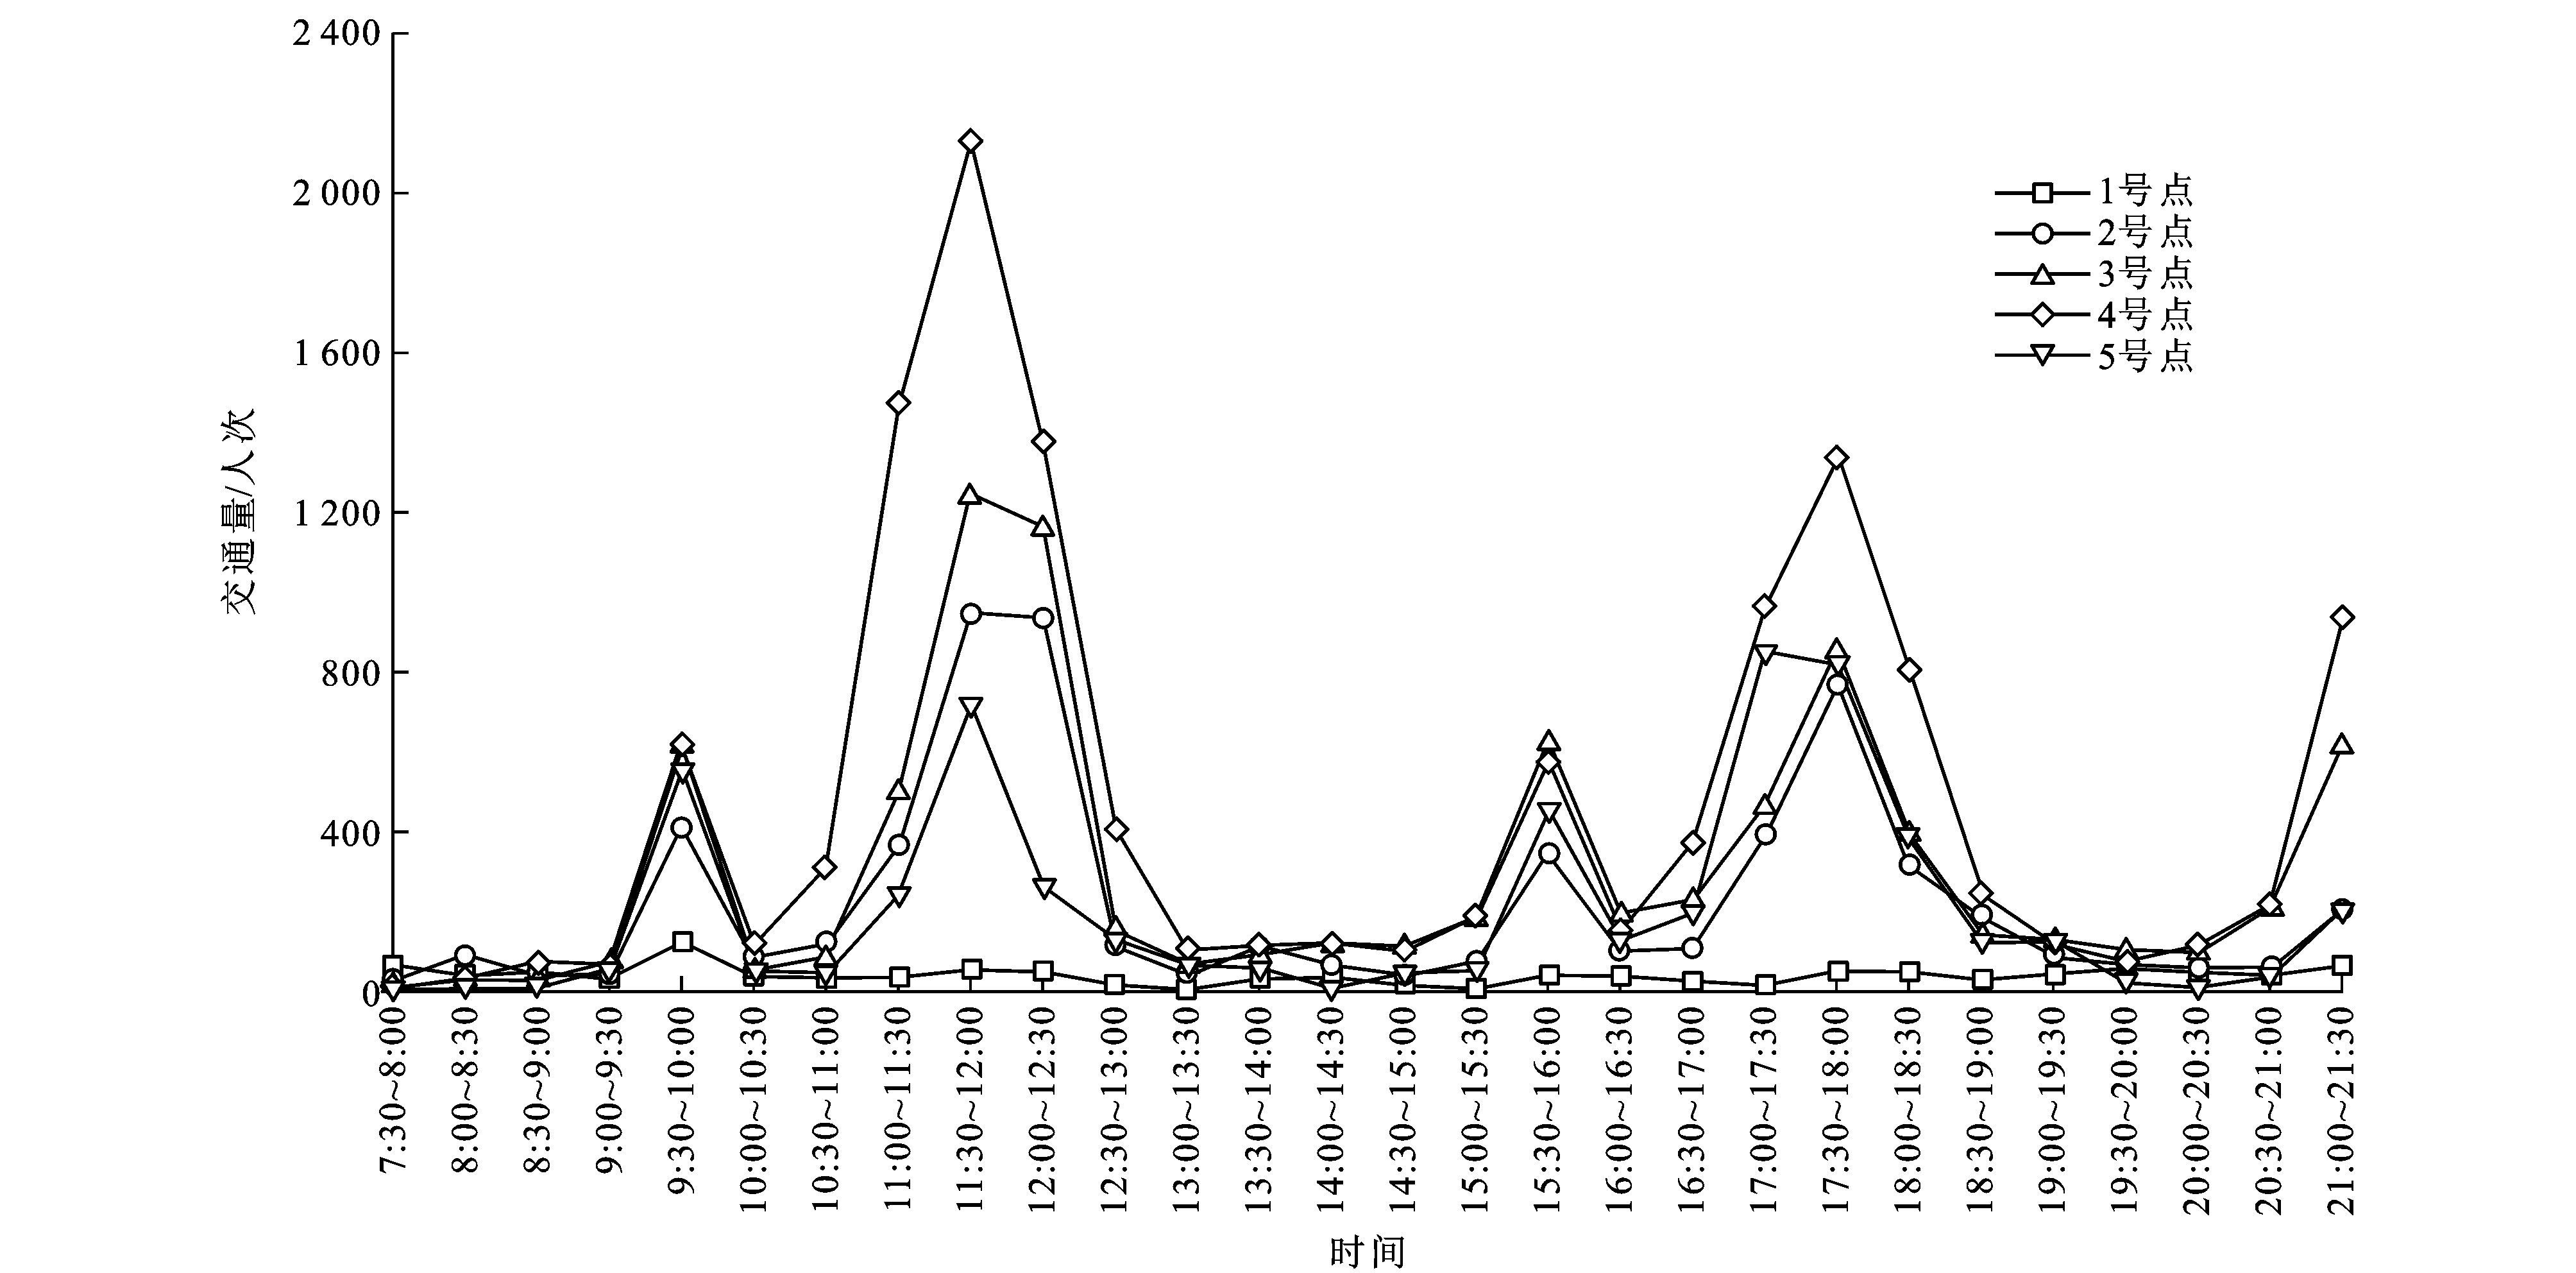
图 5 查核点1~5由东向西交通量分布
Figure 5. Traffic volume distributions of check points 1-5 from east to west

图 12 交叉验证与遗传算法下的预测精度曲线
Figure 12. Prediction accuracy curves based on cross validation and genetic algorithm
表 1 原始数据
Table 1. Raw data
序号 时间 经度/°E 纬度/°N 海拔/m 速度/(km·h-1) 卫星数 横向加速度/(m·s-2) 纵向加速度/(m·s-2) 垂向加速度/(m·s-2) 1 13:32:51 30.771 735 103.987 021 494.131 6.589 7 1.618 -9.553 -7.140 2 13:32:52 30.771 730 103.987 016 498.212 4.428 14 -0.915 -10.918 -0.561 3 13:32:53 30.771 755 103.987 051 492.490 4.614 14 2.600 -10.358 0.373 4 13:32:54 30.771 762 103.987 061 492.046 4.078 14 0.982 -10.109 -2.064 5 13:32:55 30.771 766 103.987 063 490.723 1.412 14 2.581 -6.345 -1.088 6 13:32:56 30.771 775 103.987 075 488.814 4.028 14 2.150 -5.775 -2.764 7 13:32:57 30.771 788 103.987 089 488.633 4.189 13 1.863 -4.688 -2.548 8 13:32:58 30.771 798 103.987 098 487.942 4.932 13 2.241 -10.712 -1.873 9 13:32:59 30.771 809 103.987 107 487.515 5.149 14 2.102 -4.076 -1.270 10 13:33:00 30.771 822 103.987 112 486.485 4.804 13 2.279 -6.862 -5.196 11 13:33:01 30.771 828 103.987 120 487.244 4.935 10 1.393 -3.525 -1.945 12 13:33:02 30.771 855 103.987 140 488.127 4.861 12 1.595 -3.903 -1.600 13 13:33:03 30.771 855 103.987 156 488.441 4.356 11 5.358 -8.165 -4.483 14 13:33:04 30.771 867 103.987 173 490.216 4.148 12 4.602 -9.635 -3.457 15 13:33:05 30.771 873 103.987 184 490.162 4.583 13 2.260 -7.212 -4.478 16 13:33:06 30.771 887 103.987 195 489.384 4.933 12 3.821 -10.061 -3.614 17 13:33:07 30.771 896 103.987 201 489.482 4.968 11 3.156 -6.929 -4.607 18 13:33:08 30.771 900 103.987 216 489.861 4.773 12 4.080 -10.674 -8.328 19 13:33:09 30.771 905 103.987 223 490.150 3.149 11 2.212 -7.365 -3.340 20 13:33:10 30.771 912 103.987 231 490.372 4.218 11 4.262 -11.397 -3.218  下载: 导出CSV
表 2 高峰时段交通量
Table 2. Traffic volumes of peak times
高峰时段 7:30~8:30 11:00~12:30 13:30~14:30 17:00~18:30 18:30~19:30 20:30~21:30 由西向东交通量/人次 5 824 1 839 7 274 2 085 2 966 535 由东向西交通量/人次 336 11 470 773 8 452 1 254 2 596
下载: 导出CSV
表 3 手机传感器出行识别结果
Table 3. Travel identification results of mobile phone sensor
出行区域 出行时间 到达区域 到达时间 135 08:00 223 08:06 223 11:29 135 11:38 135 12:03 132 12:08 132 12:56 135 13:05 116 13:14 110 13:17 110 13:35 135 13:45 135 15:47 223 15:53 223 17:27 135 17:34 135 17:51 131 17:55 131 18:07 135 18:10
下载: 导出CSV
表 4 问卷调查出行识别结果
Table 4. Travel identification results of questionnaire
出行区域 出行时间 到达区域 到达时间 135 07:55 223 08:02 223 11:30 135 11:37 135 12:00 132 12:07 132 12:55 135 13:03 135 15:42 223 15:51 223 17:25 135 17:32 135 17:50 131 17:57
下载: 导出CSV
表 5 手机传感器出行端点识别精度
Table 5. Identification accuracy of travel endpoints of mobile phone sensor
类别 传感器识别数量 识别比例/% 正确识别 1 706 93.02 错误识别 128 6.98
下载: 导出CSV
表 6 手机传感器出行时间识别精度
Table 6. Travel time identification accuracy of mobile phone sensor
类别 传感器识别数量 识别比例/% 5 min内 1 666 90.84 5 min以上 168 9.16
下载: 导出CSV
表 7 手机传感器出行方式识别精度
Table 7. Identification accuracy of travel modes by mobile phone sensor
类别 传感器识别数量 识别比例/% 准确识别 720 89.86 未准确识别 71 7.74 错误识别 22 2.40
下载: 导出CSV
表 8 问卷调查与手机传感器数据查核正确率
Table 8. Checking accuracy of questionnaire and mobile phone sensor data
方向 手机传感器数据/人次 问卷调查数据/人次 查核线数据/人次 传感器识别比例/% 问卷调查识别比例/% 由西向东 32 034 31 867 36 340 88.15 87.69 由东向西 28 385 26 409 34 845 81.46 75.79
下载: 导出CSV
-
[1] MURAKAMI E, WAGNER D P. Can using global positioning system (GPS) improve trip reporting?[J]. Transportation Research Part C: Emerging Technologies, 1999, 7(2/3): 149-165. [2] WOLF J. Using GPS data loggers to replace travel diaries in the collection of travel data[D]. Atlanta: Georgia Institute of Technology, 2000. [3] BOHTE W, MAAT K. Deriving and validating trip purposes and travel modes for multi-day GPS-based travel surveys: a large-scale application in the Netherlands[J]. Transportation Research Part C: Emerging Technologies, 2009, 17(3): 285-297. doi: 10.1016/j.trc.2008.11.004 [4] FENG Tao, TIMMERMANS H J P. Transportation mode recognition using GPS and accelerometer data[J]. Transportation Research Part C: Emerging Technologies, 2013, 37: 118-130. doi: 10.1016/j.trc.2013.09.014 [5] AULD J, WILLIAMS C, MOHAMMADIAN A, et al. An automated GPS-based prompted recall survey with learning algorithms[J]. Transportation Letters, 2008, 1(1): 59-79. [6] BIERLAIRE M, CHEN Jing-min, NEWMAN J. A probabilistic map matching method for smartphone GPS data[J]. Transportation Research Part C: Emerging Technologies, 2013, 26: 78-98. doi: 10.1016/j.trc.2012.08.001 [7] OLIVEIRA M G S, VOVSHA P, WOLF J, et al. Evaluation of two methods for identifying trip purpose in GPS-based household travel surveys[J]. Transportation Research Record, 2014, 2406: 33-41. [8] GEURS K T, THOMAS T, BIJLSMA M, et al. Automatic trip and mode detection with move smarter: first results from the dutch mobile mobility panel[J]. Transportation Research Procedia, 2015, 11: 247-262. doi: 10.1016/j.trpro.2015.12.022 [9] 冉斌. 手机数据在交通调查和交通规划中的应用[J]. 城市交通, 2013, 11(1): 72-81, 32. doi: 10.3969/j.issn.1672-5328.2013.01.011RAN Bin. Use of cellphone data in travel survey and transportation planning[J]. Urban Transport of China, 2013, 11(1): 72-81, 32. (in Chinese). doi: 10.3969/j.issn.1672-5328.2013.01.011 [10] FENG Yi-heng, HOURDOS J, DAVIS G A. Probe vehicle based real-time traffic monitoring on urban roadways[J]. Transportation Research Part C: Emerging Technologies, 2014, 40: 160-178. doi: 10.1016/j.trc.2014.01.010 [11] 吴子啸, 任西锋, 胡静宇. 基于公交GPS和IC卡数据的综合交通建模新思路[J]. 城市交通, 2011, 9(1): 47-51. doi: 10.3969/j.issn.1672-5328.2011.01.010WU Zi-xiao, REN Xi-feng, HU Jing-yu. Comprehensive transportation modeling with information from GPS and IC card on public transit vehicles[J]. Urban Transport of China, 2011, 9(1): 47-51. (in Chinese). doi: 10.3969/j.issn.1672-5328.2011.01.010 [12] 付鑫, 孙茂棚, 孙皓. 基于GPS数据的出租车通勤识别及时空特征分析[J]. 中国公路学报, 2017, 30(7): 134-143. doi: 10.3969/j.issn.1001-7372.2017.07.017FU Xin, SUN Mao-peng, SUN Hao. Taxi commute recognition and temporal-spatial characteristics analysis based on GPS data[J]. China Journal of Highway and Transport, 2017, 30(7): 134-143. (in Chinese). doi: 10.3969/j.issn.1001-7372.2017.07.017 [13] 杨飞, 姚振兴. 基于手机传感器数据的出行特征提取方法[J]. 城市交通, 2016, 14(1): 9-14. https://www.cnki.com.cn/Article/CJFDTOTAL-CSJT201601003.htmYANG Fei, YAO Zhen-xing. Travel characteristics extracting method by smartphone sensor data[J]. Urban Transport of China, 2016, 14(1): 9-14. (in Chinese). https://www.cnki.com.cn/Article/CJFDTOTAL-CSJT201601003.htm [14] 戴露. 基于手机GPS数据的出行端点识别方法研究[D]. 成都: 西南交通大学, 2017.DAI Lu. Research on extraction method of trip end based on cellphone GPS data[D]. Chengdu: Southwest Jiaotong University, 2017. (in Chinese). [15] 韩旭. 基于手机加速度传感器数据的交通出行方式识别方法研究[D]. 成都: 西南交通大学, 2016.HAN Xu. Research of travel mode recognition method based on cellphone accelerometer data[D]. Chengdu: Southwest Jiaotong University, 2016. (in Chinese). [16] 赵瑜. 不同交通状态下基于手机GPS轨迹的出行信息采集效果评估研究[D]. 成都: 西南交通大学, 2016.ZHAO Yu. Research on evaluation of acquisition effect of travel information based on cellphone GPS trajectory under different traffic states[D]. Chengdu: Southwest Jiaotong University, 2016. (in Chinese). [17] BROACH J, DILL J, MCNEIL N W. Travel mode imputation using GPS and accelerometer data from a multi-day travel survey[J]. Journal of Transportation Geography, 2019, 78: 194-204. doi: 10.1016/j.jtrangeo.2019.06.001 [18] 曾大堃. 手机GPS定位频率对交通出行信息提取精度的影响研究[D]. 成都: 西南交通大学, 2016.ZENG Da-kun. Research on impact of the logging frequency of cellphone GPS on the extration accuracy of travel information[D]. Chengdu: Southwest Jiaotong University, 2016. (in Chinese). [19] YANG Fei, YAO Zhen-xing, JIN J P. GPS and acceleration data in multimode trip data recognition based on wavelet transform modulus maximum algorithm[J]. Transportation Research Record, 2015, 2526: 90-98. doi: 10.3141/2526-10 [20] GONG Lei, KANAMORI R, YAMAMOTO T. Data selection in machine learning for identifying trip purposes and travel modes from longitudinal GPS data collection lasting for seasons[J]. Travel Behaviour and Society, 2018, 11: 131-140. doi: 10.1016/j.tbs.2017.03.004 [21] ASSEMI B, SAFI H, MESBAH M, et al. Developing and validating a statistical model for travel mode identification on smartphones[J]. IEEE Transactions on Intelligent Transportation Systems, 2016, 17(7): 1920-1931. doi: 10.1109/TITS.2016.2516252 [22] REHRL K, BRUNAUER R, GRÖCHENIG S. Collecting floating car data with smartphones: results from a field trial in Austria[J]. Journal of Location Based Services, 2016, 10(1): 16-30. doi: 10.1080/17489725.2016.1169323 [23] MARRA A D, BECKER H, AXHAUSEN K W, et al. Developing a passive GPS tracking system to study long-term travel behavior[J]. Transportation Research Part C: Emerging Technologies, 2019, 104: 348-368. doi: 10.1016/j.trc.2019.05.006 [24] CISCAL-TERRY W, DELL'AMICO M, HADJIDIMITRIOU N S, et al. An analysis of drivers route choice behaviour using GPS data and optimal alternatives[J]. Journal of Transport Geography, 2016, 51: 119-129. doi: 10.1016/j.jtrangeo.2015.12.003 [25] PETRONEA, FRANZ M L. Probe vehicle based trajectory data visualization and applications[J]. International Journal of Transportation, 2018, 6(1): 59-74. doi: 10.14257/ijt.2018.6.1.05 [26] BORIO D, CANO E, BALDINI G. Speed consistency in the smart tachograph[J]. Sensors, 2018, 18(5): 1-21. doi: 10.1109/JSEN.2018.2792879 [27] CHEN C, GONG H, LAWSON C, et al. Evaluating the feasibility of a passive travel survey collection in a complex urban environment: lessons learned from the New York City case study[J]. Transportation Research Part A: Policy and Practice, 2010, 44(10): 830-840. doi: 10.1016/j.tra.2010.08.004 [28] 张国云. 支持向量机算法及其应用研究[D]. 长沙: 湖南大学, 2006.ZHANG Guo-yun. Research on support vector machine algorithm and its application[D]. Changsha: Hunan University, 2006. (in Chinese). [29] 李晔. 基于一种改进遗传算法的神经网络[D]. 太原: 太原理工大学, 2007.LI Ye. Neural network based on improved genetic algorithm[D]. Taiyuan: Taiyuan University of Technology, 2007. (in Chinese). [30] ERHARDT G D, RIZZO L. Evaluating the biases and sample size implications of multi-day GPS-enabled household travel surveys[J]. Transportation Research Procedia, 2018, 32: 279-290. doi: 10.1016/j.trpro.2018.10.051 [31] 卫宇. 考虑地球曲率情况下两点距离问题的求解[J]. 航空兵器, 2008(3): 7-12. doi: 10.3969/j.issn.1673-5048.2008.03.002WEI Yu. Solution of distance between two points considering curvature of the earth[J]. Aero Weapon, 2008(3): 7-12. (in Chinese). doi: 10.3969/j.issn.1673-5048.2008.03.002 -

 点击查看大图
计量
- 文章访问数: 632
- HTML全文浏览量: 56
- PDF下载量: 396
- 被引次数: 0
