

-
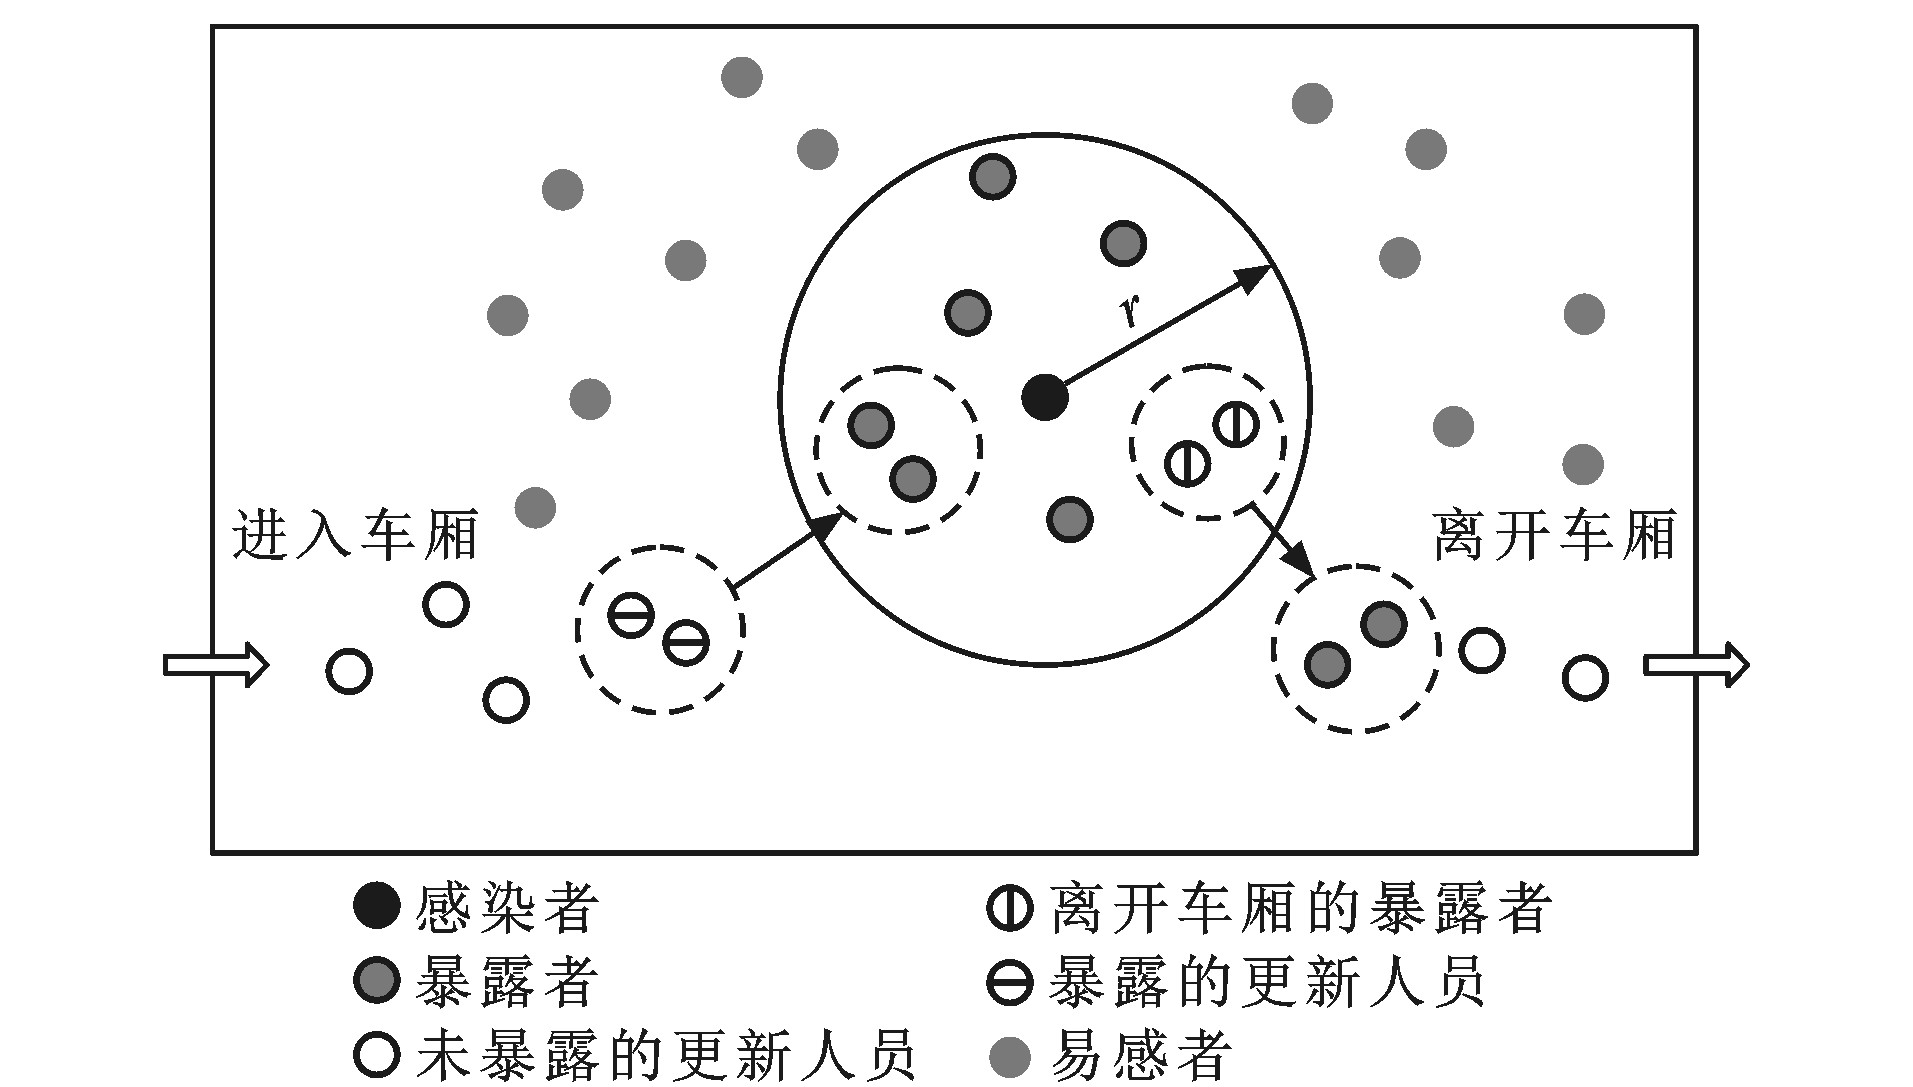
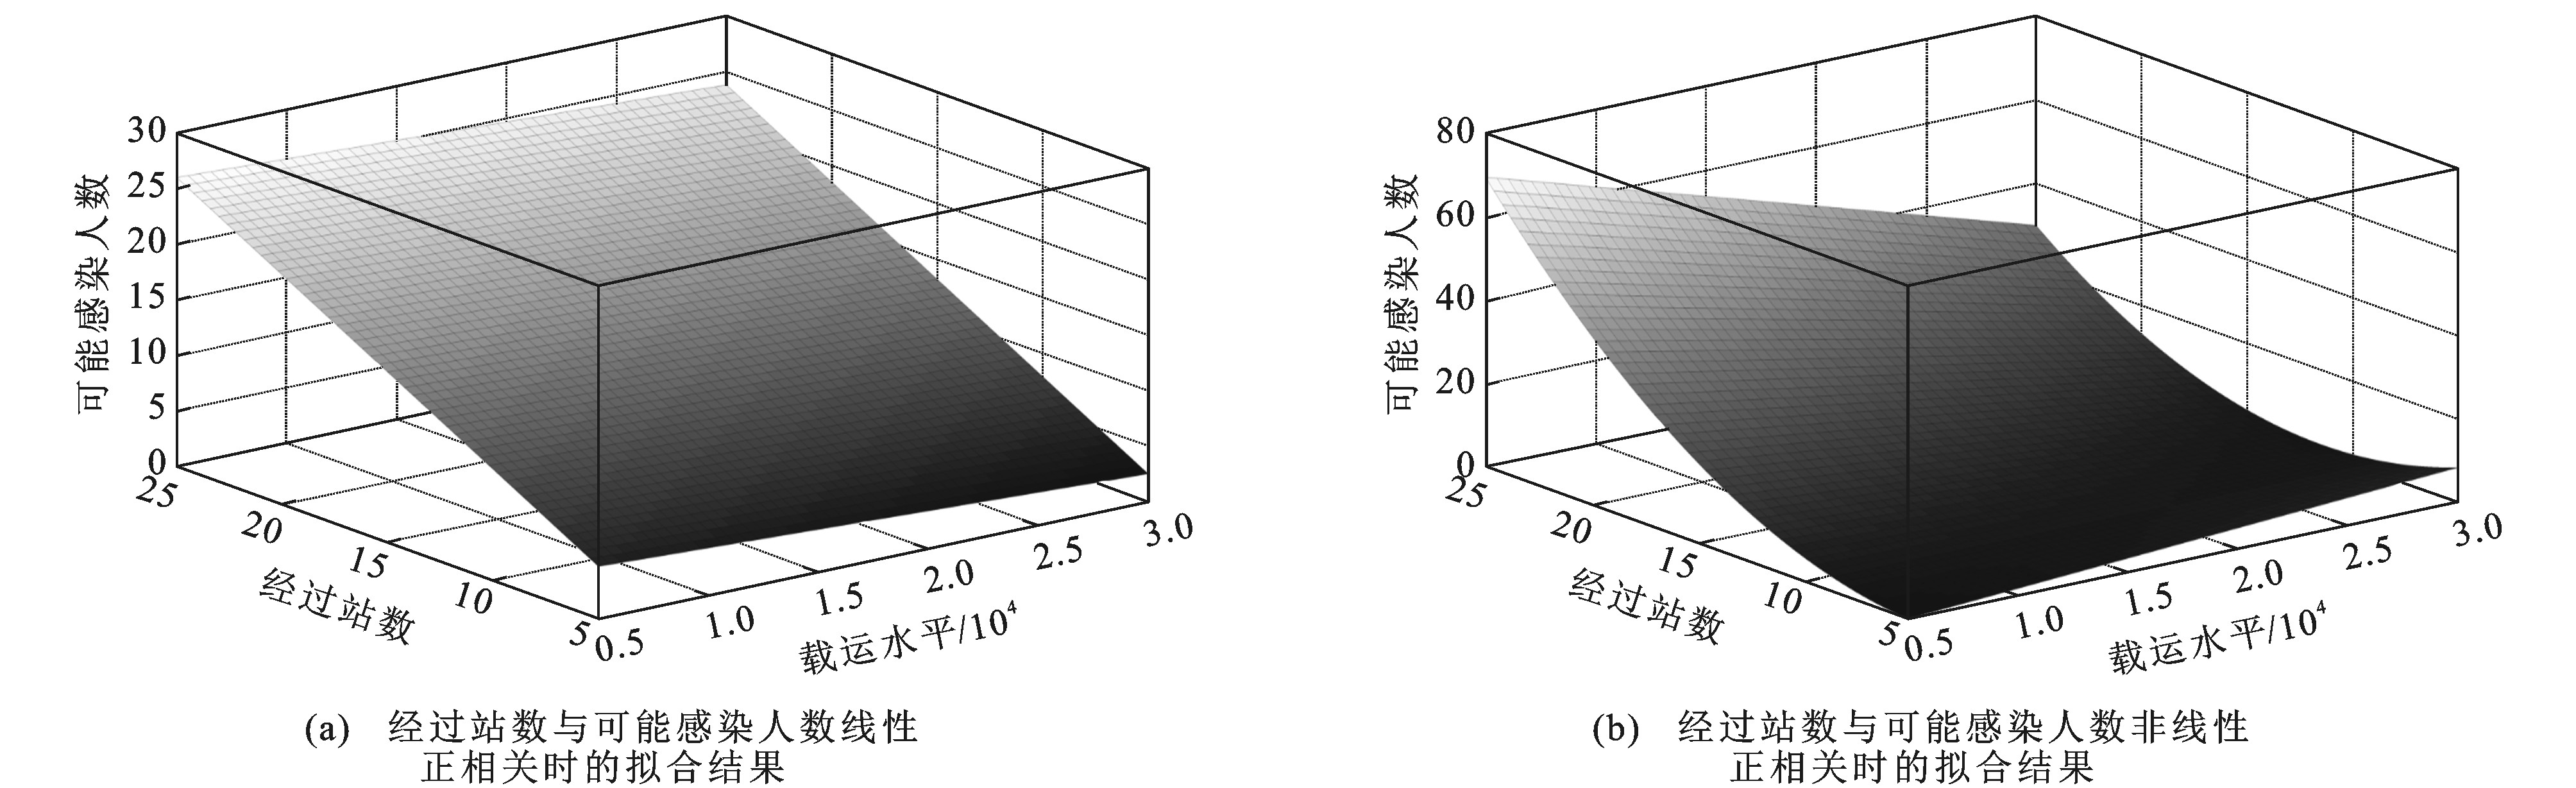
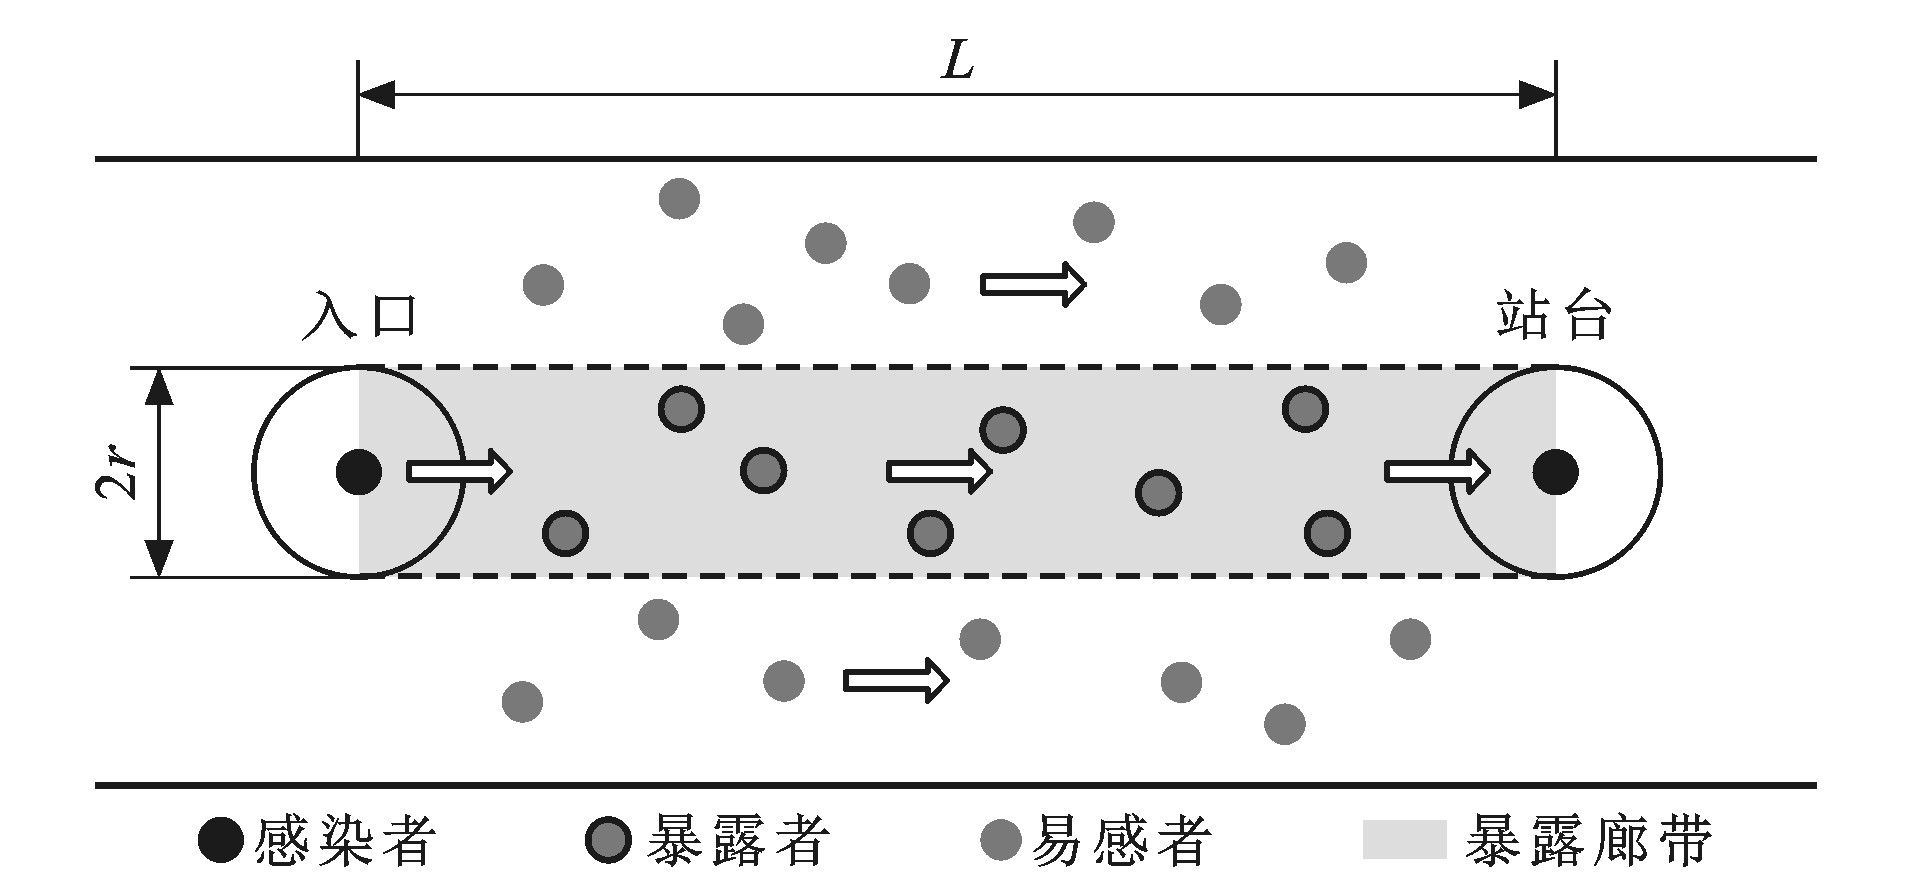
摘要: 考虑城市轨道交通出行特征, 将新冠疫情下城市轨道交通系统内的乘客分为易感者、感染者、暴露者; 假设病毒自由传播, 以疫情发生初期的病例为研究对象, 结合相关研究, 选择病毒传染概率为0.41;将感染者乘坐城市轨道交通的过程分为出入站阶段和乘车阶段, 考虑病毒有效传播范围、人群分布特征、人群流动特征, 建立新冠疫情在城市轨道交通系统内部的传播模型; 以某市地铁为模拟案例, 假如有13个感染者乘坐地铁, 结合历史客运数据确定模型参数的取值, 预测不同载运水平下可能造成的感染人数, 同时研究与可能感染人数相关的各类要素。研究结果表明: 当载运水平降低至平均水平的10%时, 多数案例的可能感染人数降低至1人以下, 证明了城市轨道交通客流管控强度的有效性, 起终点站内人数折减引起的感染人数变化(小于20%)低于车厢人数折减引起的变化(60%~80%), 说明相比起终点站内人数, 车厢内的人群密集程度对可能感染人数的影响更加显著; 在经停时, 假如上下车人数之比不大于1, 则能有效控制可能感染人数的升高; 当经停站数与可能感染人数非线性正相关时, 载运水平、经停站数、可能感染人数之间的函数关系具有较高的拟合优度(决定系数为0.700 1)。Abstract: Passenger group in urban rail transit system under the COVID-19 epidemic was divided into susceptible, infected and exposed ones considering urban rail transit travel characters. In the research environment of COVID-19 free spread and the case sampling time of early spread, the infection probability of 0.41 was selected based on related studies. The urban rail transit ridership in COVID-19 case was divided into inbound/outbound phase and riding phase. Considering COVID-19 effective spread range, passengers distribution and moving characters, the COVID-19 spreading model in the urban rail transit system was built. Taking the metro system in a certain city as the simulation case, 13 patients in metro ridership cases were assumed. With the accessibility of historical passenger data, the parameters in the model were determined. The possible infections in different loading levels were forecasted, and the elements related to possible infections were discussed. Analysis result indicates that when the loading level decreases to 10% of the average level, the possible infections in most cases are less than 1, which proves the effectiveness of current urban rail transit passenger control strength. The change in possible infections caused by the reduction in passenger number in the start/terminal(less than 20%) is less than that caused by the reduction in passenger number in the vehicle(60%-80%). Therefore, the passenger density in the vehicle has more significant impact on the possible infection compared to the passenger number in the start/terminal. When passing the stop, if the ratio of the on/off board passenger numbers is no more than 1, the possible infections can be controlled effectively. If making the possible infections nonlinearly and positively correlate to the stop number, the function among the loading level, stop number and possible infections will have better performance(determination coefficient is 0.700 1).
-
Key words:
- urban rail transit /
- COVID-19 /
- spreading model /
- possible infection /
- passenger density /
- transport strategy
-

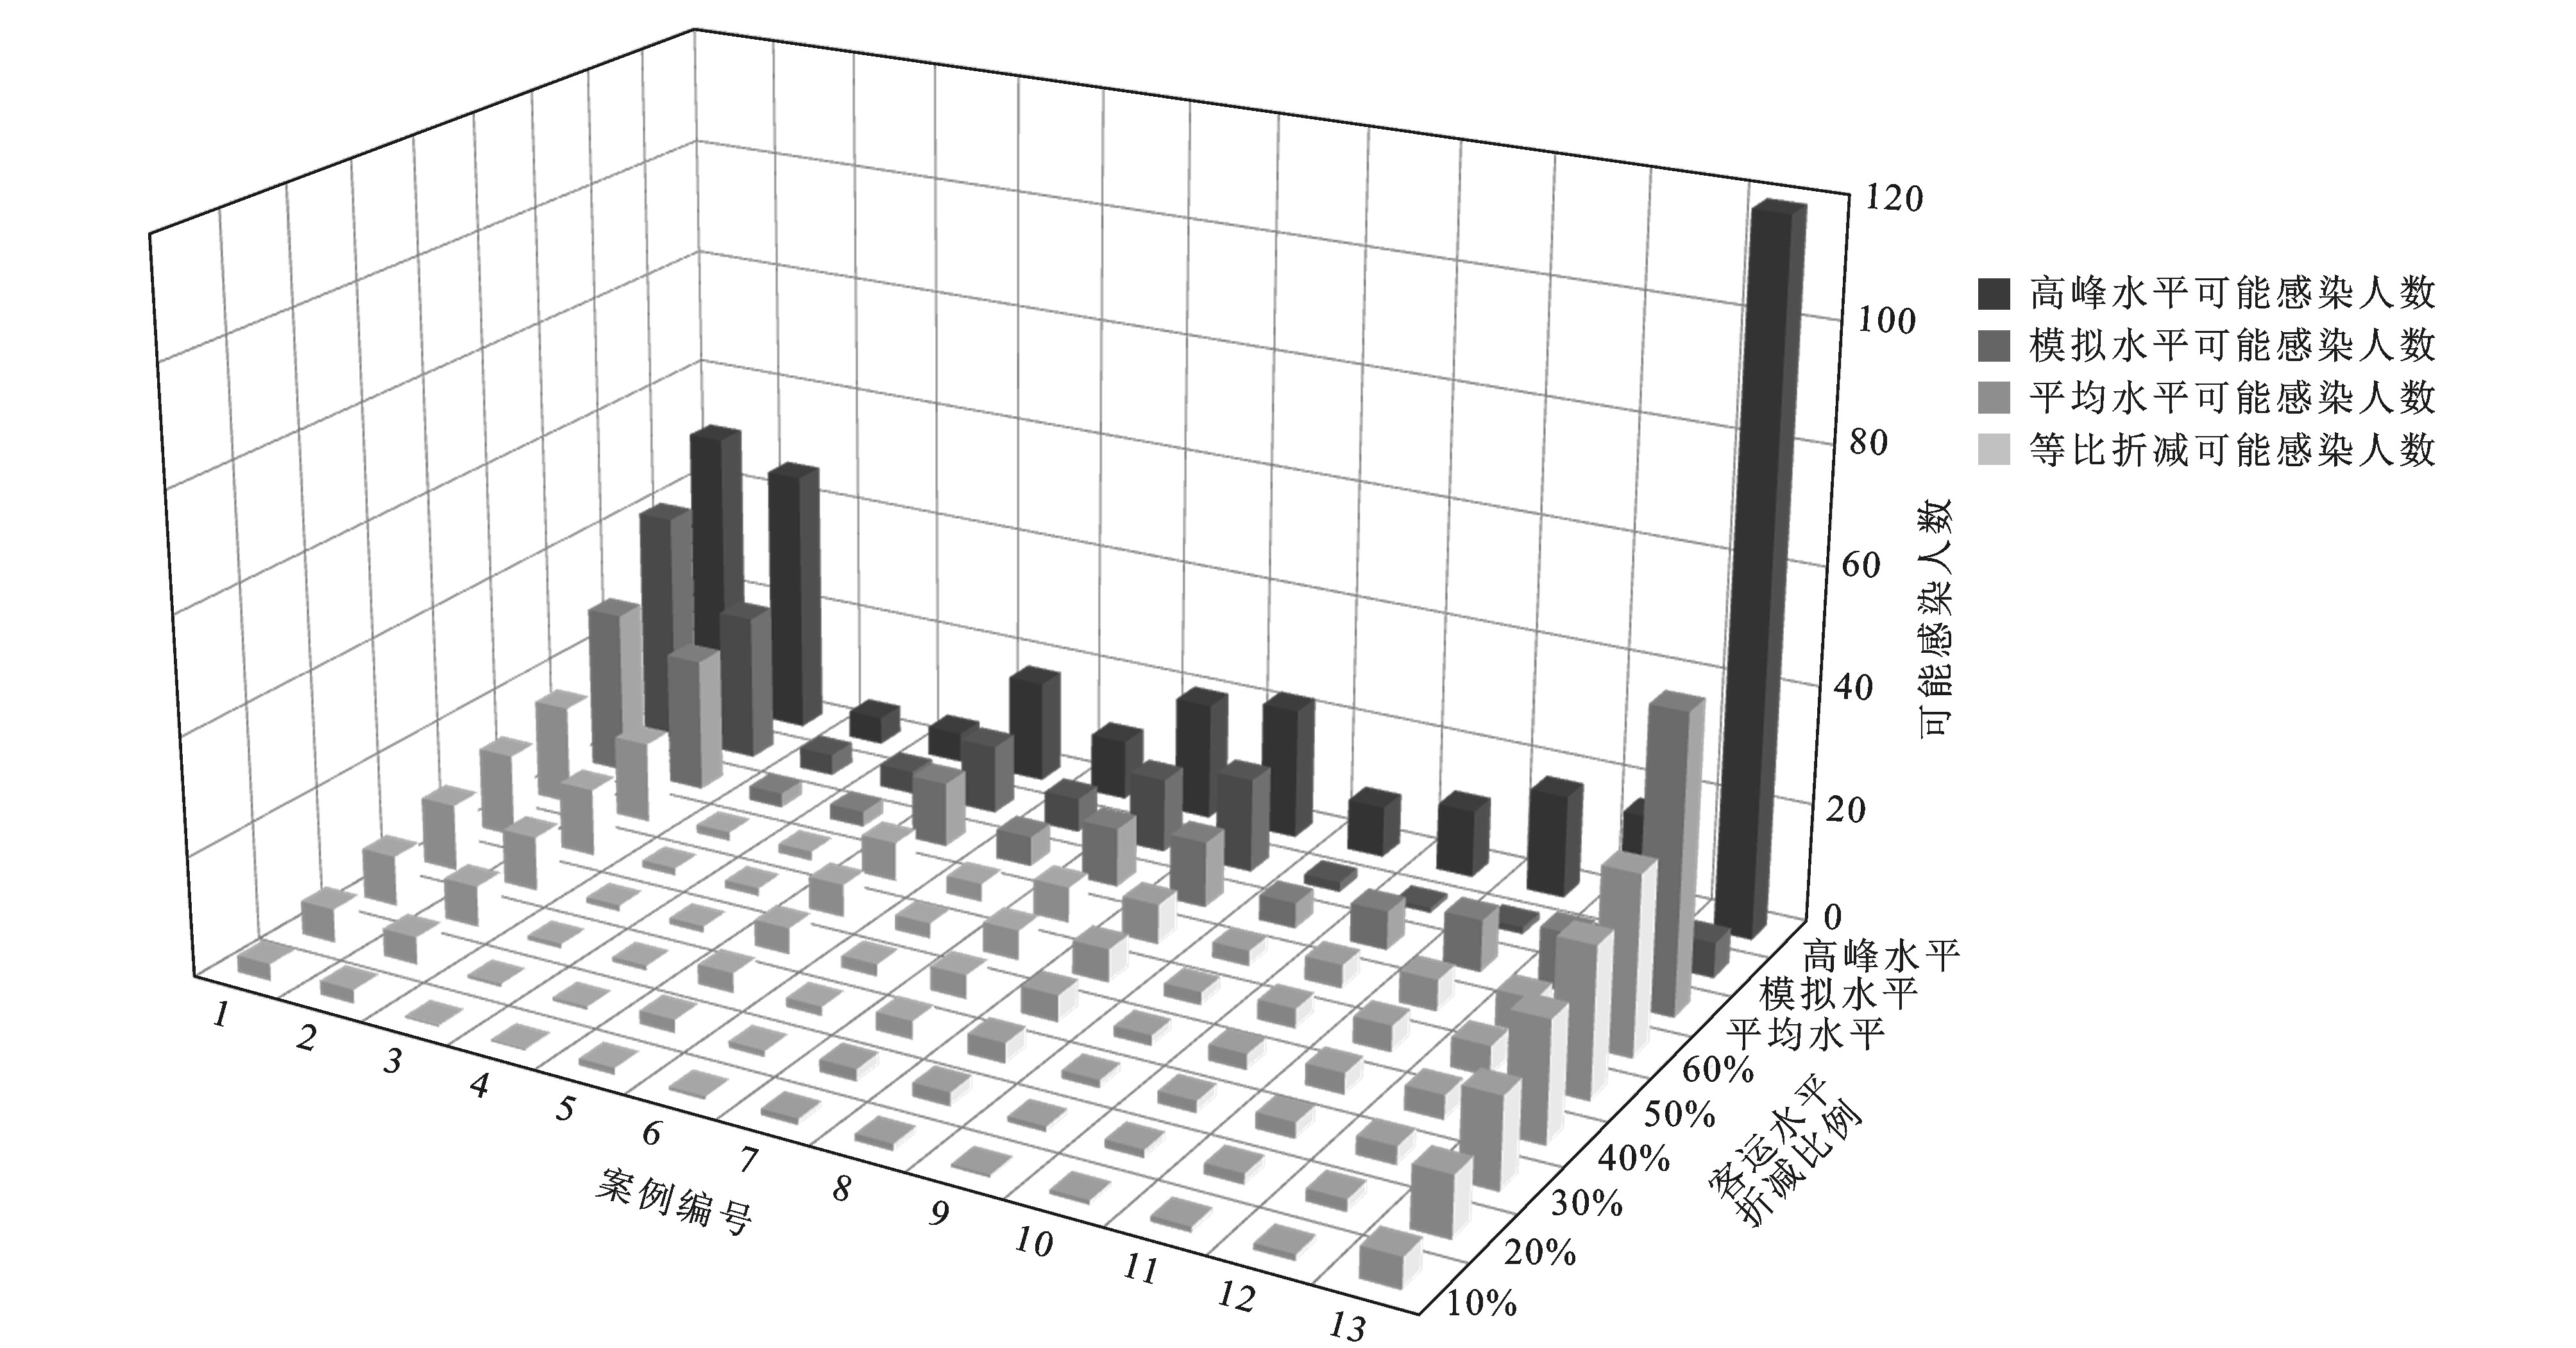
图 3 各案例不同载运水平下的可能感染人数预测结果
Figure 3. Prediction results of possible infections under different loading levels in each case

图 4 可能感染人数与城市轨道交通站内和车厢人数的关系
Figure 4. Relationships between possible infections and passenger numbers in station and vehicle

图 5 上下车人数与可能感染人数之间的关系
Figure 5. Relationship among on/off board number and possible infections

图 6 载运水平、经过站数与可能感染人数之间的关系
Figure 6. Relationships among loading level, stop number and possible infections
表 1 COVID-19模拟病例的地铁出行信息
Table 1. Metro travel informations of COVID-19 simulation cases
案例编号 始发站 始发日期 始发时间 换乘站 中转时间 终点站 终点时间 1 S4线、站点29 2020-01-14 14:30 S4线、站点7 15:20 2 S4线、站点7 2020-01-18 13:00 S4线、站点15 13:24 S1线、站点8 13:44 3 S4线、站点7 2020-01-20 19:40 S4线、站点8 19:49 4 S4线、站点9 2020-01-20 20:30 S4线、站点7 20:36 5 S2线、站点8 2020-01-21 10:20 S2线、站点10 10:25 S1线、站点17 10:37 6 S3线、站点15 2020-01-21 13:30 S3线、站点18 13:38 7 S4线、站点15 2020-01-21 16:00 S4线、站点7 16:19 8 S4线、站点7 2020-01-22 15:00 S4线、站点15 15:21 S1线、站点8 15:38 9 S4线、站点15 2020-01-22 23:00 S4线、站点7 23:19 10 S4线、站点14 2020-01-25 7:00 S4线、站点15 7:07 S2线、站点10 7:13 11 S1线、站点15 2020-01-27 20:54 S1线、站点18 21:10 S3线、站点23 21:57 12 S3线、站点23 2020-01-28 11:40 S3线、站点8 12:44 13 S4线、站点14 2020-02-04 10:00 S4线、站点15 10:07 S1线、站点1 10:42  下载: 导出CSV
表 2 COVID-19模拟病例的城市轨道交通出行数据
Table 2. Urban rail transit travel data of COVID-19 simulation cases
编号 客运水平 入站过程 中间过程 出站 始发站站内人数 初始乘车车厢人数 上半程上下车人数比例 换乘站站内人数 下半程乘车车厢人数 下半程上下车人数比例 终点站站内人数 1 模拟 80 13 0.79、1.08、1.37、0.94、2.01、1.16、1.20、1.47、1.15、1.12、1.15、1.03、1.42、1.21、1.14、0.93、1.11、0.59、0.68、1.17 38 平均 57 9 35 高峰 97 16 67 2 模拟 25 28 1.03、0.64、0.67、1.36、0.83、1.25、1.38 100 62 1.37、1.07、1.53、1.37、1.36 25 平均 23 26 90 56 23 高峰 44 50 182 113 44 3 模拟 20 25 0.61、2.00 120 平均 16 20 64 高峰 30 38 126 4 模拟 50 62 0.85 30 平均 33 40 28 高峰 63 78 54 5 模拟 60 55 1.31 200 87 0.85、0.69 80 平均 70 64 162 71 74 高峰 115 105 242 105 138 6 模拟 45 32 1.90、1.66 38 平均 40 28 32 高峰 81 58 49 7 模拟 28 49 1.20、1.16、0.93、1.06、0.85、0.83、1.14 70 平均 22 39 57 高峰 45 78 109 8 模拟 20 31 0.91、1.10、0.72、1.18、0.89、0.93、1.23 110 43 1.13、1.29、1.17、1.11、1.08 10 平均 18 27 67 26 9 高峰 34 53 135 53 17 9 模拟 40 25 0.39、0.28、0.52、0.32、1.17、5.07、0.34 20 平均 110 69 37 高峰 224 140 70 10 模拟 13 5 20 4 30 平均 129 50 103 65 142 高峰 202 78 205 135 226 11 模拟 15 4 1.83、0.93 25 3 1.28、0.48、0.43、0.35、0.51、0.44、1.16、6.31 8 平均 26 41 22 44 10 高峰 50 83 49 86 19 12 模拟 7 3 0.21、0.76、1.31、1.55、1.58、1.38、1.72、0.79、1.12、1.31、0.98、1.34、1.38、1.27 24 平均 19 22 88 高峰 28 38 153 13 模拟 12 3 14 3 1.13、0.70、1.31、1.32、1.57、1.07、2.46、1.61、1.18、1.02、1.53、0.76 3 平均 134 55 63 25 41 高峰 227 86 122 61 76
下载: 导出CSV
-
[1] ZHANG Jin-nong, ZHOU Lu-qian, YANG Yu-qiong, et al. Therapeutic and triage strategies for 2019 novel coronavirus disease in fever clinics[J]. The Lancet Respiratory Medicine, 2020, 8(3): 11-12. doi: 10.1016/S2213-2600(20)30071-0 [2] XU Zhe, SHI Lei, WANG Yi-jin, et al. Pathological findings of COVID-19 associated with acute respiratory distress syndrome[J]. The Lancet Respiratory Medicine, 2020, 8(4): 420-422. doi: 10.1016/S2213-2600(20)30076-X [3] 中国疾病预防控制中心. 新型冠状病毒肺炎流行病学特征分析[J]. 中华流行病学杂志, 2020, 41(2): 145-151. https://www.cnki.com.cn/Article/CJFDTOTAL-FBYF202003001.htmChinese Center for Disease Control and Prevention. The epidemiological characteristics of an outbreak of 2019 novel coronavirus diseases (COVID-19) in China[J]. Chinese Journal of Epidemiology, 2020, 41(2): 145-151. (in Chinese). https://www.cnki.com.cn/Article/CJFDTOTAL-FBYF202003001.htm [4] ROY M A, HANS H, DON K, et al. How will country-based mitigation measures influence the course of the COVID-19 epidemic?[J]. The Lancet, 10.1016/S0140-6736(20)30567-5. [5] GU Xiao-ying, CAO Bin, WANG Jian-wei. Full spectrum of COVID-19 severity still being depicted—authors' reply[J]. The Lancet 10.1016/S0140-6736(20)30371-8. [6] KANG Yun, CASTILLO-CHAVEZ C. Dynamics of SI models with both horizontal and vertical transmissions as well as Allee effects[J]. Mathematical Biosciences, 2014, 248: 97-116. doi: 10.1016/j.mbs.2013.12.006 [7] SHU Hong-ying, FAN De-jun, WEI Jun-jie. Global stability of multi-group SEIR epidemic models with distributed delays and nonlinear transmission[J]. Nonlinear Analysis: Real World Applications, 2012, 13(4): 1581-1592. doi: 10.1016/j.nonrwa.2011.11.016 [8] 李璐, 宣慧玉. 多主体仿真在公共卫生事件应急管理中的应用——以一个传染病政策仿真系统为例[J]. 西安交通大学学报(社会科学版), 2010, 30(1): 57-64. https://www.cnki.com.cn/Article/CJFDTOTAL-XAJD201001009.htmLI Lu, XUAN Hui-yu. Application of multi-agent simulation to emergency management of public health events—with an epidemic control policy simulation system as an example[J]. Journal of Xi'an Jiaotong University (Social Sciences), 2010, 30(1): 57-64. (in Chinese). https://www.cnki.com.cn/Article/CJFDTOTAL-XAJD201001009.htm [9] PASTOR-SATORRAS R, VESPIGNANI A. Epidemic dynamics and endemic states in complex networks[J]. Physical Review E DOI: 10.1103/PhysRevE.63.066117. [10] NEWMAN M E J. Spread of epidemic disease on networks[J]. Physical Review E, DOI: 10.1103/PhysRevE.66.016128. [11] FUMANELLI L, AJELLI M, MERLER S, et al. Model-based comprehensive analysis of school closure policies for mitigating influenza epidemics and pandemics[J]. PLOS Computational Biology, DOI: 10.1371/journal.pcbi.1004681. [12] 范如国, 王奕博, 罗明, 等. 基于SEIR的新型肺炎传播模型及拐点预测分析[J]. 电子科技大学学报, http://kns.cnki.net/kcms/detail/51.1207.T.20200221.1041.002.html.FAN Ru-guo, WANG Yi-bo, LUO Ming, et al. SEIR-based novel pneumonia transmission model and inflection point prediction analysis[J]. Journal of University of Electronic Science and Technology of China, http://kns.cnki.net/kcms/detail/51.1207.T.20200221.1041.002.html. (inChinese). [13] 曹盛力, 冯沛华, 时朋朋. 修正SEIR传染病动力学模型应用于湖北省2019冠状病毒病(COVID-19)疫情预测和评估. 浙江大学学报(医学版)DOI: 10.3785/j.issn.1008-9292.2020.02.05.CAO Sheng-li, FENG Pei-hua, SHI Peng-peng. Study on the epidemic development of COVID-19 in Hubei Province by a modified SEIR model. Journal of Zhejiang University (Medical Sciences), DOI: 10.3785/j.issn.1008-9292.2020.02.05.(inChinese) [14] 喻孜, 张贵清, 刘庆珍, 等. 基于时变参数-SIR模型的2019-nCoV疫情评估和预测[J]. 电子科技大学学报, DOI: 10.12178/1001-0548.2020027.YU Zi, ZHANG Gui-qing, LIU Qing-zhen, et al. The outbreak assessment and prediction of 2019-nCoV based on time-varying SIR Model[J]. Journal of University of Electronic Science and Technology of China, DOI: 10.12178/1001-0548.2020027.(inChinese). [15] WEI Yu, CHEN Mu-chen. Forecasting the short-term metro passenger flow with empirical mode decomposition and neural networks[J]. Transportation Research Part C: Emerging Technologies, 2012, 21(1): 148-162. doi: 10.1016/j.trc.2011.06.009 [16] SUN Li-jun, LU Yang, JIN Jian-gang, et al. An integrated Bayesian approach for passenger flow assignment in metro networks[J]. Transportation Research Part C: Emerging Technologies, 2015, 52: 116-131. doi: 10.1016/j.trc.2015.01.001 [17] LI Shu-kai, DESSOUKY M M, YANG Li-xing, et al. Joint optimal train regulation and passenger flow control strategy for high-frequency metro lines[J]. Transportation Research Part B: Methodological, 2017, 99: 113-137. doi: 10.1016/j.trb.2017.01.010 [18] SUN Yan-shuo, SHI Jun-gang, SCHONFELD P M. Identifying passenger flow characteristics and evaluating travel time reliability by visualizing AFC data: a case study of Shanghai Metro[J]. Public Transport, 2016, 8: 341-363. doi: 10.1007/s12469-016-0137-8 [19] HELBING D, JOHANSSON A, AL-ABIDEEN HZ. Dynamics of crowd disasters: an empirical study[J]. Physical Review E, DOI: 10.1103/physreve.75.046109 [20] TROKO J, MYLES P, GIBSON J, et al. Is public transport a risk factor for acute respiratory infection?[J]. BMC Infectious Diseases, DOI: 10.1186/1471-2334-11-16 [21] GOSCÉ L, BARTON DA W, JOHANSSON A. Analytical modelling of the spread of disease in confined and crowded spaces[J]. Scientific Reports, DOI: 10.1038/srep04856. [22] GOSCÉ L, JOHANSSON A. Analysing the link between public transport use and airborne transmission: mobility and contagion in the London underground[J]. Environmental Health, DOI: 10.1186/s12940-018-0427-5. [23] 严阅, 陈瑜, 刘可伋, 等. 基于一类时滞动力学系统对新型冠状病毒肺炎疫情的建模和预测[J]. 中国科学: 数学, 2020, 50(3): 385-392. https://www.cnki.com.cn/Article/CJFDTOTAL-JAXK202003003.htmYAN Yue, CHEN Yu, LIU Ke-ji, et al. Modeling and prediction for the trend of outbreak of NCP based on a time-delay dynamic system[J]. Scientia Sinica: Mathematica, 2020, 50(3): 385-392. (in Chinese). https://www.cnki.com.cn/Article/CJFDTOTAL-JAXK202003003.htm [24] 金启轩. 中国新冠肺炎疫情预测建模与理性评估[J]. 统计与决策, 2020(5): 11-14. https://www.cnki.com.cn/Article/CJFDTOTAL-TJJC202005003.htmJIN Qi-xuan. Novel coronavirus pneumonia epidemic prediction modeling and rational evaluation in China[J]. Statistics and Decision, 2020(5): 11-14. (in Chinese). https://www.cnki.com.cn/Article/CJFDTOTAL-TJJC202005003.htm [25] THOMPSON R N. Novel coronavirus outbreak in Wuhan, China, 2020: intense surveillance is vital for preventing sustained transmission in new locations[J]. Journal of Clinical Medicine, DOI: 10.3390/jcm9020498. [26] 孙晨, 江亚南, 赵继敏. 新型冠状病毒肺炎流行病学特点和治疗药物研究进展[J]. 中国现代医学杂志, 2020, 30(6): 72-79. https://www.cnki.com.cn/Article/CJFDTOTAL-ZXDY202006015.htmSUN Chen, JIANG Ya-nan, ZHAO Ji-min. Overview on epidemiological characteristics and research of therapeutic drugs of COVID-19[J]. China Journal of Modern Medicine, 2020, 30(6): 72-79. (in Chinese). https://www.cnki.com.cn/Article/CJFDTOTAL-ZXDY202006015.htm [27] TANG Biao, WANG Xia, LI Qian, et al. Estimation of the transmission risk of the 2019-nCoV and its implication for public health interventions[J]. Journal of Clinical Medicine, DOI: 10.3390/jcm9020462. [28] CHEN Wang, PETER W H, FREDERICK G H, et al. A novel coronavirus outbreak of global health concern[J]. The Lancet, 10.1016/S0140-6736(20)30185-9. [29] XU Zhou, LI Shu, TIAN Shen, et al. Full spectrum of COVID-19 severity still being depicted[J]. The Lancet, 10.1016/S0140-6736(20)30308-1. [30] HUANG Chao-lin, WANG Ye-ming, LI Xing-wang, et al. Clinical features of patients infected with 2019 novel coronavirus in Wuhan, China[J]. The Lancet, 10.1016/S0140-6736(20)30183-5. -


 点击查看大图
计量
- 文章访问数: 1143
- HTML全文浏览量: 167
- PDF下载量: 653
- 被引次数: 0
