

Abnormal road driving behavior spectrum establishment and characteristic value calculation method based on vehicle driving trajectory
-
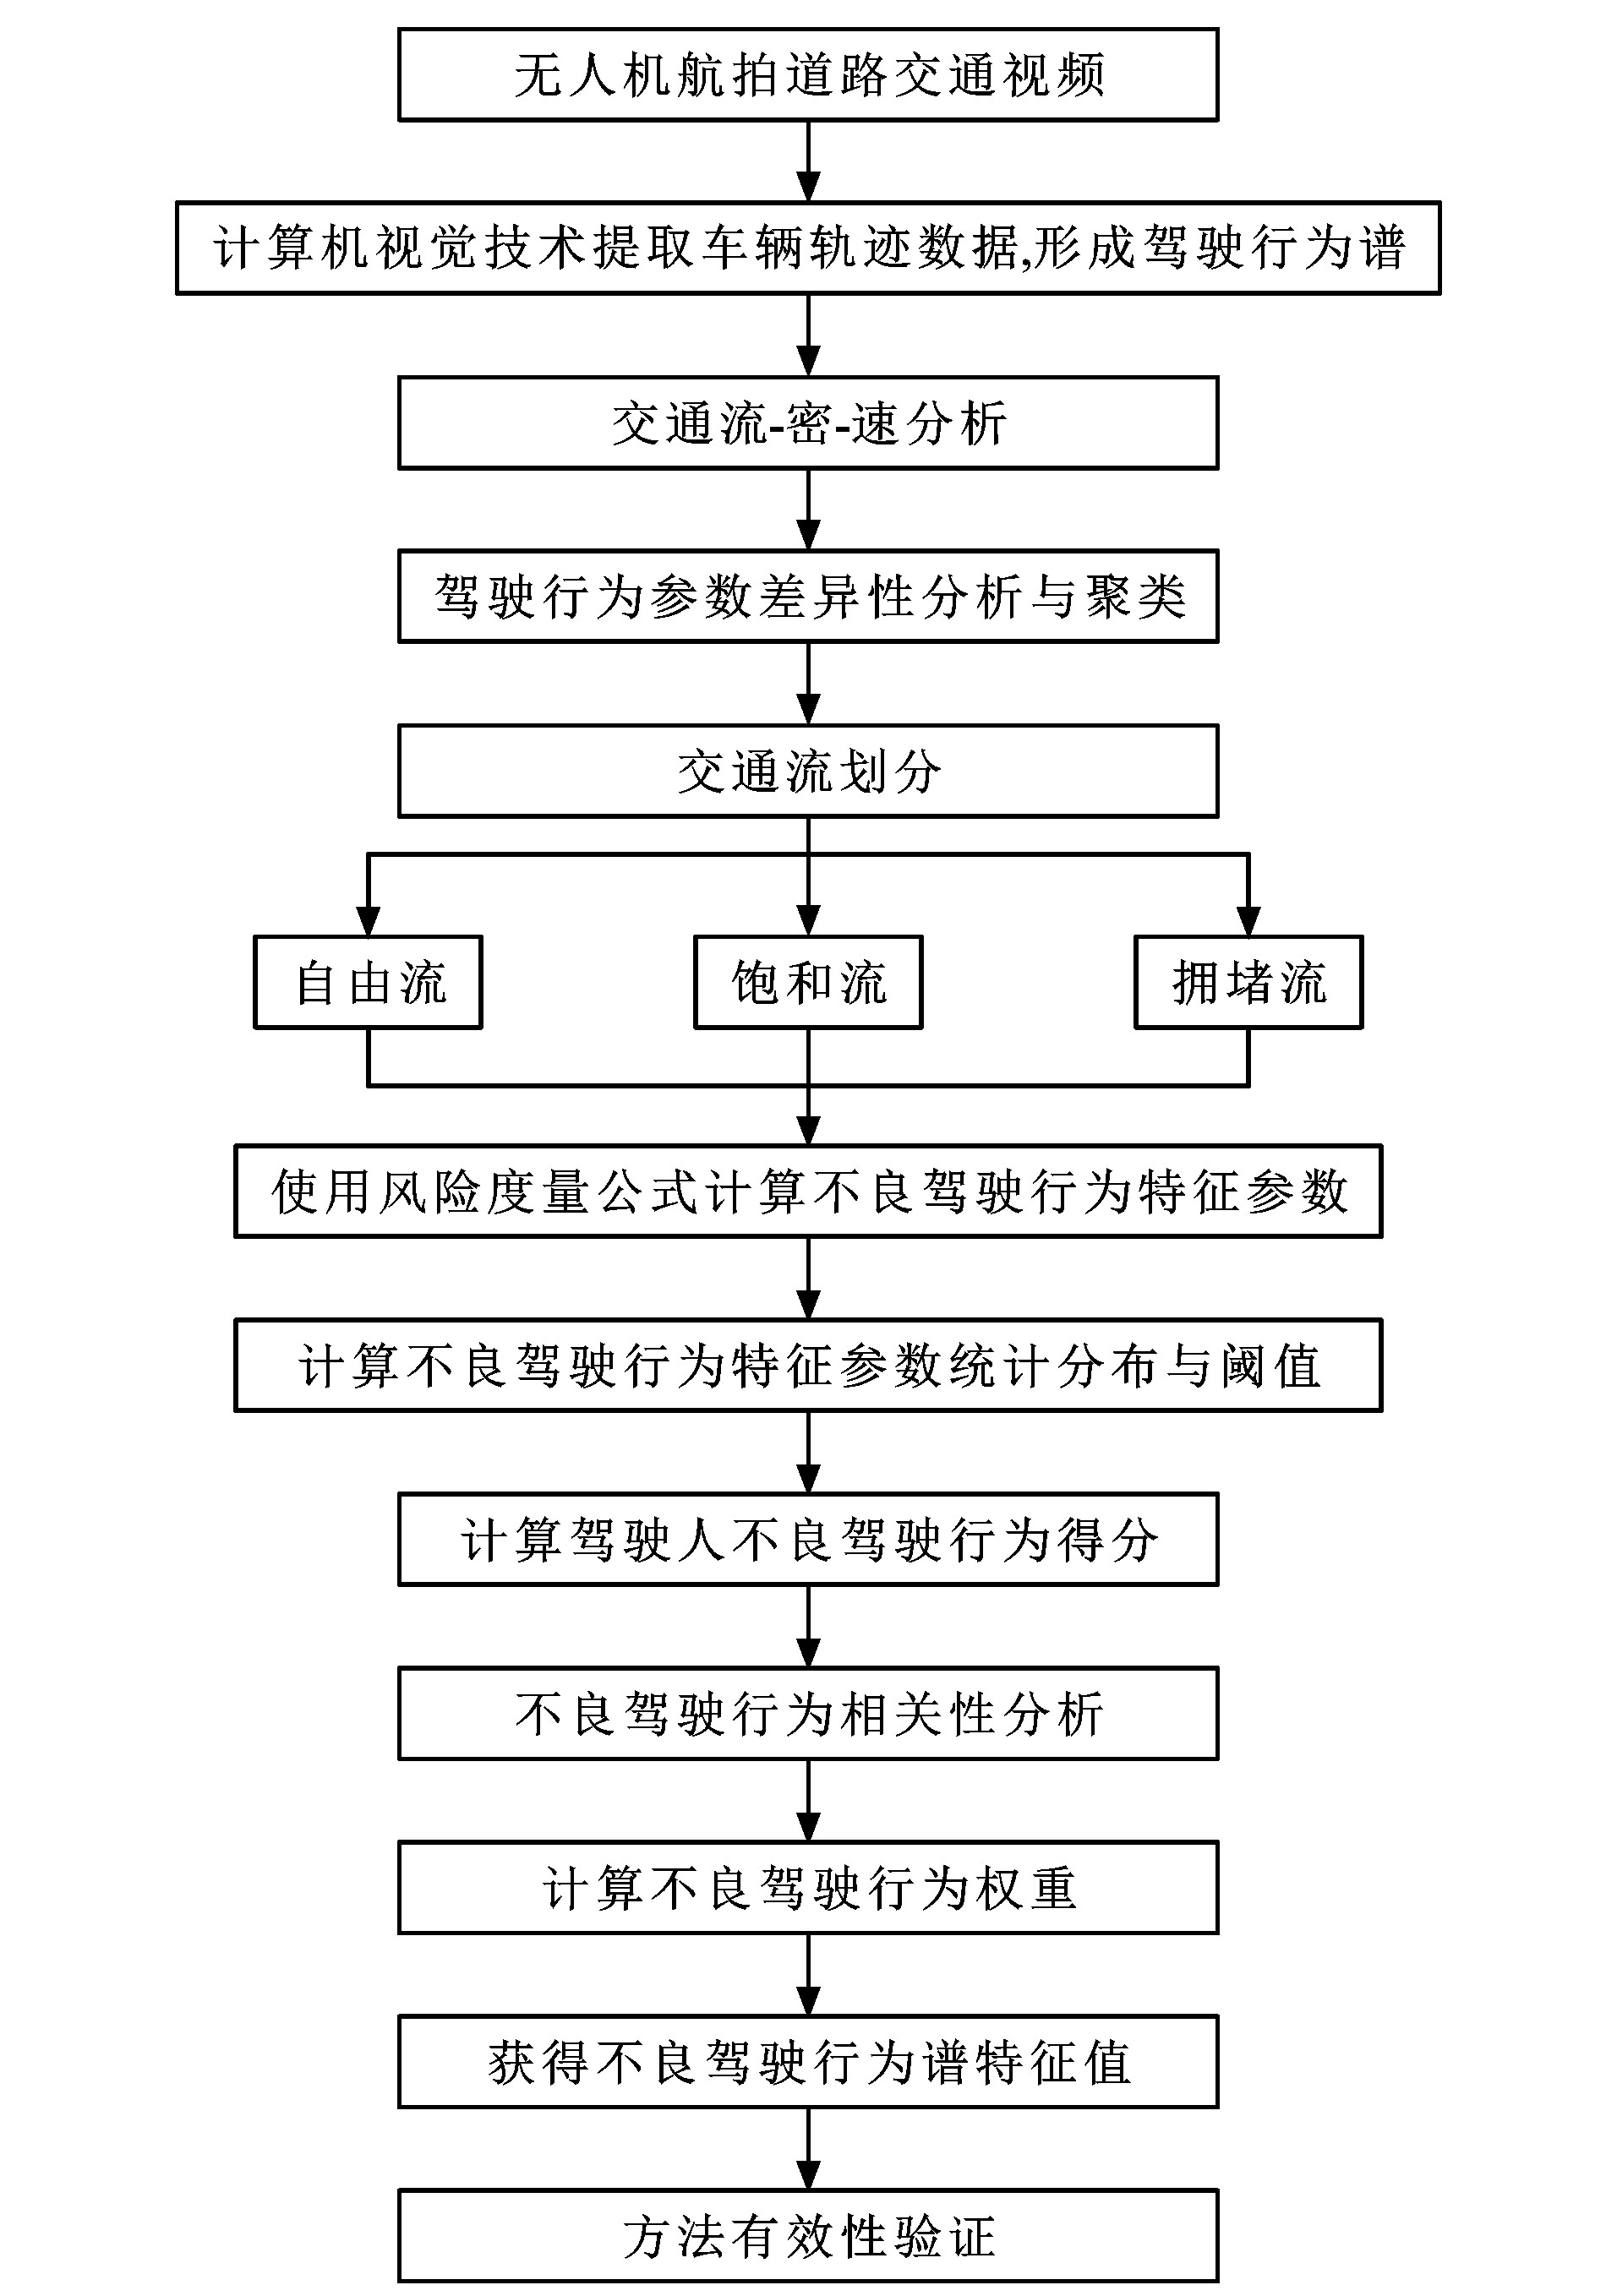
摘要: 为了量化描述不同道路驾驶场景下驾驶行为的动态变化过程与不良驾驶程度, 研究了不良驾驶行为谱的构建与分析方法; 基于车辆行驶轨迹关键参数建立驾驶行为谱; 应用风险度量方法量化4种不良驾驶行为, 包括不良跟驰、蛇形驾驶、速度不稳与不良换道; 基于驾驶行为谱建立了不良驾驶行为谱; 基于交通流量-密度关系与驾驶行为统计参数的差异对交通流状态进行划分; 在不同交通流状态下, 使用四分位差法确定了不良驾驶行为特征参数阈值; 基于特征参数阈值计算每个驾驶人的不良驾驶行为得分; 使用CRITIC赋权法确定了不良驾驶行为的权重, 为每个驾驶人计算不良驾驶行为谱特征值; 为了验证方法的有效性, 使用无人机交通视频采集了上海市的车辆行驶轨迹数据, 分析了小汽车不良驾驶行为特征; 通过专家打分的方法对不良驾驶行为谱特征值进行验证。分析结果表明: 基于驾驶行为参数的交通流状态聚类方法将数据中的交通流状态分为自由流、饱和流、拥堵流3类; 聚类方法比基于基本图的交通流状态划分方法更适合驾驶行为分析; 不同交通流状态下的不良跟驰、蛇形驾驶、速度不稳特征参数分布明显不同, 拥堵流状态下的不良跟驰、蛇形驾驶、速度不稳极端值出现更频繁, 而不良换道特征参数在各交通流状态下有相似的分布; 蛇形驾驶、速度不稳、不良换道的特征参数阈值随交通流密度上升而上升; 使用CRITIC赋权法计算的不良跟驰、蛇形驾驶、速度不稳、不良换道的权重分别为0.19、0.33、0.37、0.11;自由流、饱和流、拥堵流的不良驾驶行为谱特征值的分布范围相近, 均处于0与0.4之间; 专家的不良驾驶行为评价与不良驾驶行为谱特征值一致。可见, 不良驾驶行为谱的构建与特征值计算方法能够使用车辆行驶轨迹数据自动辨识不良驾驶人, 具有客观性、适应性以及可靠性, 能及时发现不良驾驶人, 给驾驶人提供安全提示, 为交通管理部门提供交通安全预警的技术支持。Abstract: To quantitatively describe the dynamic change process of driving behavior and the degree of abnormal driving under different road driving scenarios, the establishment and analysis methods of abnormal driving behavior spectrum were studied. The driving behavior spectrum based on the key parameters of vehicle driving trajectory was established. The measurement of risk method was applied to quantify four types of abnormal driving behaviors, including abnormal car-following, serpentine driving, speed instability, and abnormal lane-changing. An abnormal driving behavior spectrum was established based on the driving behavior spectrum. Traffic flow conditions were divided based on the traffic volume-density relationship and the differences among the statistical parameters of driving behavior. Under different traffic flow conditions, the thresholds of the characteristic parameters of abnormal driving behaviors were determined by using the interquartile range method. The abnormal driving behavior scores of each driver were calculated based on the characteristic parameter thresholds. The weights of abnormal driving behaviors were determined by using the CRITIC weighting method and the characteristic values of the abnormal driving behavior spectrum for each driver were calculated. To verify the effectiveness of the method, vehicle driving trajectory data were collected by an unmanned aerial vehicle traffic video in Shanghai and the characteristics of car abnormal driving behavior were analyzed. The characteristic values of the abnormal driving behavior spectrum were verified by the expert scoring method. Analysis result shows that the traffic flow condition clustering method based on driving behavior parameters divides the traffic flow condition of data into three categories: free flow, saturated flow, and congested flow. The clustering method is more suitable for driving behavior analysis than the traffic flow condition division method based on the fundamental diagram. The characteristic parameter distributions of abnormal car-following, serpentine driving, and speed instability under different traffic flow conditions are significantly different. The occurrence of extreme values of abnormal car-following, serpentine driving, and speed instability under congested flow conditions is more frequent, while the abnormal lane-changing characteristic parameter has a similar distribution under each traffic flow condition. The thresholds of serpentine driving, speed instability, and abnormal lane-changing increase with the increase of traffic flow density. The weights of abnormal car-following, serpentine driving, speed instability, and abnormal lane-changing calculated by the CRITIC weighting method are 0.19, 0.33, 0.37, and 0.11, respectively. The distribution ranges of the abnormal driving behavior spectrum characteristic values under free flow, saturated flow, and congested flow are similar, all between 0 and 0.4. The expert's abnormal driving behavior evaluation is consistent with the abnormal driving behavior spectrum characteristic values. The establishment of an abnormal driving behavior spectrum and the calculation method of characteristic values can automatically identify abnormal drivers by using the vehicle driving trajectory data. The method is objective, adaptable, and reliable, and can detect abnormal drivers in time, providing drivers with safety tips and technical support for traffic safety early warning to traffic management departments.
-

图 2 驾驶行为谱与不良驾驶行为谱的关系
Figure 2. Relationship between driving behavior spectrum and abnormal driving behavior spectrum

图 4 自由流下的不良跟驰特征参数分布
Figure 4. Distribution of abnormal car-following characteristic parameter under free flow

图 5 饱和流下的不良跟驰特征参数分布
Figure 5. Distribution of abnormal car-following characteristic parameter under saturated flow

图 6 拥堵流下的不良跟驰特征参数分布
Figure 6. Distribution of abnormal car-following characteristic parameter under congested flow

图 7 自由流下的蛇形驾驶特征参数分布
Figure 7. Distribution of serpentine driving characteristic parameter under free flow

图 8 饱和流下的蛇形驾驶特征参数分布
Figure 8. Distribution of serpentine driving characteristic parameter under saturated flow

图 9 拥堵流下的蛇形驾驶特征参数分布
Figure 9. Distribution of serpentine driving characteristic parameter under congested flow

图 10 自由流下的速度不稳特征参数分布
Figure 10. Distribution of speed instability characteristic parameter under free flow

图 11 饱和流下的速度不稳特征参数分布
Figure 11. Distribution of speed instability characteristic parameter under saturated flow

图 12 拥堵流下的速度不稳特征参数分布
Figure 12. Distribution of speed instability characteristic parameter under congested flow

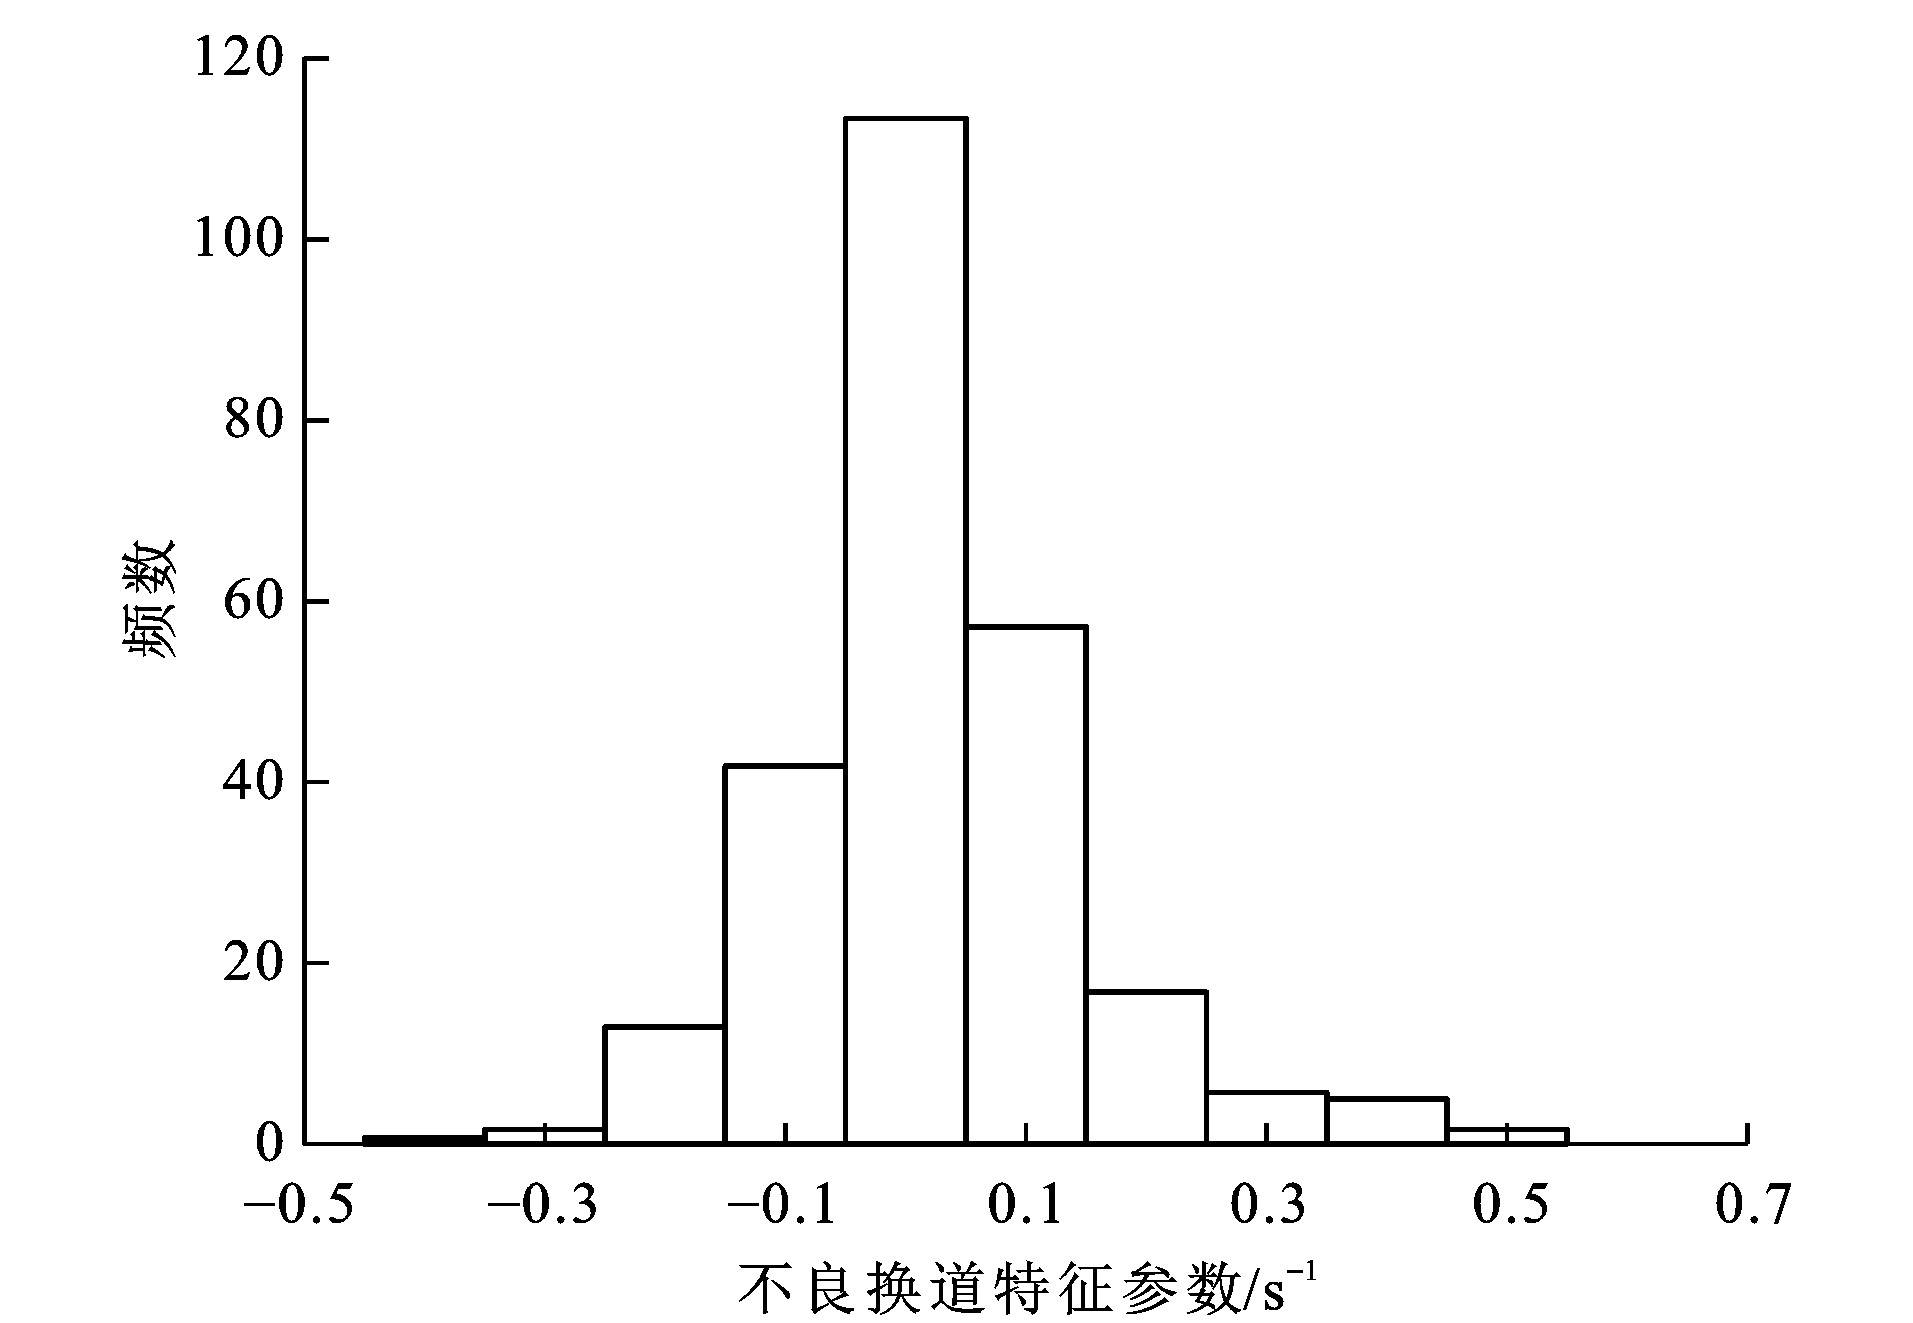
图 13 自由流下的不良换道特征参数分布
Figure 13. Distribution of abnormal lane-changing characteristic parameter under free flow

图 14 饱和流下的不良换道特征参数分布
Figure 14. Distribution of abnormal lane-changing characteristic parameter under saturated flow

图 15 拥堵流下的不良换道特征参数分布
Figure 15. Distribution of abnormal lane-changing characteristic parameter under congested flow

图 20 不良驾驶行为谱特征值分布
Figure 20. Distribution of abnormal driving behavior spectrum characteristic values
表 1 数据集的相关参数
Table 1. Relevant parameters of datasets
视频序号 拍摄时段 流量/(veh·h-1) 平均车速/(km·h-1) 密度/(veh·km-1) 小汽车样本量/veh 1 上午平峰 4 276 77 56 650 2 上午平峰 3 862 70 55 606 3 下午平峰 9 918 65 153 863 4 下午平峰 9 334 62 151 841 5 晚高峰 10 463 58 184 1 650 6 晚高峰 10 703 57 188 1 504 7 早高峰 8 706 29 281 1 706 8 早高峰 8 699 31 300 1 664  下载: 导出CSV
表 2 驾驶行为统计参数
Table 2. Statistical parameters of driving behavior
视频序号 纵向速度/(m·s-1) 正加速度/(m·s-2) 负加速度/(m·s-2) 平均换道次数 平均值 标准差 差异系数 平均值 标准差 差异系数 平均值 标准差 差异系数 1 21.39 3.71 0.17 0.27 0.23 0.84 0.19 0.22 1.12 0.12 2 19.44 3.41 0.18 0.27 0.22 0.80 0.22 0.27 1.24 0.13 3 18.06 2.83 0.16 0.22 0.20 0.92 0.21 0.19 0.90 0.11 4 17.22 2.59 0.15 0.21 0.19 0.88 0.21 0.21 0.99 0.10 5 16.11 2.39 0.15 0.24 0.24 1.01 0.22 0.20 0.88 0.08 6 15.83 3.66 0.23 0.26 0.28 1.09 0.30 0.29 0.99 0.08 7 8.06 3.11 0.39 0.34 0.36 1.04 0.32 0.33 1.04 0.05 8 8.61 4.76 0.55 0.31 0.27 0.87 0.34 0.30 0.88 0.08
下载: 导出CSV
表 3 道路不良驾驶行为谱的场景信息
Table 3. Scenario information of abnormal road driving behavior spectrum
场景参数 信息 道路类型 一级公路 车道数 双向六车道 直/曲线 直线 坡度 0 是否有中央隔离带 是 是否有机非隔离带 是 天气 晴天 交通流状态 自由流、饱和流、拥堵流 限速/(km·h-1) 80 车辆类型 小汽车
下载: 导出CSV
表 4 不良驾驶行为特征参数阈值
Table 4. Thresholds of abnormal driving behavior characteristic parameters
交通流状态 蛇形驾驶 速度不稳 不良换道/s-1 自由流 0.10 0.01 0.23 饱和流 0.07 0.02 0.26 拥堵流 0.05 0.05 0.27
下载: 导出CSV
表 5 自由流下的特征参数相关系数
Table 5. Correlation coefficients of characteristic parameters under free flow
不良驾驶行为 不良跟驰 蛇形驾驶 速度不稳 不良换道 不良跟驰 1.00 0.24* 0.04* 0.03 蛇形驾驶 0.24* 1.00 0.07* 0.23* 速度不稳 0.04* 0.07* 1.00 0.00 不良换道 0.03 0.23* 0.00 1.00
下载: 导出CSV
表 6 饱和流下的特征参数相关系数
Table 6. Correlation coefficients of characteristic parameters under saturated flow
不良驾驶行为 不良跟驰 蛇形驾驶 速度不稳 不良换道 不良跟驰 1.00 0.17* 0.03* 0.02 蛇形驾驶 0.17* 1.00 -0.01 0.06* 速度不稳 0.03* -0.01 1.00 0.01 不良换道 0.02 0.06* 0.01 1.00
下载: 导出CSV
表 7 拥堵流下的特征参数相关系数
Table 7. Correlation coefficients of characteristic parameters under congested flow
不良驾驶行为 不良跟驰 蛇形驾驶 速度不稳 不良换道 不良跟驰 1.00 0.11* 0.04* 0.02 蛇形驾驶 0.11* 1.00 -0.02 0.10* 速度不稳 0.04* -0.02 1.00 0.00 不良换道 0.02 0.10* 0.00 1.00
下载: 导出CSV
表 8 CRITIC赋权法计算结果
Table 8. Results of CRITIC weighting method
不良驾驶行为 不良跟驰 蛇形驾驶 速度不稳 不良换道 对比强度 0.04 0.07 0.07 0.02 冲突性指标 2.46 2.60 2.80 2.82 信息量 0.10 0.18 0.20 0.06 最终权重 0.19 0.33 0.37 0.11
下载: 导出CSV
-
[1] 邱俊. 中国交通事故和交通伤成因、特点与趋势研究[D]. 重庆: 第三军医大学, 2009.QIU Jun. Analysis on causes, features and trend of road traffic crashes and traffic injuries in China[D]. Chongqing: Third Military Medical University, 2009. (in Chinese). [2] 陈镜任, 吴业福, 吴冰. 基于车辆行驶数据的驾驶人行为谱分析方法[J]. 计算机应用, 2018, 38(7): 1916-1922, 1928. https://www.cnki.com.cn/Article/CJFDTOTAL-JSJY201807017.htmCHEN Jing-ren, WU Ye-fu, WU Bing. Driver behavior spectrum analysis method based on vehicle driving data[J]. Journal of Computer Applications, 2018, 38(7): 1916-1922, 1928. (in Chinese). https://www.cnki.com.cn/Article/CJFDTOTAL-JSJY201807017.htm [3] 黄丰雨, 吴业福, 陈镜任, 等. 基于区域道路实况数据的交通行为谱分析方法[J]. 计算机应用, 2019, 39(3): 907-912. https://www.cnki.com.cn/Article/CJFDTOTAL-JSJY201903048.htmHUANG Feng-yu, WU Ye-fu, CHEN Jing-ren, et al. Traffic behavior spectrum analysis method based on regional road live data[J]. Journal of Computer Applications, 2019, 39(3): 907-912. (in Chinese). https://www.cnki.com.cn/Article/CJFDTOTAL-JSJY201903048.htm [4] SUN Chao, CHEN Xiao-hong, ZHANG H M, et al. Evaluation of driving behavior based on massive vehicle trajectory data[J]. Journal of Southeast University: English Edition, 2019, 35(4): 502-508. [5] 王海星, 王翔宇, 王招贤, 等. 基于数据挖掘的危险货物运输风险驾驶行为聚类分析[J]. 交通运输系统工程与信息, 2020, 20(1): 183-189. https://www.cnki.com.cn/Article/CJFDTOTAL-YSXT202001029.htmWANG Hai-xing, WANG Xiang-yu, WANG Zhao-xian, et al. Dangerous driving behavior clustering analysis for hazardous materials transportation based on data mining[J]. Journal of Transportation Systems Engineering and Information Technology, 2020, 20(1): 183-189. (in Chinese). https://www.cnki.com.cn/Article/CJFDTOTAL-YSXT202001029.htm [6] LIU Yong-gang, WANG Ji-ming, ZHAO Pan, et al. Research on classification and recognition of driving styles based on feature engineering[J]. IEEE Access, 2019, 7: 89245-89255. doi: 10.1109/ACCESS.2019.2926593 [7] TAUBMAN-BEN-ARI O, MIKULINCER M, GILLATH O. The multidimensional driving style inventory—scale construct and validation[J]. Accident Analysis and Prevention, 2004, 36(3): 323-32. doi: 10.1016/S0001-4575(03)00010-1 [8] ZHANG Da-rui. Vehicle parameters estimation and driver behavior classification for adaptive shift strategy of heavy-duty vehicles[D]. Clemson: Clemson University, 2017. [9] FERNANDEZ S, ITO T. Driver classification for intelligent transportation systems using fuzzy logic[C]//IEEE. 19th International Conference on Intelligent Transportation Systems. New York: IEEE, 2016: 1212-1216. [10] CHEN Zhi-jun, WU Chao-chong, HUANG Zhen, et al. Dangerous driving behavior detection using video-extracted vehicle trajectory histograms[J]. Journal of Intelligent Transportation Systems, 2017, 21(5): 409-421. doi: 10.1080/15472450.2017.1305271 [11] TEIMOURI F, GHATEE M. A real-time warning system for rear-end collision based on random forest classifier[J]. Journal of Soft Computing in Civil Engineering, 2020, 4(1): 49-71. [12] ISHIBASHI M, OKUWA M, DOIS, etal. Indices for characterizing driving style and their relevance to car following behavior[C]//IEEE. SICE Annual Conference. New York: IEEE, 2007: 1132-1137. [13] BEJANI M M, GHATEE M. A context aware system for driving style evaluation by an ensemble learning on smartphone sensors data[J]. Transportation Research Part C: Emerging Technologies, 2018, 89: 303-320. doi: 10.1016/j.trc.2018.02.009 [14] LI Guo-fa, LI S E, CHENG Bo, et al. Estimation of driving style in naturalistic highway traffic using maneuver transition probabilities[J]. Transportation Research Part C: Emerging Technologies, 2017, 74: 113-125. doi: 10.1016/j.trc.2016.11.011 [15] LI Nan-xiang, MISU T, MIRANDA A. Driver behavior event detection for manual annotation by clustering of the driver physiological signals[C]//IEEE. 19th International Conference on Intelligent Transportation Systems. New York: IEEE, 2016: 2583-2588. [16] QI Ge-qi, DU Yi-man, WU Jian-ping, et al. What is the appropriate temporal distance range for driving style analysis?[J]. IEEE Transactions on Intelligent Transportation Systems, 2016, 17(5): 1393-1403. doi: 10.1109/TITS.2015.2502985 [17] 薛清文, 蒋愚明, 陆键. 基于轨迹数据的危险驾驶行为识别方法[J]. 中国公路学报, 2020, 33(6): 84-94. doi: 10.3969/j.issn.1001-7372.2020.06.008XUE Qing-wen, JIANG Yu-ming, LU Jian. Risky driving behavior recognition based on trajectory data[J]. China Journal of Highway and Transport, 2020, 33(6): 84-94. (in Chinese). doi: 10.3969/j.issn.1001-7372.2020.06.008 [18] XUE Qing-wen, WANG Ke, LU J J, et al. Rapid driving style recognition in car-following using machine learning and vehicle trajectory data[J]. Journal of Advanced Transportation, 2019, 2019: 1-11. [19] WANG Ke, XUE Qing-wen, XING Ying-ying, et al. Improve aggressive driver recognition using collision surrogate measurement and imbalanced class boosting[J]. International Journal of Environmental Research and Public Health, 2020, 17(7): 1-17. [20] 侯海晶, 金立生, 关志伟, 等. 驾驶风格对驾驶行为的影响[J]. 中国公路学报, 2018, 31(4): 18-27. doi: 10.3969/j.issn.1001-7372.2018.04.003HOU Hai-jing, JIN Li-sheng, GUAN Zhi-wei, et al. Effects of driving style on driver behavior[J]. China Journal of Highway Transportation, 2018, 31(4): 18-27. (in Chinese). doi: 10.3969/j.issn.1001-7372.2018.04.003 [21] DIAKOULAKI D, MAVROTAS G, PAPAYANNAKIS L. Determining objective weights in multiple criteria problems: the critic method[J]. Computers and Operations Research, 1995, 22(7): 763-770. doi: 10.1016/0305-0548(94)00059-H [22] LAURIKKALA J, JUHOLA M, KENTALA E. Informal identification of outliers in medical data[C]//ECCAI. Fifth International Workshop on Intelligent Data Analysis in Medicine and Pharmacology. Berlin: ECCAI, 2000: 1-5. [23] VASCONCELOS I, VASCONCELOS R O, OLIVIERI B, et al. Smartphone-based outlier detection: a complex event processing approach for driving behavior detection[J]. Journal of Internet Services and Applications, 2017, 8(13): 1-30. [24] KERNER B S, REHBORN H. Experimental properties of complexity in traffic flow[J]. Physical Review E, 1996, 53(5): 4275-4278. doi: 10.1103/PhysRevE.53.R4275 [25] KERNER B S. Three-phase traffic theory and highway capacity[J]. Physica A: Statistical Mechanics and its Applications, 2004, 333: 379-440. [26] BROWN T L, LEE J D, MCGEHEE D V. Human performance models and read-end collision avoidance algorithms[J]. Human Factors, 2001, 43(3): 462-482. doi: 10.1518/001872001775898250 [27] DAS S, MAURYA A K. Defining time-to-collision thresholds by the type of leading vehicle in non-lane-based traffic environment[J]. IEEE Transactions on Intelligent Transportation Systems, 2019, 21(12): 1-11. [28] BELLA F, RUSSO R. A collision warning system for rear-end collision: a driving simulator study[J]. Procedia Social Behavior Science, 2011, 20: 676-686. doi: 10.1016/j.sbspro.2011.08.075 [29] QU Xiao-bo, KUANG Yan, OH E, et al. Safety evaluation for expressway: a comparative study for macroscopic indicators[J]. Traffic Injury Prevention, 2014, 15(1): 89-93. doi: 10.1080/15389588.2013.782400 [30] MINDERHOUD M M, BOVY P H L. Extended time-to-collision measures for road traffic safety assessment[J]. Accident Analysis and Prevention, 2001, 33(1): 89-97. doi: 10.1016/S0001-4575(00)00019-1 -


 点击查看大图
计量
- 文章访问数: 1234
- HTML全文浏览量: 498
- PDF下载量: 497
- 被引次数: 0
