

Bus passenger classification method based on spatial and temporal behavior regularity mining
-
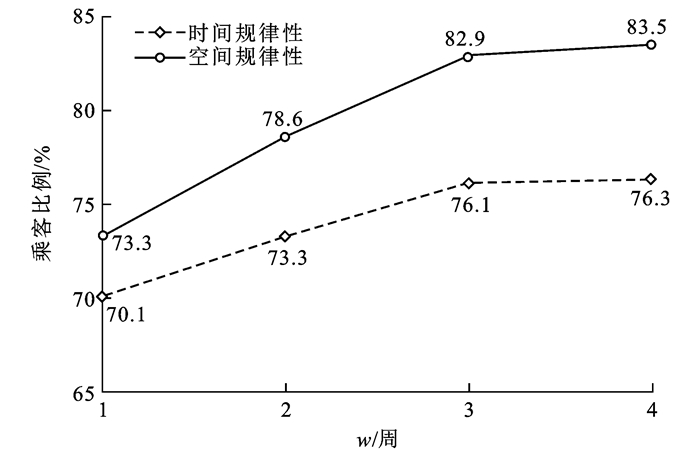
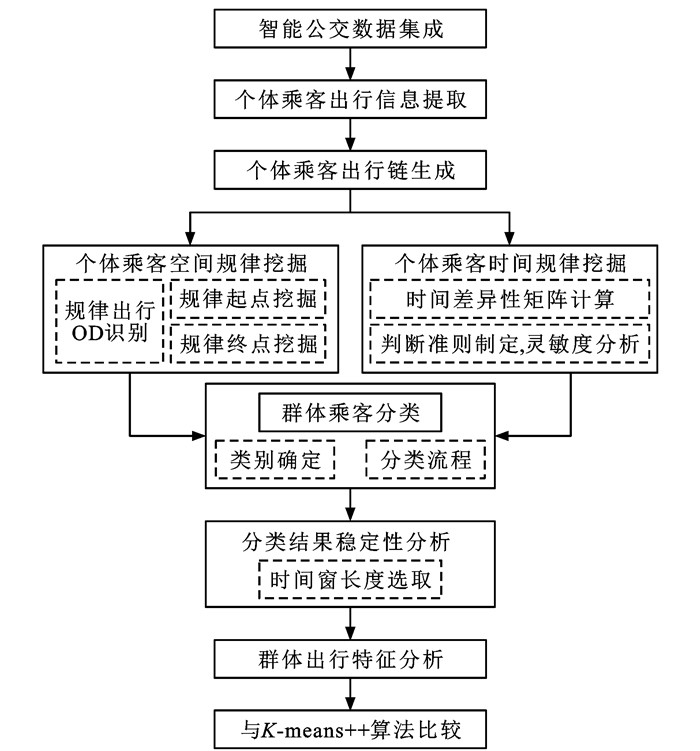
摘要: 应用智能公交系统(APTS)提取个体乘客出行信息,构造了公交出行链,研究了基于时空行为规律挖掘(STBRM)的公交乘客分类方法;应用时间序列表征乘客出行时间特征,利用互相关距离(CCD)算法计算了个体乘客出行时间规律;应用带噪声基于密度的空间聚类(DBSCAN)算法,挖掘了个体乘客的出行空间规律;依据出行强度和出行时空规律,将乘客划分为极少出行、时间规律、空间规律、时空规律和不规律等5个群体;以出行天数、类似上车时间数量和类似上车站点数量为聚类指标,应用K-Means++算法将乘客划分为高规律、中规律和低规律3类,比较了本文提出的STBRM方法和K-Means++聚类方法的分类结果,揭示了2种方法分类结果之间的关系。研究结果表明: 当时段划分长度取5 min,时间规律性判断阈值取3.0时,利用CCD算法识别时间模式规律乘客的效果最佳,与常用的DBSCAN算法相比,识别率提升了14.64%;增加时间窗长度能够提高时间、空间模式规律判定结果的稳定性;时间窗长度达到3周后,空间模式规律的乘客比例下降趋缓,达到6周后趋于稳定;时间窗长度达到2周后,时间模式规律的乘客比例增长趋缓,达到4周后趋于稳定;时间规律、空间规律和时空规律等3类乘客数量仅占总乘客数量的30.4%,但其出行量占到了总出行量的84.7%,公交依赖度很高,应作为公交机构重点保障的对象;本文提出的STBRM方法与K-Means++聚类方法的分类结果具有较强的关联性,规律性极高或极低的群体高度重合。Abstract: Using the advanced public transportation system (APTS) to extract individual passenger travel information, the bus trip-chain was constructed, and the method of bus passenger classification based on the spatial and temporal behavior regularity mining (STBRM) was examined. Time series were used to characterize the travel temporal characteristics of passengers, and the cross-correlation distance (CCD) algorithm was used to calculate the temporal regularity of individual passengers. The density-based spatial clustering of applications with noise (DBSCAN) algorithm was used to mine the travel spatial regularity of individual passengers. According to the travel intensity and spatial-temporal regularity, bus passengers were divided into five groups, including rare travel, regular time, regular space, regular space-time, and irregular. Taking the numbers of travel days, similar boarding times, and similar boarding bus stops as the clustering indexes, the K-means++ algorithm was applied to classify passengers into three categories, namely high regularity, medium regularity, and low regularity. The classification result of the proposed method was compared with the K-means++ clustering method, and the relationship between the two methods was revealed. Research results show that when the time division length is 5 min and the temporal regularity judgment threshold is 3.0, the CCD algorithm has the best identification effect of passengers with temporal shifted patterns. Compared with the DBSCAN algorithm, the recognition rate improves by 14.64%. Increasing the time window length can improve the stability of travel spatial and temporal regularity judgment. When the time window length reaches three weeks, the proportion of passengers in a spatial pattern decreases slowly and becomes stable after six weeks. When the time window length reaches two weeks, the proportion of passengers in a temporal pattern increases slowly and becomes stable after four weeks. The number of passengers for regular time, regular space, and regular space-time accounts for only 30.4% of the total number of passengers, but their number of trips accounts for 84.7% of the total number of trips, therefore, the bus dependence is very high, which should be taken as the key service object of public transport institutions. The classification results of the proposed method and K-means++ clustering method have a strong correlation, and the groups with very high or very low regularity for the two methods have a high degree of overlap. 13 tabs, 9 figs, 31 refs.
-

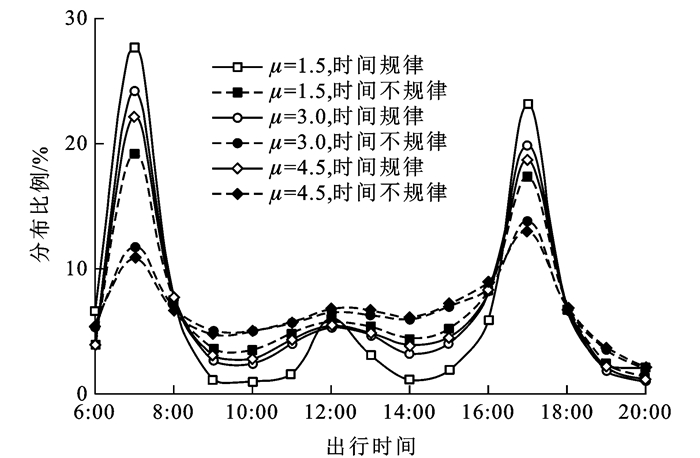
图 4 时间模式规律和不规律条件下乘客出行时间分布
Figure 4. Departure time distributions of temporal pattern regular and irregular passengers
表 1 出行OD数据
Table 1. Travel OD data
卡号 日期 出行时间 起点站 到达时间 终点站 线路 per00000*** 11-05 6:42 朝阳新盛十字 7:05 朝阳公园 4 per00000*** 11-05 9:18 朝阳公园 9:34 供电局 6 per00000*** 11-05 10:30 朝阳十字 10:54 火车站 3 per00000*** 11-05 17:47 火车站 18:52 正兴中学 12  下载: 导出CSV
表 2 各w的乘客出行空间规律
Table 2. Travel spatial regularity of passengers in each w
w/周 总出行量/人次 总人数 规律起点站 规律终点站 规律出行OD 空间模式规律 出行量/人次 比例/% 出行量/人次 比例/% 出行量/人次 比例/% 人数 比例/% 1(第4周) 76 474 10 651 50 885 66.5 40 761 53.3 30 666 40.1 5 347 50.2 2(第3~4周) 150 502 11 824 97 224 64.6 78 111 51.9 57 492 38.2 5 593 47.3 3(第2~4周) 215 709 12 146 123 170 57.1 104 403 48.4 73 125 33.9 4 445 36.6 4(第1~4周) 270 370 12 285 152 759 56.5 120 855 44.7 84 085 31.1 4 459 36.3 5(第1~5周) 331 370 12 762 184 573 55.7 150 442 45.4 108 027 32.6 4 587 35.9 6(第1~6周) 391 370 13 336 216 428 55.3 178 191 45.5 124 847 31.9 4 637 34.8 7(第1~7周) 449 700 13 803 246 885 54.9 202 635 45.1 142 555 31.7 4 831 35.0 8(第1~8周) 508 700 14 100 276 733 54.4 229 475 45.2 159 732 31.4 4 892 34.7
下载: 导出CSV
表 3 出行时间序列
Table 3. Travel time series
卡号 日期 6:00 6:05 6:10 6:15 6:20 6:25 per0000*** 11-05 0 0 0 0 1 0 per0000*** 11-06 0 0 0 0 0 1 per0000*** 11-07 0 0 0 0 0 1 per0000*** 11-08 0 0 0 0 0 1 per0000*** 11-09 0 0 0 0 0 0
下载: 导出CSV
表 4 时间序列差异性矩阵T1
Table 4. Time series difference matrix T1
出行时间序列 S1 S2 S3 S4 S5 S1 1.642 8.860 2.594 2.133 S2 3.222 3.228 4.052 1.709 S3 6.754 2.279 3.284 5.917 S4 2.511 1.573 3.284 2.780 S5 5.398 1.733 8.860 1.788
下载: 导出CSV
表 5 时间序列差异性均值矩阵T2
Table 5. Time series difference mean matrix T2
出行时间序列 S1 S2 S3 S4 S5 S1 S2 2.432 S3 7.807 2.753 S4 2.552 2.812 3.284 S5 3.765 1.721 7.3885 2.284
下载: 导出CSV
表 6 时间模式规律和不规律乘客的时间序列差异性
Table 6. Difference of time series between temporal pattern
w/周 μ 1.5 2.0 2.5 3.0 3.5 4.0 4.5 1(第4周) 0.011 0.020 0.010 0.023 0.018 0.019 0.018 2(第3~4周) 0.011 0.018 0.011 0.023 0.018 0.021 0.020 3(第2~4周) 0.008 0.017 0.011 0.023 0.016 0.020 0.019 4(第1~4周) 0.007 0.017 0.010 0.027 0.016 0.020 0.019 5(第1~5周) 0.006 0.016 0.009 0.027 0.016 0.019 0.019 6(第1~6周) 0.007 0.017 0.009 0.026 0.016 0.021 0.018 7(第1~7周) 0.006 0.017 0.009 0.025 0.016 0.019 0.019 8(第1~8周) 0.006 0.016 0.010 0.024 0.017 0.018 0.017
下载: 导出CSV
表 7 R值
Table 7. R values
t/min 3 4 5 6 7 8 9 10 R 2.170 2.151 2.116 2.166 2.188 2.184 2.219 2.236
下载: 导出CSV
表 8 各w的乘客出行时间规律
Table 8. Travel temporal regularity of passengers in each w
w/周 总出行量/人次 总人数 时间模式规律乘客 出行量/人次 比例/% 人数 比例/% 1(第4周) 76 474 10 651 43 841 57.3 6 401 60.1 2(第3~4周) 150 502 11 824 104 496 69.4 7 343 62.1 3(第2~4周) 215 709 12 146 156 862 72.7 7 691 63.3 4(第1~4周) 270 370 12 285 202 595 74.9 7 864 64.0 5(第1~5周) 331 370 12 762 251 437 75.9 8 207 64.3 6(第1~6周) 391 370 13 336 296 936 75.9 8 603 64.5 7(第1~7周) 449 700 13 803 346 680 77.1 8 932 64.7 8(第1~8周) 508 700 14 100 392 727 77.2 9 151 64.9
下载: 导出CSV
表 9 DBSCAN和CCD算法时间模式规律的乘客统计
Table 9. Statistics of temporal regular passengers calculated by DBSCAN and CCD algorithms
统计项目 2种算法均判定为规律 仅CCD算法判定为规律 仅DBSCAN算法判定为规律 DBSCAN算法判定为规律 CCD算法判定为规律 总人数 乘客量/人 5 886 1 805 27 5 913 7 691 12 146 比例/% 48.46 14.86 0.22 48.68 63.32 100
下载: 导出CSV
表 10 时空规律的乘客比例
Table 10. Passenger proportion of space-time regulation
w/周 试验组 对照组 时间窗 总人数 时空规律乘客量/人 比例/% 时间窗 总人数 时空规律乘客量/人 比例/% 1 第4周 10 651 4 110 38.6 第5周 11 615 4 188 36.1 2 第3~4周 11 824 4 673 39.5 第5~6周 12 992 4 858 37.4 3 第2~4周 12 146 4 090 33.7 第5~7周 13 468 4 310 32.0 4 第1~4周 12 285 4 096 33.3 第5~8周 13 724 4 521 32.9
下载: 导出CSV
表 11 STBRM方法分类结果
Table 11. Classification results of STBRM method
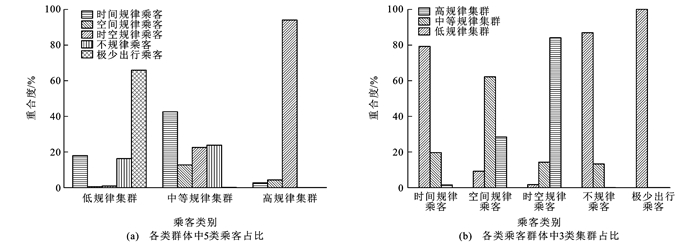
乘客类别 乘客占比/% 出行量占比/% 时间特征 空间特征 总体出行特征 极少出行乘客 55.8 7.4 出行时间随机 出行地点分散 公交依赖度极低 空间规律乘客 1.8 2.7 出行时间随机 出行地点集中 非通勤出行依赖公交 时间规律乘客 14.3 38.4 早晚高峰集中出行,无明显午高峰 出行地点分散,多为短距离出行 通勤及其他出行均依赖公交 时空规律乘客 14.3 43.6 早晚高峰集中出行,有明显午高峰 出行地点集中,多为短距离出行 通勤出行依赖公交 不规律乘客 13.8 7.9 出行时间随机 出行地点分散 公交依赖度较低
下载: 导出CSV
表 12 STBRM方法和K-Means++方法比较
Table 12. Comparison between STBRM method and K-Means++ method
方法 适用条件 优势 劣势 分类目的 STBRM方法 需要分组结构的先验知识 能有选择地确定乘客类别,易于理解乘客属性 先验规则具有主观性 获取特定乘客群体的出行需求,制定导向性服务 K-Means++方法 无需分组结构的先验知识 方法简单,算法效率高 识别的乘客群体难以理解 识别隐藏的乘客出行模式及偏好
下载: 导出CSV
表 13 K-Means++方法分类结果
Table 13. Classification results of K-Means++ method
乘客类别 乘客占比/% 出行量占比/% 时间特征 空间特征 总体出行特征 高规律集群 13.1 40.6 早晚高峰集中出行,有明显午高峰 绝大多数出行有固定起点,短距离出行集中 通勤出行依赖公交 中等规律集群 8.8 29.9 早晚高峰集中出行,无明显午高峰 多数出行有固定起点 通勤及其他出行依赖公交 低规律集群 78.1 29.5 出行时间随机 无出行空间规律 公交依赖度低
下载: 导出CSV
-
[1] KIEU L M, OU Yu-ming, CAI Chen. Large-scale transit market segmentation with spatial-behavioural features[J]. Transportation Research Part C, 2018, 90: 97-113. doi: 10.1016/j.trc.2018.03.003 [2] FAROQI H, MESBAH M, KIM J, et al. A model for measuring activity similarity between public transit passengers using smart card data[J]. Travel Behavior and Society, 2018, 13: 11-25. doi: 10.1016/j.tbs.2018.05.004 [3] 邹庆茹, 赵鹏, 姚向明. 基于售检票数据的城市轨道交通乘客分类[J]. 交通运输系统工程与信息, 2018, 18(1): 223-230. https://www.cnki.com.cn/Article/CJFDTOTAL-YSXT201801034.htmZOU Qing-ru, ZHAO Peng, YAO Xiang-ming. Passenger classification for urban rail transit by mining smart card data[J]. Journal of Transport Systems Engineering and Information Technology, 2018, 18(1): 223-230. (in Chinese) https://www.cnki.com.cn/Article/CJFDTOTAL-YSXT201801034.htm [4] SHAO Feng-jing, SUI Yi, YU Xiang, et al. Spatio-temporal travel patterns of elderly people—a comparative study based on buses usage in Qingdao, China[J]. Journal of Transport Geography, 2019, 76: 178-190. doi: 10.1016/j.jtrangeo.2019.04.001 [5] TEICHERT T, SHEHU E, WARTBURG I V. Customer segmentation revisited: the case of airline industry[J]. Transportation Research Part A, 2008, 42(1): 227-242. [6] WEN C H, LAI S C. Latent class models of international air carrier choice[J]. Transportation Research Part E, 2010, 46(2): 211-221. doi: 10.1016/j.tre.2009.08.004 [7] 钱丙益, 帅斌, 陈崇双, 等. 基于混合回归模型的客运专线旅客市场细分研究[J]. 铁道运输与经济, 2013, 36(1): 60-65. https://www.cnki.com.cn/Article/CJFDTOTAL-TDYS201401015.htmQIAN Bing-yi, SHUAI Bin, CHEN Chong-shuang, et al. Study on subdivision of DPL passenger market based on mixed regression model[J]. Railway Transport and Economy, 2013, 36(1): 60-65. (in Chinese) https://www.cnki.com.cn/Article/CJFDTOTAL-TDYS201401015.htm [8] PARK J Y, KIM D J, LIM Y. Use of smart card data to define public transit use in Seoul, South Korea[J]. Transportation Research Record, 2008(2063): 3-9. [9] PELLETIER M P, TRÉPANIER M, MORENCY C. Smart card data use in public transit: a literature review[J]. Transportation Research Part C: Emerging Technologies, 2011, 19: 557-568. doi: 10.1016/j.trc.2010.12.003 [10] CHEN C, MA Jing-tao, SUSILO Y, et al. The promises of big data and small data for travel behavior (aka human mobility) analysis[J]. Transportation Research Part C, 2016, 68: 285-299. doi: 10.1016/j.trc.2016.04.005 [11] LI Y T, IWAMOTO T, SCHMÖCKER J D, et al. Analyzing long-term travel behaviour: a comparison of smart card data and graphical usage patterns[J]. Transportation Research Procedia, 2018, 32: 34-43. doi: 10.1016/j.trpro.2018.10.005 [12] KUMAR P, KHANI A, HE Qing. A robust method for estimating transit passenger trajectories using automated data[J]. Transportation Research Part C: Emerging Technologies, 2018, 95: 731-747. doi: 10.1016/j.trc.2018.08.006 [13] ZHAO Zhan, KOUTSOPOULOS H N, ZHAO Jin-hua. Discovering latent activity patterns from transit smart card data: a spatiotemporal topic model[J]. Transportation Research Part C: Emerging Technologies, 2020, 116: 102627. doi: 10.1016/j.trc.2020.102627 [14] LONG Ying, LIU Xing-jian, ZHOU Jian-ping, et al. Early birds, night owls, and tireless/recurring itinerants: an exploratory analysis of extreme transit behaviors in Beijing, China[J]. Habitat International, 2016, 57: 223-232. doi: 10.1016/j.habitatint.2016.08.004 [15] 孙世超, 庄斌, 黄伟. 基于机器学习的公交卡数据中通勤人群辨识方法[J]. 交通工程, 2017, 17(1): 58-64. https://www.cnki.com.cn/Article/CJFDTOTAL-DLJA201701013.htmSUN Shi-chao, ZHUANG Bin, HUANG Wei. An approach to the identification of commuters based on machine learning of smart card data[J]. Journal of Transportation Engineering, 2017, 17(1): 58-64. (in Chinese) https://www.cnki.com.cn/Article/CJFDTOTAL-DLJA201701013.htm [16] 梁泉, 翁剑成, 林鹏飞, 等. 基于个体出行图谱的公共交通通勤行为辨别方法研究[J]. 交通运输系统工程与信息, 2018, 18(2): 100-107. https://www.cnki.com.cn/Article/CJFDTOTAL-YSXT201802016.htmLIANG Quan, WENG Jian-cheng, LIN Peng-fei, et al. Public transport commuter identification based on individual travel graph[J]. Journal of Transport Systems Engineering and Information Technology, 2018, 18(2): 100-107. (in Chinese) https://www.cnki.com.cn/Article/CJFDTOTAL-YSXT201802016.htm [17] OETRGA-TONG M A. Classification of London's public transport users using smart card data[D]. Cambridge: Massachusetts Institute of Technology, 2013. [18] LATHIA N, SMITH C, FROEHLICH J, et al. Individuals among commuters: building personalised transport information services from fare collection systems[J]. Pervasive Mobile Computing, 2013, 9(5): 643-664. doi: 10.1016/j.pmcj.2012.10.007 [19] YANG Chao, YAN Fen-fan, UKKUSURI S V. Unraveling traveler mobility patterns and predicting user behavior in the Shenzhen metro system[J]. Transportmetrica A: Transport Science, 2018, 14(7): 576-597. doi: 10.1080/23249935.2017.1412370 [20] BRIAND A S, CÔME E, TRÉPANIER M, et al. Analyzing year-to-year changes in public transport passenger behavior using smart card data[J]. Transportation Research Part C: Emerging Technologies, 2017, 79: 274-289. doi: 10.1016/j.trc.2017.03.021 [21] LI H, AGARD B, TRÉPANIER M. A classification of public transit users with smart card data based on time series distance metrics and a hierarchical clustering method[J]. Transportmetrica A: Transport Science, 2020, 16(1): 56-75. doi: 10.1080/23249935.2018.1479722 [22] MA Xiao-lei, WU Yao-jan, WANG Yin-hai, et al. Mining smart card data for transit riders' travel patterns[J]. Transport Research Part C: Emerging Technologies, 2013, 36: 1-12. doi: 10.1016/j.trc.2013.07.010 [23] KIEU L M, BHASKAR A, CHUNG E. Passenger segmentation using smart card data[J]. IEEE Transactions on Intelligent Transportation Systems, 2015, 16(3): 1537-1548. doi: 10.1109/TITS.2014.2368998 [24] MA Xiao-lei, LIU Cong-cong, WEN Hui-min, et al. Understanding commuting patterns using transit smart card data[J]. Journal of Transport Geography, 2017, 58: 135-145. doi: 10.1016/j.jtrangeo.2016.12.001 [25] AGARD B, MORENCY C, TRÉPANIER M. Mining public transport user behavior from smart card data[J]. IFAC Proceedings Volumes, 2006, 39(3): 399-404. [26] 陈修远. 基于出行特性的公交乘客分类研究[D]. 成都: 西南交通大学, 2017.CHEN Xiu-yuan. Analyzing classification of bus passengers based on their trip characteristics[D]. Chengdu: Southwest Jiaotong University, 2017. (in Chinese) [27] BASU A A. Data-driven customer segmentation and personalized information provision in public transit[D]. Cambridge: Massachusetts Institute of Technology, 2018. [28] MORI U, MENDIBURU A, LOZANO J A. Distance measures for time series in R: the TSdist package[J]. The R Journal, 2016, 8(2): 451-459. doi: 10.32614/RJ-2016-058 [29] ZHAO Jin-hua, RAHBEE A, WILSON N H M. Estimating a rail passenger trip origin-destination matrix using automatic data collection systems[J]. Computer-Aided Civil and Infrastructure Engineering, 2007(22): 376-387. [30] 陈君, 杨东援. 融合智能调度数据的公交IC卡乘客换乘站点判断方法[J]. 长安大学学报(自然科学版), 2013, 33(4): 96-102. https://www.cnki.com.cn/Article/CJFDTOTAL-XAGL201304015.htmCHEN Jun, YANG Dong-yuan. Method for identifying transfer stops of passengers with smart card integrating intelligent bus dispatching data[J]. Journal of Chang'an University (Natural Science Edition), 2013, 33(4): 96-102. (in Chinese) https://www.cnki.com.cn/Article/CJFDTOTAL-XAGL201304015.htm [31] 陈君, 杨东援. 基于APTS数据的公交卡乘客通勤OD分布估计方法[J]. 交通运输系统工程与信息, 2013, 13(4): 47-53. https://www.cnki.com.cn/Article/CJFDTOTAL-YSXT201304007.htmCHEN Jun, YANG Dong-yuan. Estimating smart card commuters origin-destination distribution based on ATPS data[J]. Journal of Transportation Systems Engineering and Information Technology, 2013, 13(4): 47-53. (in Chinese) https://www.cnki.com.cn/Article/CJFDTOTAL-YSXT201304007.htm -


 点击查看大图
计量
- 文章访问数: 756
- HTML全文浏览量: 171
- PDF下载量: 182
- 被引次数: 0
