2021 Vol. 21, No. 2

Review
Management review on transportation and vehicle engineering discipline of NSFC in 2020
WANG Zhi-zhong, ZHANG Peng
Abstract: Transportation and vehicle engineering became a new primary discipline (E12) of the National Natural Science Foundation of China in 2020. The application, acceptance, assessment, and funding of science foundation project in the first year of the discipline's inclusion were reviewed. The funding fields, secondary codes and their connotations were outlines, and the discipline planning, future development, and project layouts of key and above categories were introduced. The discipline management, including the promotion of achievement transformation and future adjustment of application codes, was also elaborated. In 2020, there were 1 241 funding applications for the discipline of transportation and transportation engineering, of which 1 231 were accepted. Only 0.8% of the applications were not accepted after the formal review. In 2020, 260 institutes applied for funds for transportation and vehicle engineering projects, out of which the three institutes with the highest numbers of applications were Tongji University, Chang'an University, and Southwest Jiaotong University. Overall, 23.9%, 26.5% and 21.2% of general programs, youth programs, and regional projects were reviewed by the panel, respectively. In total, 197 projects were funded, and 89.70 million yuan was released. There were 102, 81, and 10 general programs, youth programs, and regional projects, respectively, and their average direct funds were 580, 240, and 350 thousand yuan, respectively. In future, strategic research should be conducted on the following issues: research power distribution, key scientific issues, future trends, medium- and long-term developments, major bottlenecks concerning development of China in the field of transportation, and optimized reform of discipline codes. The results of this research should provide guidance for future developments and policy making. In future, code optimization and research direction adjustment should highlight the characteristics of transportation industry such that researchers can focus on the unique development characteristics of different transportation systems and scientific problems behind bottlenecks. In this way, achievement transformation can be accelerated and technical improvements in transportation can be encouraged, allowing China to become a great power in the field of transportation. 6 tabs, 3 refs.More>
2021, 21(2): 1-6. doi: 10.19818/j.cnki.1671-1637.2021.02.001
Overview of recognition and evaluation of driving characteristics and their applications in intelligent vehicles
GUO Lie, MA Yue, YUE Ming, QIN Zeng-ke
Abstract: The methods for the recognition of driving characteristics, the research progress on driver takeover ability, and the application of driving characteristics to the field of intelligent vehicles were studied. The driver condition monitoring was divided into driver fatigue, distraction, and bad driving behavior monitoring. The research targets, methods, accuracy, judgment standards, and advantages and disadvantages of driver condition monitoring were summarized. The differences in various detection signals in the driver fatigue monitoring method were compared and analyzed. The methods for driver intention identification and prediction based on the fuzzy recognition and hidden Markov models were discussed and evaluated. The main steps and features of typical identification methods for driving style classification and identification were summarized. The influencing factors and evaluation criteria for driver takeover ability were analyzed. The major ways that driving characteristics were used to develop assistant driving systems with high user acceptance and excellent human-machine interaction performance were expounded. The approach considering the driving characteristics in human-machine co-driving cooperative control was summarized. Analysis result shows that driver condition monitoring methods based on the multi-sensor signal fusion can effectively avoid the disadvantages of single sensor-based methods, and increase the detection accuracy, and decrease the false alarms. Combining traditional prediction models with hybrid intelligent learning is the main solution for the online recognition and prediction of driving intentions. The identification of driving characteristics under complex conditions is the primary research focus. The research on driver takeover ability needs to be theoretical and systematic. Developing an integrated assistant driving technology based on driving characteristics and realizing the interaction of intention and control strategy between the driver and the assistant driving system under typical road conditions is a future research trend. Considering the driving characteristics of personalized drivers in the design of co-driving coefficients helps to improve the personalization, intelligence level, and environmental adaptability of human-machine co-driving systems. 4 tabs, 5 figs, 82 refs.More>
2021, 21(2): 7-20. doi: 10.19818/j.cnki.1671-1637.2021.02.002
Research progress on test scenario of autonomous driving
WANG Run-min, ZHU Yu, ZHAO Xiang-mo, XU Zhi-gang, ZHOU Wen-shuai, LIU Tong
Abstract: Five existing definitions of autonomous driving test scenario were expounded, and the definitions of autonomous driving test scenario and related concepts were proposed by combining the logical relationships between test scenario, primitive scenario, and scenario elements. Three test scenario architectures of autonomous driving that are recognized in the industry were compared. From the perspective of scenario data sources, the current situation in the collection and research of traffic accident and naturalistic driving data at home and abroad was summarized. Based on the known data, expert data, test requirements, test objects, and technical characteristics of autonomous driving, the research results on the construction and automatic generation of unknown autonomous driving test scenarios were summarized. Research results show that the definition and architecture of autonomous driving test scenario are closely related to its construction and automatic generation. The autonomous driving scenario can be considered as an organic combination and comprehensive reflection of scenario elements, such as the driving environment, traffic participants, and driving behavior of autonomous vehicle. In addition to these elements, autonomous driving test scenarios should include a dynamic semantic description of initial state of the scenario, the situation of the scenario, and the impact and results at the end of the scenario. Although the existing test scenario architecture is relatively perfect, it is difficult to meet the requirements of different test objectives and test methods. Therefore, in the optimization of test scenario architecture, the design process of test scenario should be considered. However, the collection accuracy and effective characteristics of traffic accident data are not uniform, which makes it difficult to achieve the complete collection of naturalistic driving scenario data, and the collection specifications are not standardized. Therefore, the effectiveness of traffic accident and naturalistic driving data for the construction of autonomous driving test scenarios must be further demonstrated, and the autonomous driving test data are expected to become an important supplement. Improving scenario coverage and accelerating the testing process are important research goals in the construction of autonomous driving test scenarios. The in-depth application of artificial intelligence technology in the field of autonomous driving scenario generation is expected to meet complete or high coverage requirements of test scenarios. The classification of test scenarios for different levels of autonomous driving and the test scenario construction method for accelerated test of autonomous driving will be the next important research directions in test scenario construction for autonomous driving. 7 figs, 103 refs.More>
2021, 21(2): 21-37. doi: 10.19818/j.cnki.1671-1637.2021.02.003
Review on driving distraction
GE Hui-min, ZHENG Ming-qiang, LYU Neng-chao, LU Ying, SUN Hui
Abstract: An indicator system for evaluating the quality of literatures was established. Based on this system and considering driving behavior as the main focus of this research, 288 relevant papers were selected, and their data acquisition methods, indicator selections, detection methods, and research conclusions were comprehensively analyzed. Taking driving behavior as the main research object, a method of obtaining test data on driving distractions was systematically derived combined with statistical methods, and the reasons for the diversity and polarization in the obtained data were summarized. The research results of different driving distraction indicators were categorized, and the efficiency, advantages, and disadvantages of these indicators were summarized. The accuracies of different driving distraction detection models were compared, and the root causes of their differences were analyzed. Future research trends of driving distraction data acquisition methods, indicator selections, and detection methods were proposed. Analysis results show that experimental tests are the primary methods for obtaining driving distraction data. Natural driving datasets and video recordings have been proposed as new methods of data acquisition, data acquisition methods of roadside observations and surveys have received less attention. Comparison scenario, vehicle following scenario, overtaking scenario, lane changing scenario, and relatively more complex scenarios involving other dangerous events are the most extensively studied driving distraction scenarios. The setting of driving distraction sub-tasks indicates that current research on driving distraction has focused on several types and topics. Fusion indicators, generally including driving performance and eye movement indicator, and driving performance and reaction indicator, are the most frequently used in driving distraction. Driving performance is the most commonly used single indicator. Support vector machine model is the most commonly used driving distraction detection model, while the standard deviation of detection accuracy is large, and this model is also unstable. In contrast, the detection accuracy of a deep learning algorithm-based model is high, and its stability is good. Future research on driving distraction should balance research topics, expand distraction scenarios to human-machine co-driving, further investigate the types of driving distractions, construct a standardized indicator system and selection principles, and strengthen model construction to detect different types and determine the severity of driving distractions. 11 tabs, 1 fig, 96 refs.More>
2021, 21(2): 38-55. doi: 10.19818/j.cnki.1671-1637.2021.02.004
Road and railway engineering
Performance deterioration law of foam concrete in airport arresting system under seawater corrosion
ZENG Zhi-jun, XU Wen, XIE De-qing, MIAO Chang-wen
Abstract: To evaluate how an engineered material arresting system (EMAS) can be applied in island airports, the performance deterioration laws of foam concrete of the arresting system at high temperature, high humidity and high salinity were investigated. An integrated full (semi) immersion test device was designed, wherein the temperature, air flow, and water volume could be controlled automatically. The deterioration in the macroscopic performance, namely in terms of water absorption, deformation, crushing strength, and half crushing energy, of the foam concrete soaked in freshwater at 30 ℃, simulated seawater at 30 ℃ and 60 ℃, was analyzed separately. The microstructure of foam concrete was examined via X-ray tomography, and the changes in the phase type and content of foam concrete after the solution corrosion were analyzed via X-ray diffraction. Research result demonstrates that the foam concrete cannot satisfactorily resist the seawater corrosion. After the foam concrete is soaked in the freshwater at 30 ℃ for 90 d, the crushing strength decreases by 11.5%. After it is soaked in the simulated seawater at 30 ℃ and 60 ℃, the crushing strength drops by 19.9% and 52.1%, respectively. When it is fully immersed in the freshwater and simulated seawater at 30 ℃, the water absorption increases linearly with time and reaches approximately 280% at 90 d. When the foam concrete is soaked in the simulated seawater at 60 ℃, the water absorption increases rapidly and levels off at approximately 350% after 10 d. The internal porosity and average pore size of foam concrete are 70% and 2.0 mm, respectively. Moreover, the two-dimensional penetration depth is approximately 8.4 mm. Therefore, it is extremely easy for the foam concrete to undergo corrosion. In addition, the relatively large pores render the upward transportation of saltine water under the capillary action difficult, so the salt crystallization is not noted on the surface of foam concrete. The foam concrete is powdered seriously after several cycles of water absorption expansion and wind drying shrinkage. Solutions can reach the interior of the foam concrete, leading to reactions such as matrix softening, calcium dissolution, and ion corrosion, thereby accelerating the damage to the foam concrete's skeleton and lowering its crushing strength. In practical engineering projects, unit bodies of EMASs should not be struck by seawater and reef as far as possible. Furthermore, the unit body and foam concrete should be made waterproof such that the EMAS can last long and function effectively. 3 tabs, 14 figs, 33 refs.More>
2021, 21(2): 56-65. doi: 10.19818/j.cnki.1671-1637.2021.02.005
Dimensional inspection and evaluation method of highway prefabricated components based on 3D model reconstruction technology
SHI Xue-fei, XU Zi-qi, ZHU Rong, FU Qing-song
Abstract: To adapt the manufacturing dimensional inspection and evaluation of special-shaped concrete prefabricated components of highway engineering to the requirements of industrialized construction, the 3D model reconstruction technology was used to inspect and evaluate the dimensions of special-shaped concrete prefabricated components. A high-precision and automated method of the dimensional inspection and evaluation on special-shaped concrete prefabricated components was proposed, including three steps as 3D model reconstruction, point cloud data processing, and inspection and evaluation system. Principles and key links of point cloud model reconstruction technology based on the 3D photography were summarized. An algorithm of automatically eliminating irrelevant point clouds based on the coordinate transformation and bounding box was studied, and the effectiveness of this algorithm was validated using two case examples. The global point cloud registration and three local registration methods were studied. The detailed structures of components with different shapes and different positions were combined with engineering requirements for comparison. Considering the engineering requirements and the correspondence of registration method, three discriminant principles were proposed for the component dimensional inspection based on the color error nephogram and mathematical statistics method, including the discriminant principle based on mean and standard deviation of error, discriminant principle based on extreme value of error and comprehensive discrimination. The dimensions of a box culvert side wall and a pipe culvert side wall were inspected and evaluated by using these discriminant principles, based on comprehensive analysis of color error nephograms and error distributions. Research result shows that the three different discriminant principles are respectively suitable for the global, local, and global at first and then local inspections and evaluations of prefabricated components. Compared with the actual component, the average dimensional errors of length and width in the point cloud model of special-shaped concrete prefabricated component established by the 3D model reconstruction technology are about 1.5 mm. The 3D model reconstruction technology can replace the manual measurement method, can automatically eliminate irrelevant point clouds, and can facilitate a more stringent component dimensional inspection and evaluation meeting engineering requirements. 2 tabs, 16 figs, 31 refs.More>
2021, 21(2): 66-81. doi: 10.19818/j.cnki.1671-1637.2021.02.006
Shear strength and disintegration properties of polypropylene fiber-reinforced loess
LU Hao, YAN Chang-gen, JIA Zhuo-long, LAN Heng-xing, SHI Yu-ling, YANG Xiao-hua, ZHANG Zhi-quan
Abstract: To test the protective effect of polypropylene (PP) fiber-reinforced loess on slope surface, the influences of fiber content, fiber length and moisture content on the shear strength and disintegration properties of PP fiber-reinforced loess were evaluated. The optimal mixing ratio for the reinforced loess was obtained to conduct field slope surface protection tests. Research result shows that compared to unreinforced loess, the cohesion and internal friction angle of PP fiber-reinforced loess maximally increase by 113.8% and 23.3%, respectively, while the disintegration rate reduces by a maximum of 87.5%. Therefore, PP fiber can effectively improve the shear strength and disintegration resistance of loess. As the fiber's content and length increase, the cohesion of PP fiber-reinforced loess increases first and then decreases, and first increases sharply and then increases gradually, respectively. Meanwhile, the disintegration rate decreases first and then increases, and decreases continuously, respectively. For the shear strength, the optimal fiber content is 0.3%, and the optimum fiber length is 15 mm. For the disintegration properties, the optimal fiber content is 0.5%, and the optimum fiber length is 19 mm. In contrast, the relative difference in the disintegration rate between the two samples with different fiber contents and lengths is smaller than that in the shear strength. Hence, the optimal fiber content is 0.3%, while the optimum fiber length is 15 mm. Higher water content leads to lower cohesion, internal friction angle, and disintegration rate of PP fiber-reinforced loess, and the relationships between the water content and the three parameters conform to cubic polynomial or Logistic functions. Based on the field tests, the average erosion depth of the slope protected with PP fiber-reinforced loess is approximately 3 mm, indicating that the PP fiber-reinforced loess provides a significant slope surface protection. 3 tabs, 15 figs, 35 refs.More>
2021, 21(2): 82-92. doi: 10.19818/j.cnki.1671-1637.2021.02.007
Mechanism and control method of large deformation for large-span chlorite schist tunnel
CHEN Jian-xun, CHEN Li-jun, LUO Yan-bin, WANG Chuan-wu, LIU Wei-wei
Abstract: Based on the field test of deformations and stresses of supporting structures in the Lianchengshan Tunnel of Baoji-Hanzhong Expressway (double-hole six-lane), the characteristics and mechanism of large deformation disasters of large-span chlorite schist tunnels were analyzed, the comprehensive control method of large deformation disasters of the tunnel was summarized, the classification standard of large deformation of large-span chlorite schist tunnel was established, and the corresponding support parameters of each deformation grade were proposed. Analysis result shows that the large-span chlorite schist tunnel mainly has the settlement deformation during the tunnel excavation, which is mainly manifested as the overall settlement of the primary support. After the primary support is closed, the tunnel deformation is mainly manifested by the extrusion deformation of the side wall and the bottom heave of tunnel invert caused by the settlement of tunnel foot. The large deformation disasters are mainly as follows: the instability and collapse of tunnel face, primary support invasion and failure, the unsoldering and failure of feet-lock pipe, the cracking of secondary lining, the sinking of side wall, and the uplift and cracking of invert backfill. The chlorite schist is extremely weak and broken, and the invert base is softened by water, which are the fundamental causes of large deformation disaster of the tunnel. The large span of tunnel excavation (the maximum excavation span is 19.6 m), the flat tunnel section, and the lack of bearing capacity and effective restraint for arch foot foundation aggravate the deformation intrusion and instability failure of tunnel structure. The limited bearing capacity of primary support, causing loads to be continuously transmitted to the secondary lining, is the direct cause of the cracking of secondary lining. The deformation mechanism of surrounding rock can be summarized as the continuous downward slipping and loosening mechanism caused by the difficulty of the cohesion of arch rock mass in overcoming its own weight, and the plastic flow mechanism of soft rock caused by the low-strength stress ratio at the tunnel foot and invert. The large deformation disaster of the tunnel can be effectively avoided by adopting the comprehensive control method of "three-step core soil method+large reservation deformation+double-layer HK200b steel frame+large-diameter feet-lock pipe+radial grouting of surrounding rock+deepening tunnel invert", and managing the large deformation hierarchically at the same time. 5 tabs, 18 figs, 32 refs.More>
2021, 21(2): 93-106. doi: 10.19818/j.cnki.1671-1637.2021.02.008
Laser scanning-based rapid detection of deformation of shield tunnel section
LIU Xin-gen, CHEN Ying-ying, LIU Xue-zeng
Abstract: In view of existing technical problems such as low efficiency of manual detection, inaccurate positioning of deformation detection vehicle, difficulty in noise elimination and lag of data processing, a rapid automatic method to identify circumferential seams was proposed based on mathematical morphological characteristics of grayscale images of shield tunnel segment circumferential seams of and image sliding windows. The proposed method includes histogram equalization, scaling, and threshold determination. In addition, the tunnel mileage was reversely corrected according to the known positions of circumferential seams. Based on the ellipse curve fitting by the distance least square method, a three-fold iteration method for the automatic elimination of laser scanning noise in shield tunnels was established. The fitting ellipses for the single-ring laser scanning data of segment rings were subjected to the mean value processing. The results were compared with the tunnel design parameters or the last test results to identify the deformation along the tunnel section. A rapid detection vehicle to identify the deformation along the shield tunnel section was built by installing the 3D laser scanner, inclinometer, encoder, ranging wheel, computer, and other equipment. The supporting data acquisition and processing software were also developed, and the engineering experiment and practical application were conducted. Research result indicates that when the detection speed is 5 km·h-1, 98.41% and 96.21% of the absolute differences between repeat measurements of horizontal and vertical diameters of tunnel by the detection vehicle system are less than 2 mm, respectively. 82.36% and 71.92% of the absolute differences are less than 1 mm, respectively. The repeat measurements accuracy of the system is 2 mm, most of which can reach 1 mm. This shows that the circumferential seam identification, noise elimination, whole ring convergence deformation algorithm and detection system have high stability and reproducibility. The detection vehicle can automatically collect and process data. The test analysis report can be output 24 h after the detection. The results are accurate and reliable. They can provide references for the health evaluation and maintenance of shield tunnel structures. 2 tabs, 22 figs, 30 refs.More>
2021, 21(2): 107-116. doi: 10.19818/j.cnki.1671-1637.2021.02.009
Train passing analysis on large-span railway suspension bridge based on ANSYS-MATLAB co-simulation
ZHOU Zhi-hui, LIU Rui-tao, ZHU Zhi-hui, GONG Wei, YU Zhi-wu
Abstract: To study the driving dynamics of large-span railway suspension bridges with complex structures and significant geometric nonlinearity, a train-track-bridge coupled vibration analysis method was introduced based on the real-time interacting ANSYS-MATLAB co-simulation. The refined finite element models of suspension bridge and track structure were established in ANSYS. The mass, damping, and stiffness matrices of train were assembled in MATLAB according to the multi-rigid-body dynamics theory, and the dynamic differential equation coefficient matrices of track structure were exported to MATLAB. The dynamic differential equations of suspension bridge subsystem and track-train subsystem were established separately. Then, based on the multi-time-step strategy, the vibration responses of suspension bridge subsystem were calculated by considering the geometric stiffness of main cables and updating the stiffness matrices of structure in ANSYS with coarse time steps. The dynamic responses of track-train subsystem were calculated by considering the wheel-rail spatial contact relationship and applying track irregularities in MATLAB with fine time steps. The coupling solution between subsystems was realized via the real-time data exchange between ANSYS and MATLAB. The method was verified by analyzing the test data of a railway simply supported beam bridge with single span. The co-simulation method was applied to a 660 m-long railway suspension bridge to analyze the driving dynamics. Analysis result shows that the dynamic responses of bridge tend to increase and the driving safety and stability tend to deteriorate as the speed of train increases. The suspension bridge design can fulfil the safety requirements when the train speed does not exceed 180 km·h-1. Under the train dynamic loads, neglecting the geometric stiffness of suspension bridge results in an calculation error of 7.4% in the midspan vertical displacement. Considering the geometric stiffness without updating the bridge stiffness matrix leads to a calculation error less than 1% for the bridge and train responses. The results satisfy the required calculation accuracy. Therefore, the proposed co-simulation method can be used to analyze the driving dynamics of large-span flexible railway bridges. 4 tabs, 14 figs, 31 refs.More>
2021, 21(2): 117-128. doi: 10.19818/j.cnki.1671-1637.2021.02.010
Transportation vehicle engineering
Multi-objective control and optimization of active energy-regenerative suspension based on road recognition
LI Yi-nong, ZHU Zhe-wei, ZHENG Ling, HU Yi-ming
Abstract: For the problem that the vibration reduction performance and energy-regenerative characteristics of active suspension are less adaptable under different road classes, a nonlinear electromagnetic active suspension model was constructed. Considering the suspension sprung mass uncertainty during vehicle driving, an adaptive sliding mode controller of active suspension was proposed. An adaptive fuzzy neural network and the dynamics data of suspension under different roads were used to recognize road classes and determine the objective coefficient of the controller. Then, the coordination between safety and comfort of active suspension was realized. The energy-regeneration characteristics and switch control strategies of electromagnetic active suspension were studied. On this basis, the suspension dynamic performance and energy-regeneration characteristic were taken as the design objectives, and the contradictory relationships between the safety, comfort, and energy efficiency of electromagnetic active suspension were considered to comprehensively optimize the controller and suspension structure parameters through the multi-objective particle swarm optimization (MOPSO). The optimal solution was acquired from the Pareto solution set after the multi-objective optimization according to the fuzzy set theory. Research result reveals that the fuzzy neural network gives a maximum recognition error within 10% for various road classes when the nonlinear electromagnetic active suspension is employed. Thus, it meets the requirement of recognition accuracy. For C-class roads, the vibration acceleration of sprung mass of optimized active suspension reduces by 35.3% compared with the traditional passive suspension. The tire dynamic displacement increases by 7.7%, but it is still within 10%, ensuring safety. Compared with the original active suspension, the optimized suspension has 10.5% less sprung mass vibration acceleration and 1.7% higher energy-regeneration efficiency. The optimized adaptive sliding mode controller can better balance the energy-regeneration and vibration reduction characteristics of suspension. The established nonlinear electromagnetic active suspension model can realize the comprehensive optimization of safety, comfort, and energy efficiency of suspension system under different road classes. 5 tabs, 9 figs, 30 refs.More>
2021, 21(2): 129-137. doi: 10.19818/j.cnki.1671-1637.2021.02.011
Load-sharing characteristics of water-lubricated rubber elastic supported tilting-pad thrust bearing for rim-driven thrusters
NING Chang-xiong, YAN Xin-ping, OUYANG Wu
Abstract: To study the load-sharing characteristics of water-lubricated thrust bearings supported by rubber pads for rim-driven thrusters (RDT), a test method for the load-sharing characteristics of thrust bearings was proposed. On a multifunctional vertical water-lubricated test rig, water-lubricated thrust bearings supported by rubber pads for RDT with an inner diameter of 124 mm and an outer diameter of 196 mm were used as test objects. A section of the bearing average radius was selected on the disk surface, where the miniature pressure and temperature sensors were symmetrically arranged rotated with the shaft. The full pad water film pressure distribution and thrust disk temperature were obtained by using the wireless telemetry technology. By presetting the pad height difference and the thrust disk static tilt to simulate the situation of eccentric load, the influence rules of load and speed changes on the water film pressure distribution, friction coefficient, and thrust disk temperature were studied. Research result shows that the load sharing effect of elastic support changes with the change of working conditions. When the rotation speed is constant, the increase of load increases the deformation of rubber pads of each pad, thereby enhancing the effect of load sharing. The tilt degree of thrust disk increases with an increase of the rotation speed, which exacerbates the uneven load of pad. In the design of load sharing of a rubber elastic supported tilting pad structure for RDT, not only the manufacturing and installation factors of uneven thrust disk and pad, but also the speed and load of bearing should be considered. According to the relationship between the pressure distributions of each bearing pad and the working condition, the bearing's contact load ratio increases when the rotation speed is 100 r·min-1 and the load is 0.35 MPa. Therefore, the water film pressure test provides a new way to distinguish the bearing lubrication state. 1 tab, 16 figs, 31 refs.More>
2021, 21(2): 138-149. doi: 10.19818/j.cnki.1671-1637.2021.02.012
Analysis of factors affecting vehicle driving condition based on road test in Chongqing
WU Sheng-li, XING Wen-ting, SHAO Yi-ming, JIAN Xiao-chun, ZHAO Shu-en
Abstract: The vehicle road test method was used, and the vehicle driving status data were collected through the VBOX, an exhaust gas collection system, and a gyroscope. Based on the method of projection pursuit dynamic clustering, combined with the NSGA-Ⅱ method with an elite control strategy, different parameter indexes were processed, and the influence degrees of parameters on automotive fuel economy and emission characteristics were quantitatively analyzed. The change rules of influencing characteristics of different parameters under specific working conditions were studied. Research result shows that in all driving conditions, the weight of the impact of acceleration on the fuel economy is 65.52%, the weight of the impact on the VSP characteristic is 35.03%, and the impact weight of the turning radius on the VSP characteristic is 37.86%. When the vehicle speed is less than 10 km·h-1, the turning radius has the greatest impact on the fuel economy, and its impact weight is 80.74%. The acceleration has the greatest impact on the VSP characteristic, and its impact weight is 82.82%. When the vehicle speed is 10-40 km·h-1, the acceleration has the greatest impact on the fuel economy and VSP characteristic, and its impact weights are 34.01% and 48.59%, respectively. When the vehicle speed is greater than 40 km·h-1, the slope has the greatest impact on the fuel economy, and its impact weight is 75.59%. Vehicle speed has the greatest impact on the VSP characteristic, with an impact weight of 80.17%. When the vehicle is in a downhill condition, the weight of the slope's impact on the fuel economy is 69.84%, and the weight of the speed's impact on the VSP characteristic is 56.37%. When the vehicle is in an uphill condition, the impact weights of acceleration on the fuel economy and VSP characteristic are 54.62% and 94.24%, respectively. A quantitative analysis of the impact weights of different factors on fuel economy and VSP characteristic not only provides practical support for improving them, but also provides an important theoretical basis for intelligent vehicle control algorithms. 11 figs, 31 refs.More>
2021, 21(2): 150-158. doi: 10.19818/j.cnki.1671-1637.2021.02.013
Transportation planning and management
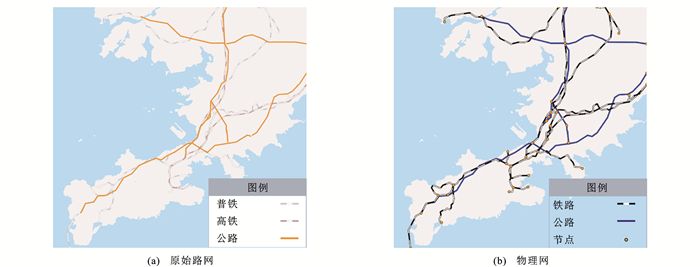
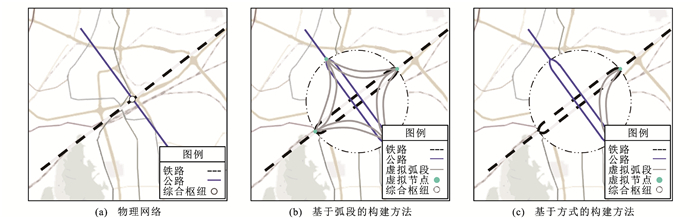
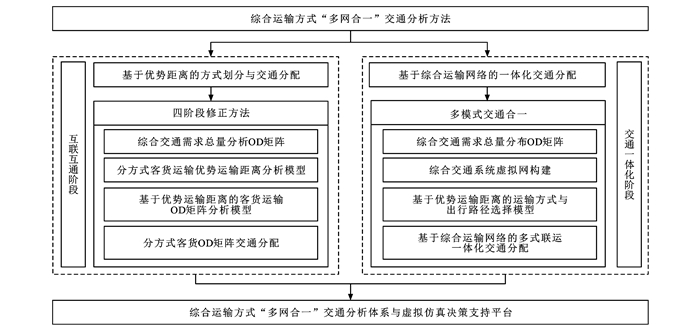
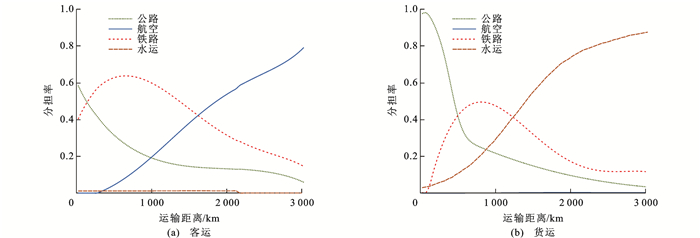
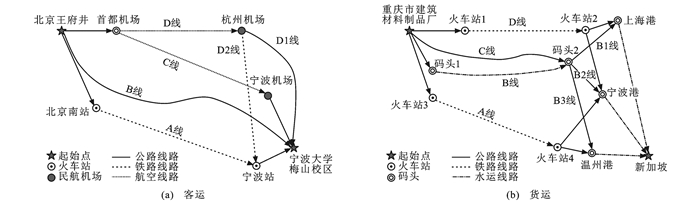
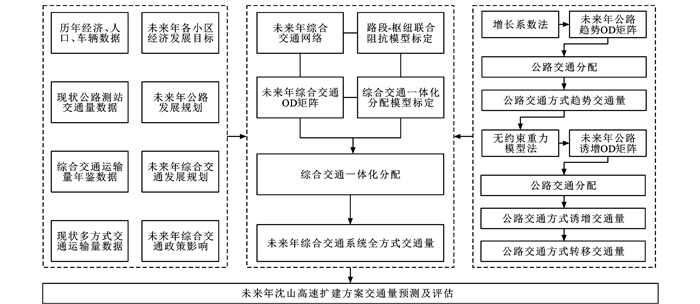
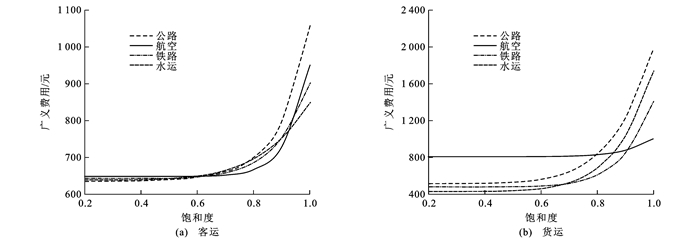
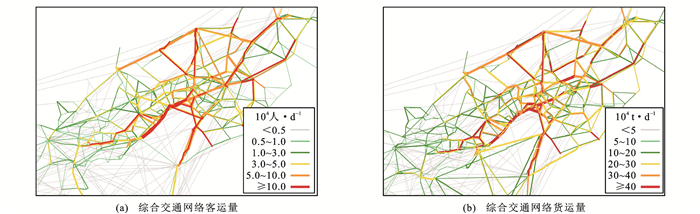
Multi-network integrated traffic analysis model and algorithm of comprehensive transportation system
WANG Wei, HUA Xue-dong, ZHENG Yong-tao
Abstract: To solve the problem of fragmentation in comprehensive transportation system, the technical bottlenecks in the integration of comprehensive transportation system were addressed. The topological models of multi-network integration consisting of the physical and virtual networks with comprehensive transportation hubs at their core, and considering railways, highways, waterways, airlines, pipelines, and urban roads, were proposed. Traffic impedance function model and advantage transport distance model serving each traffic mode and quantifying the results were constructed. Integrated traffic assignment model and algorithm under the condition of heterogeneous network traffic distribution were developed, and a analysis method of traffic volume for passenger combined travel and freight multimodal transport in integrated transport system was proposed. The traffic analysis model and technical system to serve the integrated development of comprehensive transportation system were built. TranStar (Comprehensive Transportation Version), an independently developed software, was implemented to build a virtual simulation platform for the comprehensive transportation system, enabling the rapid responses of large-scale comprehensive transport network's planning, construction, operation, and management to be realized. The feasibility of the models and algorithms were also verified. Research result shows that compared with the traditional analysis methods, the proposed traffic analysis model and algorithm satisfy the diverse analytical demands of a comprehensive transportation system under the condition of multi-network integration. The traffic flow of a comprehensive transportation network is verified by the proposed traffic analysis model and algorithm. The relative error is less than 3%, and the average error is less than 2%. The analysis result is of high precision and meets the requirements of engineering practice. 5 tabs, 10 figs, 31 refs.More>
2021, 21(2): 159-172. doi: 10.19818/j.cnki.1671-1637.2021.02.014
Optimization of operation scheme for full-length and short-turn routings considering operation proportion
XU De-jie, MAO Bao-hua, CHEN Shao-kuan, GONG Liang, ZENG Jun-wei
Abstract: Train operation proportion of full-length and short-turn routings in urban rail transit systems was analyzed and divided into two typical categories. Based on the preferences for choosing through train and transfer behaviors of cross-routing passengers, a generalized passenger fare calculation method of these two categories was proposed. The number of physical trains necessary for the operation was calculated while considering the matching relationship of train intervals. With the goal of minimizing passenger travel expenses and enterprise operating expenses, an optimization operation scheme model of hybrid formation on full-length and short-turn routings was established. In addition, based on the schedule process and model characteristics of operation scheme, the optimization and genetic algorithms for operating times were designed to solve the model. Taking Shanghai Metro Line 8 as an example, the division of time periods for all-day train operation and the optimal operational plan were studied. The optimal scheme and its operational indicators under single- and combined-routing operation modes were analyzed with considering the combined full-length and short-turn routings operations with uniform or hybrid formations. The influence of passenger preferences and time values on operation schemes and reversing stations in short-turn routing was studied. Research results show that the passenger waiting time under the full-length and short-turn routings operation mode increases by more than 11% compared with the single-routing operation mode. With uniform formation, the length of short-turn routing with a 1:1 operation ratio is four sections longer than that with a 2:1 operation ratio. The total system cost of hybrid formation in the morning rush time decreases by more than 1.87%, which has more advantages than uniform formation. The influence of passenger preferences for through train is greater on hybrid formation than uniform formation. When the preference probability is greater than 0.3, the positions of reversing stations of short-turn routing under hybrid formation are extended. When the time value increases to 1.8 times or more of its original value, the operation mode of hybrid formation changes from full-length and short-turn routings to a single routing. 7 tabs, 9 figs, 30 refs.More>
2021, 21(2): 173-186. doi: 10.19818/j.cnki.1671-1637.2021.02.015
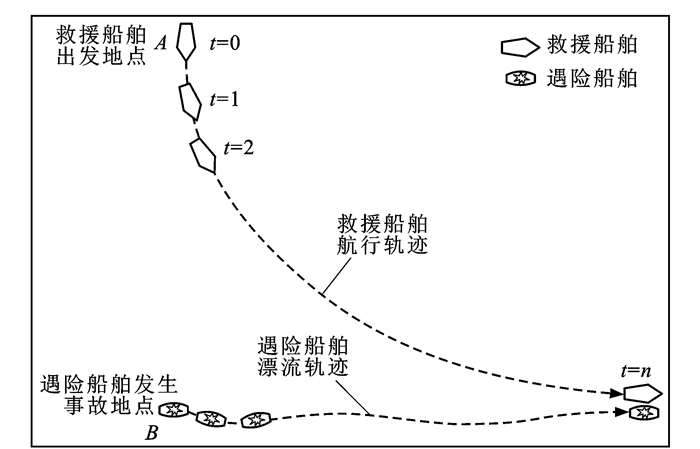
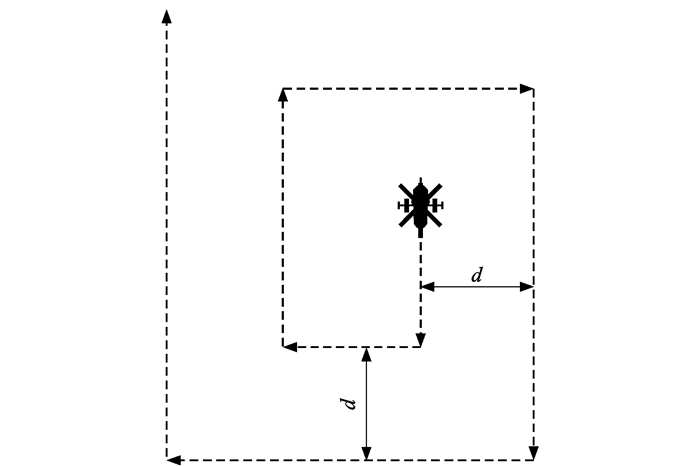
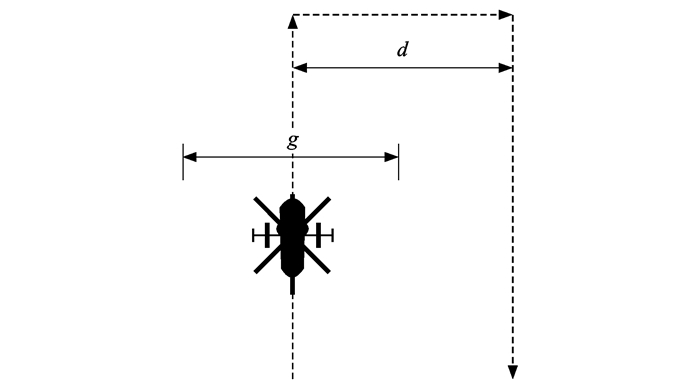
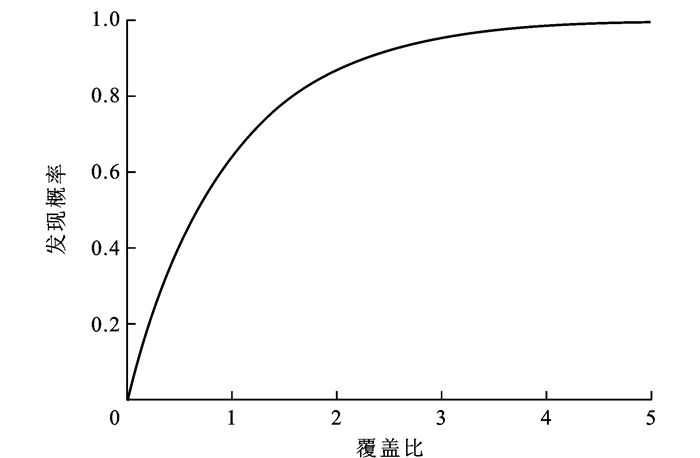
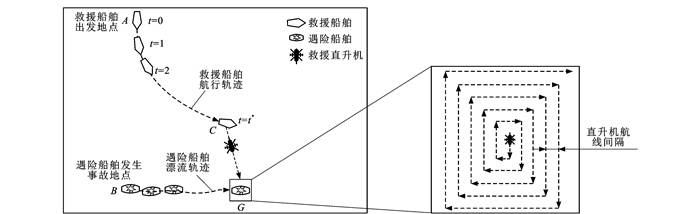
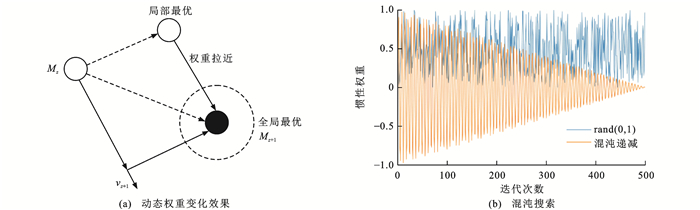
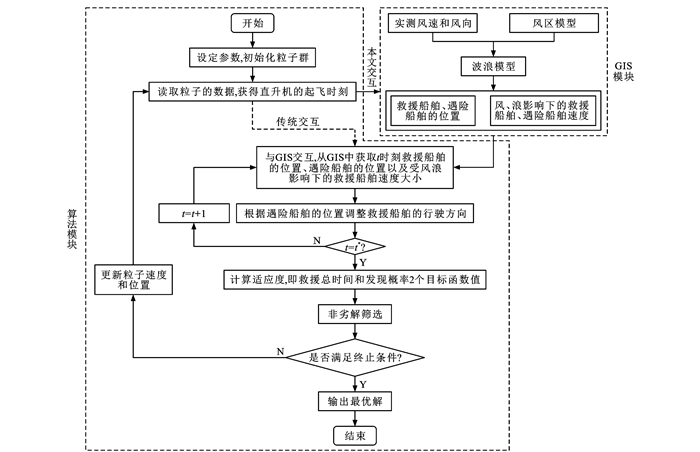
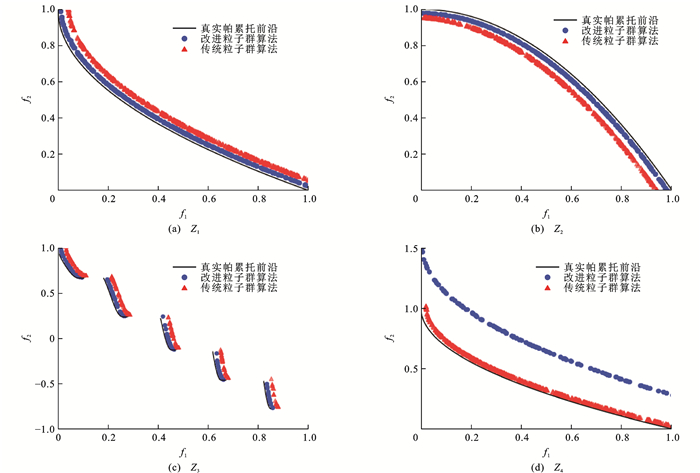
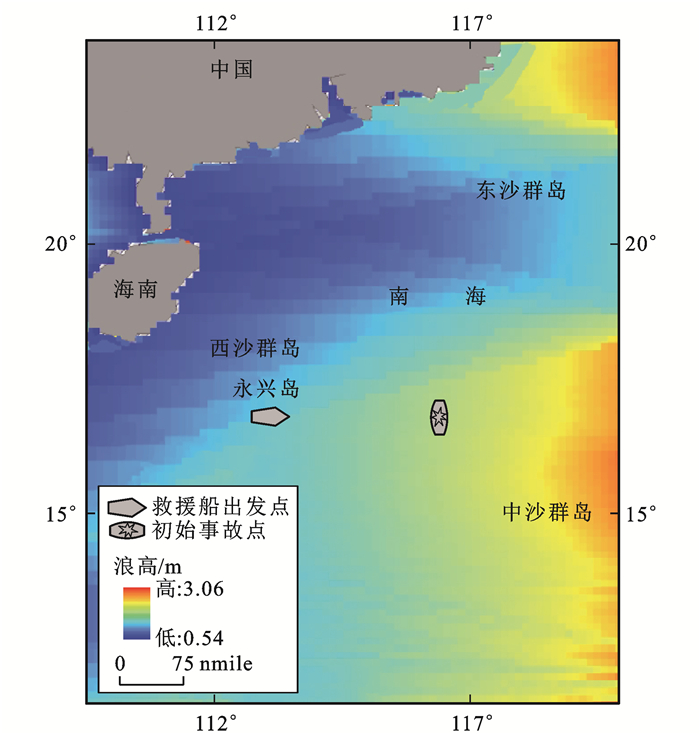
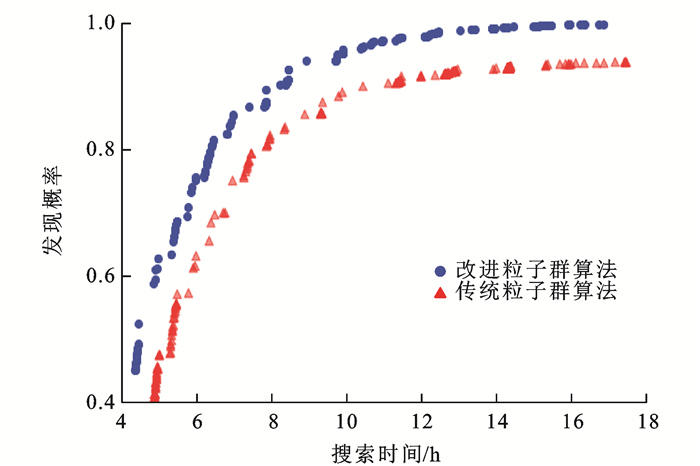
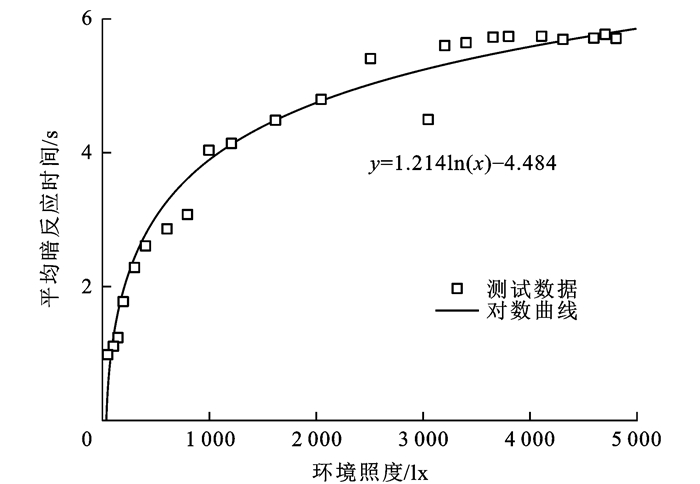
Associated searching and rescuing optimization of salvage vessels and helicopters in remote sea area
LIN Wan-ni, WANG Nuo, GAO Zhong-yin, WU Di
Abstract: A bi-objective optimization model of air-sea associated searching and rescuing (SAR) was built, which took the time when the helicopter took off from the salvage vessel and the search plan of helicopter as optimization content, and aimed to minimize the SAR time and maximize the probability of discovery. An improved algorithm was designed based on a the geographic information system (GIS) and intelligent algorithms. The GIS was used to calculate the statuses of salvage vessels and vessels in distress under the influence of wind and wave factors in view of the changeable marine environment. The self-adaptive chaos search was used instead of random search to improve the particle swarm optimization algorithm. An example of the salvage vessel carrying a helicopter from Yongxing Island in the South China Sea to a remote sea area was used to verify the optimization model. Research results show that the total SAR time required for the SAR plan using GIS and intelligence algorithms is 4.4-16.9 h and the discovery probability is 45.12%-99.76%. Compared with the traditional particle swarm algorithm, the total SAR time of the improved particle swarm algorithm reduces by 1.5, 1.3, and 1.1 h, with a decrease rate of 18.07%, 14.28%, and 10.57% when the probability of discovery is 85.00%, 90.00%, and 95.00%, respectively. The improved algorithm shows better effect on calculation speed, calculation stability, and optimization result. The optimization of air-sea associated SAR is different from the traditional multi-objective routing optimization problem, and a new model that combines the improved algorithm is needed. To improve the efficiency of SAR in remote sea areas, it is suggested to further develop the optimization method used for air-sea associated SAR for different types of salvage vessels and helicopters. 6 tabs, 10 figs, 32 refs.More>
2021, 21(2): 187-199. doi: 10.19818/j.cnki.1671-1637.2021.02.016
Influence of tunnel group light-dark conversion on dark reaction time
CUI Hong-jun, WANG Yu-bo, ZHU Min-qing, LI Xia
Abstract: The dark reaction time of 42 subjects with light-dark conversion times was measured in the designed darkroom, and the variations of dark reaction time of drivers under the influencing factors such as light-dark conversion times, tunnel type, and connecting-section type were researched. Dark reaction time of drivers with various influencing factors was analyzed by using the generalized linear and linear mixed models through repeated measurements. The interactive effects of light-dark conversion times, tunnel type, and connecting-section type on dark reaction timed of drivers were studied based on the influences of tunnel and connecting-section types on the variation rate of dark reaction time of drivers. A linear mixed model of light-dark conversion times, tunnel type, and connecting-section type was established. Analysis results show that dark reaction time of drivers decreases significantly with the increase of light-dark conversion times, reaches the minimum value and tends to become stable after three light-dark conversions. Light-dark conversion times, tunnel type, and connecting-section type have significant interactive effect on dark reaction time of drivers. As the number of light-dark conversion increases, tunnel length and connecting section are positively and negatively correlated with the reduction rate of dark reaction time, respectively. The more the light-dark conversion times and shorter connecting section length, the higher the error rate of driver recognition in darkness. The more the light-dark conversion times, shorter connecting section length, and longer tunnel length, the shorter the dark reaction time of drivers, which is more conducive to traffic safety. However, frequent light-dark conversion and extremely short connecting section reduce the driver cumulative recognition accuracy in darkness, which poses a safety hazard. 6 tabs, 5 figs, 31 refs.More>
2021, 21(2): 200-208. doi: 10.19818/j.cnki.1671-1637.2021.02.017
Traffic information engineering and control
Structural equation model of drivers' takeover behaviors in autonomous driving environment
YAO Rong-han, QI Wen-yan, GUO Wei-wei
Abstract: Tests were conducted to explore the key factors that influence drivers' takeover behaviors in an autonomous driving environment using a driving simulator and an eye movement instrument. Data were collected from 11 participants who responded to 5 takeover scenarios, including vehicle and eye movement data, and the participants' personal attributes were investigated. According to the results of measured data processed by qualitative analysis and situational difference processed by quantitative analysis, a structural equation model was established using AMOS to describe drivers' takeover behaviors. The longitudinal takeover behavior, lateral takeover behavior, and eye movement behavior were the three potential variables. Nine observed variables were identified to represent the three potential variables. Based on the modification indices, the final structural equation model was obtained using multiple amendments. Thus, the relationships between all the variables and the corresponding parameters were obtained to describe the drivers' takeover behaviors. Research results show that the entire process in which a driver takes over an autonomous driving vehicle can be divided into 5 stages, including perception and reaction, deceleration and avoidance, acceleration and ascending, stable recovery, and stable movement. The drivers' takeover risk is higher when a left-front vehicle merges into the current lane. The lateral driving behavior is negatively correlated with the longitudinal driving or eye movement behavior, with correlation coefficients of -0.226 and -0.223, respectively. The longitudinal driving behavior is positively correlated with the eye movement behavior, with a correlation coefficient of 0.152. Average speed, mean of the overall yaw angle, and saccade time in a second can interpret the potential longitudinal, lateral, and eye behaviors, respectively, when drivers takeover autonomous driving vehicles. Therefore, the research can reveal drivers' overall and local behaviors when they takeover autonomous driving vehicles, and can help improve the human-computer interaction mode and takeover request hints in autonomous driving. 10 tabs, 7 figs, 30 refs.More>
2021, 21(2): 209-221. doi: 10.19818/j.cnki.1671-1637.2021.02.018
Road vehicle detection method based on improved YOLO v3 model and deep-SORT algorithm
MA Yong-jie, MA Yun-ting, CHENG Shi-sheng, MA Yi-de
Abstract: A vehicle detection method based on the improved YOLO v3 model and deep-SORT algorithm was proposed to address the problems of serious occlusion and high misdetection rate of small target vehicles in the real-time detection of road vehicles. To improve the detection ability of the model for road vehicle, the K-means++ clustering algorithm was used to cluster the target candidate boxes, the appropriate number of anchor boxes was selected, and a feature extraction layer to the shallow layer of the network was added to extract more refined vehicle features. The robustness of the network for different distant targets was enhanced by retaining the original YOLO v3 model's output layer but adding another layer to it. After the 52 pixel×52 pixel output feature map was upsampled, a 104 pixel×104 pixel feature map was obtained, which was spliced with a shallow layer feature map of the same size to achieve the vehicle target detection. To reduce the influence of target occlusion on the detection and improve the attention to the association information between the upper and lower frames of the video, the YOLO v3 model was improved and combined with the deep-SORT algorithm to compensate for their shortcomings. Experimental results show that the improved YOLO v3 model can enhance the vehicle detection performance. Compared with the model adding feature extraction layer in the shallow layer of the network, the average accuracy improves by 1.4%, and compared with the model adding one output layer, the average accuracy improves by 0.8%. It indicates that the improved YOLO v3 model has a stronger feature expression ability and enhances the network's ability to detect small targets. After the deep-SORT algorithm is introduced into the improved YOLO v3 model, the precision and recall are 90.16% and 91.34%, respectively. Compared with the improved YOLO v3 model, the precision and recall increase by 1.48% and 4.20%, respectively. At the same time, the detection speed is maintained, and the detection of different-sized targets is highly robust. 4 tabs, 5 figs, 32 refs.More>
2021, 21(2): 222-231. doi: 10.19818/j.cnki.1671-1637.2021.02.019
Lane changing trajectory planning of intelligent vehicle based on multiple objective optimization
ZHAO Shu-en, WANG Jin-xiang, LI Yu-ling
Abstract: To improve the anthropomorphism and real-time performance of lane changing trajectory planning for intelligent vehicles, a lane changing trajectory planning algorithm based on the multi-objective collaborative optimization of safety, comfort, and energy saving was proposed. The adaptation of proposed trajectory planning method depended on the constraints of key variables such as lane changing time, longitudinal and lateral velocities, and accelerations. Based on the theory of vehicle kinematics and dynamics, the safe area of vehicle lane changing in dynamic unknown environments was analyzed, and the ideal lane-changing trajectory model of a sixth-degree polynomial was established. A genetic algorithm-back propagation neural network was used to predict the end time and target position of lane changing, and lane changing trajectory clusters in complex scenes were obtained. The performance evaluation functions of safety, comfort, and economy of vehicle lane changing based on feasible solution space were analyzed, and the objective function and constraint conditions of multi-objective collaborative optimization were constructed. The whale optimization algorithm was used to optimize the lane changing trajectory clusters to achieve an optimal lane changing trajectory planning of intelligent vehicles with multi-performance objectives. To further verify the accuracy of the multi-objective optimization trajectory planning algorithm, an L3-level intelligent vehicle test platform was used to test the algorithm for intelligent vehicles in structured road scenes. Simulation and experimental results show that the proposed algorithm can successfully achieve smooth and safe lane changing under various constraints. Compared with traditional lane changing of driver, the safety, comfort, and multi-objective comprehensive performance of the method are improved by 5.1%, 3.3%, and 1.7%, respectively, which effectively improves the personification of intelligent vehicle lane-changing trajectory planning in dynamic environments. 2 tabs, 11 figs, 30 refs.More>
2021, 21(2): 232-242. doi: 10.19818/j.cnki.1671-1637.2021.02.020
RSSI positioning method of vehicles in tunnels based on semi-supervised extreme learning machine
LIN Yong-jie, HUANG Zi-lin, WU Pan, XU Lun-hui
Abstract: To improve the identification efficiency of highway tunnel emergencies and to realize the full-time monitoring of road traffic conditions, the problem of positioning connected automated vehicles based on the received signal strength indicator (RSSI) was studied based on a ubiquitous wireless sensor network on an intelligent road. Considering the continuous motion characteristics of vehicles in a tunnel, a semi-supervised extreme learning machine (SSELM) with a locally linear embedding (LLE) algorithm was proposed to achieve the RSSI fingerprint positioning. In the offline phase, the dimension reductions for a few RSSI sample datasets with their vehicle positions marked and for a mass of unmarked ones were conducted by using the LLE, and the low-dimensional manifolds corresponding to their high-dimensional data, which represented the target's location information, were recognized. The mapping relationship between the RSSI data and vehicle positions was fitted based on the SSELM. In the online phase, real-time collected RSSI data after manifold dimensionality reduction were put into the calibrated SSELM to estimate the positions of vehicles. The estimated position was smoothed using an unscented Kalman filter (UKF). Analysis result shows that compared with the existing semi-supervised learning algorithms, the proposed method can achieve better positioning performance regardless of the vehicle travel speed and deployed distances. Under a change in key variables, such as the proportion of marked data (reduced by 50%-90%), number of unmarked data (0-1 000), and deployed sensor distance (10-25 m), the proposed method still has the best positioning performance with a minimum average error of 3.09 m. In terms of computational complexity, when the marked data comprise 30% of the dataset (only 96 reference points), the average positioning error is 3.8 m and the training time reduces to 8.7 s. Therefore, the proposed SSELM with LLE algorithm can provide promising positioning performance for vehicles with different driving speeds in an environment with sparsely or densely deployed sensors. In addition, it has a shorter training time and lower dependence on sample size, which makes it an effective method for the auxiliary positioning of connected automated vehicles in tunnels. 2 tabs, 11 figs, 34 refs.More>
2021, 21(2): 243-255. doi: 10.19818/j.cnki.1671-1637.2021.02.021
Two-stage UWB positioning algorithm of intelligent vehicle
ZHU Bing, TAO Xiao-wen, ZHAO Jian, KE Min, WANG Zhi-wei, LI Xin
Abstract: To improve the driving reliability of intelligent vehicles, taking the ultra-wide band (UWB) as the research object, the two-stage UWB positioning algorithm for intelligent vehicles was studied. The basic principles and error sources of intelligent vehicle's UWB positioning algorithm were analyzed. A two-stage UWB positioning algorithm was established to filter the ranging values and calculate the weighted positions. In the filtering stage of ranging values, small probabilities and large interference events were eliminated through the Gaussian filtering. In the calculation stage of weighted positions, the final position coordinates were obtained by weighting the position coordinates of multiple ranging points to effectively reduce the errors caused by non-line-of-sight and multipath effects. The errors of multipath effects were effectively reduced by using the anti-multipath antennas, and the static and motion compensation strategies were established to effectively reduce the errors caused by hardware problems, such as the crystal deviation of the device. A simulation environment for UWB random ranging values under certain range variance constraints was built by using the MATLAB/Simulink simulation platform. The algorithm was simulated and compared with the trilateral positioning algorithm and the trilateral centroid positioning algorithm, and the impact of the number of base stations on positioning precision was analyzed. A physical UWB test system was built, the positioning precision of UWB equipment was evaluated, and the error compensation was performed. The two-stage UWB positioning algorithm was tested on a real vehicle. Simulation result shows that the mean values of positioning errors in the east and north directions can be as small as 0.382 3 and 0.447 0 m, respectively. The compensated UWB positioning trajectory is closer to the trajectory shown by RT3002. The average values of the east and north trajectory errors are 0.049 2 and 0.017 8 m, and the root mean square errors are 0.069 8 and 0.026 4 m, respectively. Thus, the proposed two-stage UWB positioning algorithm can meet the positioning requirements of intelligent vehicles, and has the advantages of high precision, low cost, and good stability. 2 tabs, 20 figs, 32 refs.More>
2021, 21(2): 256-266. doi: 10.19818/j.cnki.1671-1637.2021.02.022
Research on effectiveness of visual guiding system in entrance zone of freeway tunnel
WANG Shou-shuo, DU Zhi-gang, FENG Shou-zhong, JIAO Fang-tong, XU Fu-qiang
Abstract: To achieve the purpose of early recognition, early adaptation, and early decision-making for drivers in entrance zones of freeway tunnels, the present traffic situation of tunnel entrance zones was analyzed, and an idea and method for improving the visual guiding system in entrance zones of freeway tunnels were proposed. Using an indoor driving simulation platform, the driver's eye data were collected with an eye tracker. The driver's area of interest was divided into five regions, and the changes in the eye movement parameters in each region were analyzed. The change rules of drivers' sight zones were described based on the gaze point distribution and the area of visually sensitive zone. The effect after the improvement were evaluated. Research result shows that after the improvement of visual guiding system for the entrance zone of the tunnel, drivers' browsing time ratio (45.97%) and gaze time ratio (39.02%) at a far distance from the road improve significantly compared to the current plan, and the saccade amplitude (5.47°) reduces significantly. After the improvement, gaze points are more concentrated at a far distance of the road, while gaze points on both sides of the road reduce. In the current plan, the area of visually sensitive zone decreases sharply approximately 180 m away from the tunnel portal and increases slowly in the tunnel. After the improvement, the area of visually sensitive zone decreases approximately 350 m away from the tunnel portal and remains relatively stable thereafter. After the improvement, the change speed of drivers' area of the visually sensitive zone in each tunnel zone is less than that before the improvement. The effectiveness of visual guiding system is verified. It allows drivers to pay more attention to traffic information at a far distance of the road and in the tunnel. At the same time, the transition amplitude of sight zone is smaller, and the visual load reduces. 10 tabs, 12 figs, 32 refs.More>
2021, 21(2): 267-277. doi: 10.19818/j.cnki.1671-1637.2021.02.023
Improved SSD model in extraction application of expressway toll station locations from GaoFen 2 remote sensing image
WANG Zheng-hong, YANG Chuan
Abstract: The locations of expressway toll stations from GaoFen 2 remote sensing images were extracted as the research object. Expressway toll stations and 0.8 m remote sensing images of Beijing, Shanxi, Henan, Guangdong and Fujian in 2019 were selected to create a training sample dataset via image preprocessing, sample labeling, cropping, data enhancement, and sample dataset partition. Multiscale feature fusion was introduced to improve the target detection model of the single-shot multibox detector (SSD) by adding two operations, namely, "deconvolution" and "concat." The semantic features of high-level feature maps were assigned to low-level feature maps to enhance the upsampling quality and feature fusion capabilities, thereby improved the detection performance on small targets toll stations. The improved SSD model was applied to extract the locations of toll stations in Fujian in 2019 from GaoFen 2 images. The images were automatically sliced along the Fujian highway network vectors, and the slices were input into the model for target detection. The slices with toll stations were retained, and non-maximum suppression was adopted to remove redundant detection frames. The coordinates of the remaining detection frames were transformed into the coordinates of the center points, and the center point vectors of the expressway toll stations were directly output. Thus, the automatic end-to-end extraction of toll station locations could be realized. Research results show that the accuracy and recall of the improved SSD model and their harmonic average are 0.86, 0.88, and 0.87, respectively, which are higher than those of the conventional SSD, VGG, Faster R-CNN, and Feature Pyramid Networks (FPN) models. Therefore, the proposed automatic extraction method for toll station locations can considerably improve management efficiency and adequately satisfy the actual needs of highway managers. 3 tabs, 7 figs, 35 refs.More>
2021, 21(2): 278-286. doi: 10.19818/j.cnki.1671-1637.2021.02.024