Parameter estimation on daily arrival distribution of waterway lock
-
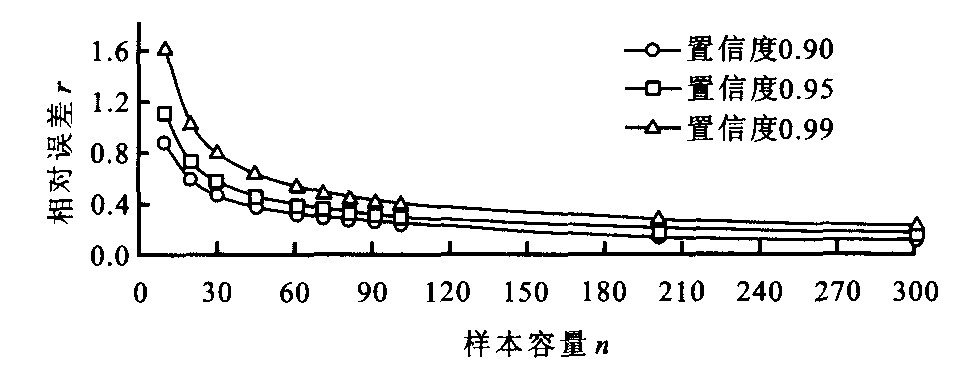
摘要: 讨论了船闸日到船分布参数的确定方法, 分析了样本容量和方差估计精度的关系及方差估计相对误差对日到船量计算的敏感性, 提出了合理的数据容量和取样方法。应用结果表明, 样本容量取90时, 日到船量计算的相对误差主要控制在5%以内, 对于工程实际是偏于安全的, 这说明该方法可行。Abstract: The tonnages or barges of daily arrival at a waterway lock accord with normal distribution. The distribution parameters (mean and variance) were analyzed by using traffic survey. The relationship between the sample size and the precision of variance estimation was discussed, and the sensitivity of variance estimation on the calculation of daily arrival volume was analyzed. Analysis results show that when sample size is over 90, the deviation of variance estimation is mostly less than 5%, the theory is feasible.
-
Key words:
- waterway engineering /
- waterway lock /
- mathematical statistics /
- daily arrival /
- variance estimation /
- sample size
-
表 1 不同样本容量时的估计相对误差
Table 1. Maximum deviations r at different n and (1-α)
1-α n 10 20 30 45 61 71 81 91 101 201 301 0.90 0.880 0.587 0.467 0.375 0.318 0.293 0.274 0.257 0.243 0.135 0.109 0.95 1.114 0.729 0.577 0.459 0.388 0.357 0.333 0.313 0.296 0.205 0.166 0.99 1.621 1.031 0.805 0.634 0.533 0.489 0.454 0.426 0.402 0.276 0.223 表 2 样本方差估计值与总体方差值的比较
Table 2. Variances comparison of sample and population
流向 按吨位计算 按艘数计算 总体值 估计值 相对误差/% 总体值 估计值 相对误差/% 上行 2.47 2.97 16.8 118 140 15.7 下行 2.35 2.56 8.2 113 126 10.3 表 3 上行日到船吨位AT、AP与AS的比较
Table 3. Comparison of AT、APand ASof upstream arrival tonnage
/ (104 t) 保证率/% AT AP (σ2=2.47) AS (σ2=2.97) (AP-AT) ·AT-1/% (AS-AT) ·AT-1/% 100 16.7 16.0 17.4 -4.2 4.4 98 14.9 14.3 15.3 -4.0 2.6 92 12.9 12.7 13.4 -1.6 3.5 75 10.7 10.8 11.2 0.9 4.4 50 9.1 9.2 9.0 1.1 -1.1 表 4 上行日到船艘数AT、AP与AS的比较
/艘 Table 4. Comparison of AT、APand ASof upstream arrival barge
保证率/% AT AP (σ2=118) AS (σ2=140) (AP-AT) ·AT-1/% (AS-AT) ·AT-1/% 100 800 775 836 -3.1 4.5 98 707 689 738 -2.5 3.9 92 627 613 644 -2.2 2.7 75 521 526 541 1.0 3.8 50 444 447 447 0.7 0.7 表 5 下行日到船吨位AT、AP与AS的比较
Table 5. Comparison of AT、APand ASof downstream arrival tonnage
/ (104 t) 保证率/% AT AP (σ2=2.35) AS (σ2=2.56) (AP-AT) ·AT-1/% (AS-AT) ·AT-1/% 100 16.1 16.6 17.2 3.1 6.8 98 14.8 14.9 15.3 0.7 3.4 92 13.3 13.4 13.7 0.7 3.0 75 11.7 11.6 11.8 -0.9 0.8 50 10.1 10.1 10.1 0 0 表 6 下行日到船艘数AT、AP与AS的比较
/艘 Table 6. Comparison of AT、APand ASof downstream arrival barge
保证率/% AT AP (σ2=113) AS (σ2=126) (AP-AT) ·AT-1/% (AS-AT) ·AT-1/% 100 850 824 860 -3.1 1.2 98 726 742 769 2.2 5.9 92 667 669 687 0.3 3.0 75 589 586 594 -0.5 0.8 50 519 510 510 -1.7 -1.7 -
[1] 王炜, 过秀成. 交通工程学[M]. 南京: 东南大学出版社, 2000. [2] 朱晓立, 李夏苗. 铁路货物运输速度和逾期率的调查与分析[J]. 交通运输工程学报, 2001, 1(4): 106-110. http://transport.chd.edu.cn/article/id/200104024ZHU Xiao-li, LI Xia-miao. Survey and analysis on transit speed and overdue rate in railway freight transportation[J]. Journal of Traffic and Transportation Engineering, 2001, 1(4): 106-110. (in Chinese) http://transport.chd.edu.cn/article/id/200104024 [3] 茆诗松, 王静龙, 濮晓龙. 高等数理统计[M]. 北京: 高等教育出版社, 1998. [4] 薛珊荣. 城市交通工程与街道规划设计[M]. 北京: 中国建筑工业出版社, 1988. [5] 杜荣骞. 生物统计学[M]. 北京: 高等教育出版社, 1991. [6] 盛骤, 谢式千, 潘承毅. 概率论与数理统计(第二版)[M]. 北京: 高等教育出版社, 1989. [7] 张玮, 廖鹏. 苏北运河施桥船闸到船特性分析[J]. 水利水运工程学报, 2003, 25(4): 1-4.ZHANG Wei, LIAO Peng. Analysis on characteristics of ship arrival at Shiqao lock[J]. Hydro-Science and Engineering, 2003, 25(4): 1-4. (in Chinese) -


 下载:
下载:

