

Black and white interlaminar instability failure of asphalt overlay on old cement slab
-
Abstract: In order to study the two kinds of instability failures between asphalt overlay and old cement slab such as black and white interlaminar horizontal shear slippage and interfacial bonding instability, the influence rules of vehicle speed, road adhesion coefficient, vertical load, interlaminar contact coefficient, loading rate, temperature and the spraying amount of viscous oil on interlaminar extreme stress and strain, shear strength and pull-out strength were revealed through the elastic theoretical calculation of composite structure, MATLAB programming, interlaminar shear test and pull-out test.The function relationships among interlaminar shear strength and normal stress, shear rate, temperature, and among pull-out strength and pull-out rate, temperature, the spraying amount of viscous oil were established respectively.Analysis result shows that the descending order of pull-out failure interface occurrence probabilities at 15 ℃ is cement slab surface, tack coat, asphalt membrane, the descending order at 45 ℃ is tack coat, cement slab surface, asphalt membrane, and average interlaminar bonding strength increases with the descending of above order.In order to reduce interlaminar instability failure, vehicle speed should be increased appropriately, vehicle axle load should be controlled, the clean and rough surface conditions of old cement slab should be kept, the spraying amount of viscous oil should be chosen appropriately, liquid petroleum asphalt is 0.20-0.40 L·m-2, and emulsified asphalt is 0.48-0.60 L·m-2.The average pull-out strength of core sample and interface failure position are recommended as distinguishinging bases for the construction quality of asphalt overlay.摘要: 为分析旧水泥板沥青加铺层黑白层间水平剪切滑移和界面粘结两类失稳性破坏, 通过复合结构弹性理论计算、MATLAB编程、层间剪切和拉拔试验, 揭示了车速、路面附着系数、竖向荷载、层间接触系数、加载速率、温度、粘层油洒布量等对层间极值应力应变、剪切强度和拉拔强度的影响规律, 分别建立了层间剪切强度与正应力、剪切速率、温度以及拉拔强度与拉拔速率、温度、粘层油洒布量的函数关系。分析结果表明: 15℃时拉拔破坏界面发生概率从大到小排序为水泥板表面、粘结层、沥青膜, 45℃时为粘结层、水泥板表面、沥青膜, 层间平均粘结强度随着上述排序的递减而增大; 为减少层间失稳性破坏, 应适当提高行车速度, 控制汽车轴载, 清洁和糙化水泥板表面, 选取适宜的粘层油洒布量, 液体石油沥青为0.20~0.40 L.m-2, 乳化沥青为0.48~0.60L.m-2, 并推荐以芯样平均拉拔强度和破坏界面位置作为加铺层施工质量检验判别依据。
-
0. Introduction
Once the interlamination between old Portland cement concrete pavement(PCCP) and asphalt overlay(AO) appears horizontal sliding or detachment phenomenon, relative constraints between AO and PCCP will lose, and various comprehensive destructions will soon occur under vehicle load, temperature, water and so on[1]. Therefore the stabilities of AO-PCCP interlaminar horizontal shear and bonding are the key factors to ensure the pavement performance and service life of overlay structure[2].
Ma et al carried out finite element modeling, and analyzed the semi-rigid base asphalt pavement, found that the interlamination between asphalt pavement and base was the biggest weak point under dynamic loading. With the increases of horizontal force coefficient and axle load, horizontal shear stress significantly increased, while vertical shear stress and displacement had changed appreciably, and they proposed to enhance shear strength between upper-surface and mid-surface of asphalt pavement when vehicle started and braked[3]. Baek et al analyzed the influence rule of black and white interlaminar bonding state on interlaminar crack propagation and mechanical properties by using finite element, considered two situations of interlaminar bonding and interlaminar separation[4-5]. Leng et al studied the influence rules of viscous oil type and spraying amount, asphalt mixture type, cement concrete surface characteristics and temperature on black and white interlaminar interface properties, and carried out accelerated pavement testing and strain test for interfacial properties[6]. On interlamination test aspect, test methods were used to analyze and evaluate interlaminar stability, such as direct shear and oblique shear tests[7-9], MTS shear test[10-11], interlaminar horizontal[12] and vertical tensile tests[7-9, 13-14], interlaminar torsion test[15-16]. Xu et al used Mohr-Coulomb criteria to describe direct shear test process, studied the relationships between maximum interlaminar shear strength and every single factor, and the cohesion and internal friction angle of tack coat material were obtained[8]. Wang et al evaluated interlaminar performance of asphalt overlay concrete bridge deck through shear and pull-out tests, respectively studied relationships among shear strength and shear rate, pull-out strength of two binding materials[11]. Wang et al studied the influences of asphalt mixture, tack coat material, semi-rigid base material, top and bottom interfaces of tack coat material on interlaminar bonding performance of semi-rigid base asphalt pavement by self-designed indoor direct shear and oblique shear tests, and recommended the spraying amount of layer-penetration oil[17]. Leng et al respectively proposed viscous oil program and the spraying amount of asphalt overlay[7, 11, 18].
The previous researches still exist the following problems. The influences of vehicle speed, road adhesion coefficient and vertical load on interlaminar horizontal shear performance are lack of quantitative understanding. The indexes for evaluating interlaminar bonding performance and interlaminar stress-strain variation under different bonding states are also insufficient. Pavement shear test method could not simulate the coupling influence of vertical load, horizontal load and temperature on pavement, and the quantitative function relationships generally consider single impact factor, are lack of integrity and guiding significance for field construction quality control. In this paper, black and white interlaminar failure modes are studied, the relationships among interlaminar mechanical properties and vehicle speed, road adhesion coefficient, vertical load and interlaminar contact coefficient are quantitatively researched based on elastic theoretical calculation of composite structure. Function relationships among shear strength and normal stress, shear rate, temperature, and pull-out strength and pull-out rate, temperature, spraying amount of viscous oil are established respectively through shear test (simultaneous loading includes vertical load, horizontal load, temperature), direct pull-out test and program calculation, the orders of interlaminar failure interface occurrence probabilities under different temperature conditions are studied, the spraying amount of viscous oil is recommended, and the pull-out strength of core sample and interface failure position are recommended as distinguishinging bases for the filed construction quality of asphalt overlay.
1. Black and white interlaminar instability failure mode analysis
There are about four modes of black and white interlaminar failure, such as interlaminar reflection crack[19-20], interlaminar horizontal tension fracture, interlaminar horizontal shear slippage instability, interfacial bonding instability. The first two modes are fracture-type failures, this paper focuses on the later two modes of failure—interlaminar instability failure.
1.1 Interlaminar horizontal shear slippage instability
The structure of asphalt overlay on old cement slab not only undergoes vertical loads, but also is subjected to horizontal loads. If the shear strength of black and white interlamination is not enough, while shear stress is too big, interlamination will occur relative displacement, and it causes instability, these result in asphalt surface slippage, pushing and other disease phenomena, greatly reduce the service life of asphalt overlay. According to Mohr-Coulomb criteria, interlaminar shear should satisfy the following equations [3, 7, 21]
where τ is interlaminar shear strength (MPa); σ is normal stress acting on shear plane (MPa), namely is vertical pressure; C is material cohesion(MPa); φ is the internal frictional angle of viscous oil (°); Kτ is shear strength structure (security) coefficient, it is chosen as 1.2 at emergency braking, upslope and curve section, 1.1 at general road section; τR is material permissible shear stress (MPa); τa is interlaminar theoretical shear stress(MPa).
Related research indicates that interlaminar maximum horizontal shear strength τ has direct ratio with shear rate Vτ, and has inverse ratio with test temperature[3, 5-6, 8, 11], and the relationship between τ and each single factor presents a power function[11]. On that basis, comprehensive function relationship among τ and σ, Vτ, temperature T will be proposed through Mohr-Coulomb criteria in the research.
1.2 Interfacial bonding instability
During finite element mechanics analysis, interlaminar contact coefficient is generally characterized by friction coefficient, 1 represents maximum interlaminar friction force, 0 represents minimum friction force. As well, interlaminar bonding state can be described by setting contact element or contact pair[22-23]. This paper comparatively analyzes ANSYS, ABAQUS finite element softwares[22-24]and BISAR pavement calculation program, finds that BISAR can better balance vertical loads and horizontal loads from vehicles. The evaluation index of interlaminar bonding state is shear elastic modulus instead of friction coefficient in BISAR, it assumes there is an infinitely thin intermediate layer between two adjacent horizontal layers. The strength of intermediate layer is represented by shear elastic modulus. When shear stress is produced on intermediate layer, it will cause relative horizontal displacement between two adjacent layers. G is difined as shear spring compliance, α is interlaminar contact (friction) coefficient, B is interlaminar bonding state parameter. The equations are as follows
where D is interlaminar relative horizontal displacement (m); S is interlaminar stress (N·m-2); δ is the radius of load equivalent circle; E is material elastic modulus(MPa); μ is material Poisson ratio; α∈[0, 1].
When α=0, G=0 and B=0, these mean no intermediate layer, interlamination is completely continuous; when α=1, G and B approach infinity, these indicate the presence of intermediate layer and the layer has partition effect, interlamination is completely smooth. α can not be considered as conventional friction coefficient, it depends on the radius of applied load circle, therefore α is not a pure material property parameter.
In this paper, by using horizontal load and vertical load coupling calculation function of BISAR and the concept of shear elastic modulus, the change laws of shear stress, pressure stress and strain are analyzed under different bonding states of black and white interlamination.
2. Mechanical analysis and calculation
2.1 Calculation theory of interlamination
Old cement slab asphalt overlay structure can be looked as composite elastic layer on infinite elastic foundation slab, pavement structure is treated as three-layer system, such as asphalt overlay elastic layer, cement thin slab with small deflection, elastic foundation(including base, sub-base, cushion and subgrade) from top to bottom[22-23]. Assuming that the interlamination between AO and PCCP is continuous contact, the interlamination between PCCP and elastic foundation is smooth contact.
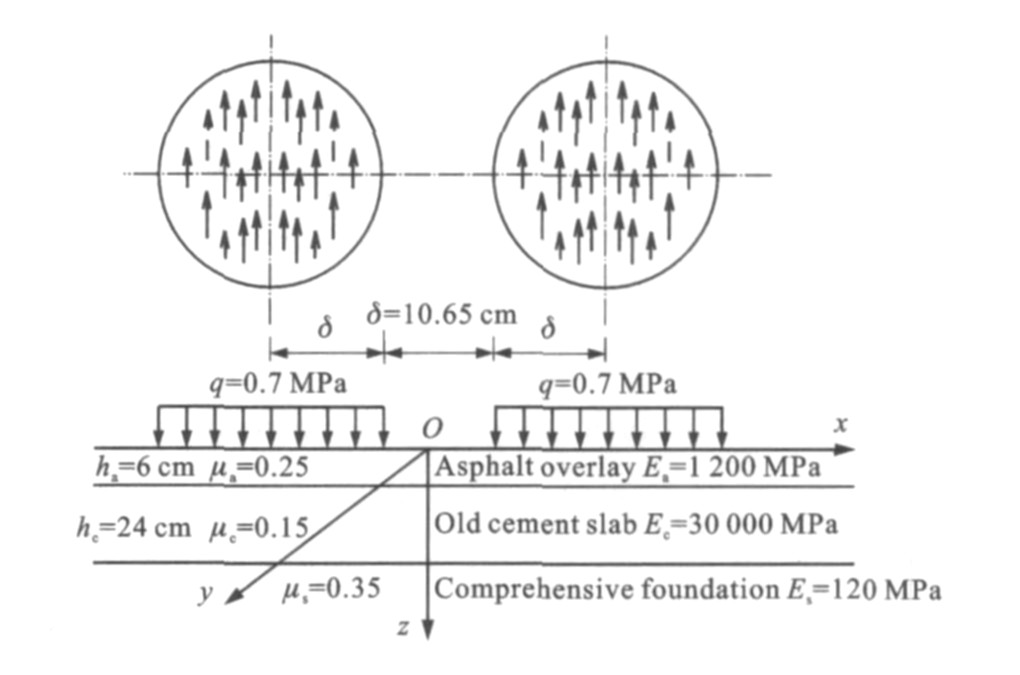
Through the above theory and BISAR, the change laws of interlaminar stress and strain are studied under double-circular well-distributed vertical load, horizontal load and different contact coefficients. For simple analysis, this paper only considers the normal temperature about 25 ℃, pavement structure is shown in Fig. 1. q is tire pressure; h is pavement thickness; subscripts a, c, s represent asphalt overlay, old cement slab and comprehensive elastic foundation respectively.
 Figure 1. Typical pavement structure
Pavement structure will produce the pavement parallel force under vehicle loads, it generally satisfies the following equation
where Q is horizontal force (N); P is vertical pressure (N); f is road adhesion coefficient.
This paper investigates and analyzes a large amount of field data, and the calculation result of f is shown in Tab. 1.
2.2 Calculation of interlaminar horizontal shear slippage
Through calculation and comparison, the interlaminar maximum stress and strain generally appear on the bottom of asphalt overlay[5, 7], rather than the surface of cement slab, so asphalt overlay is chosen as the research object. Calculated point is selected on the bottom of AO under load equivalent circle center point, and the calculation result is shown in Fig. 2.
Table 1. Calculation result of fPavementcondition Pavement type Vehicle speed/(km·h-1) 10 30 60 Dry Cement concrete 0.70-0.85 0.65-0.80 0.60-0.75 Asphalt overlay 0.70-1.00 0.65-0.85 0.5-0.65 Macadam pavement — 0.55-0.60 — Moist Cement concrete 0.60-0.70 0.40-0.60 0.35-0.55 Asphalt overlay 0.40-0.65 0.25-0.60 0.10-0.50 Macadam pavement — 0.35-0.40 — | Show Table DownLoad:
CSV
DownLoad:
CSV
 Figure 2. Interlaminar maximum horizontal shear stresses
From Fig. 2, the interlaminar maximum horizontal shear stress increases with the increases of vehicle vertical load and road adhesion coefficient. Interlaminar shear stress is mainly caused by horizontal load, and is less affected by vertical load, has a relevance to road adhesion coefficient. When f is equal to 0.9, vertical load increases from 0.7 MPa to 1.2 MPa, the interlaminar maximum shear stress increases by 71.17% to 0.671 MPa. When the vehicle wheel pressure is 0.7 MPa, f increases from 0.1 to 0.9, the interlaminar maximum horizontal shear stress increases by 7.9 times to 0.392 MPa. After fitting calculation, the growth rate of interlaminar horizontal shear stress with road adhesion coefficient is significantly faster than its rate with vertical load, it reflects that when a vehicle slowly passes over the pavement with great road adhesion coefficient, the impact and damage on pavement by vehicle load are more serious than at higher speed, when vehicle speed exceeds a certain value, the load impact on overlay becomes stable.
Therefore, the primary cause of asphalt overlay interlaminar slippage and horizontal instability is the pavement parallel force related with road adhesion coefficient, the second is vehicle load that is perpendicular to the pavement.
2.3 Calculation of interlaminar bonding instability
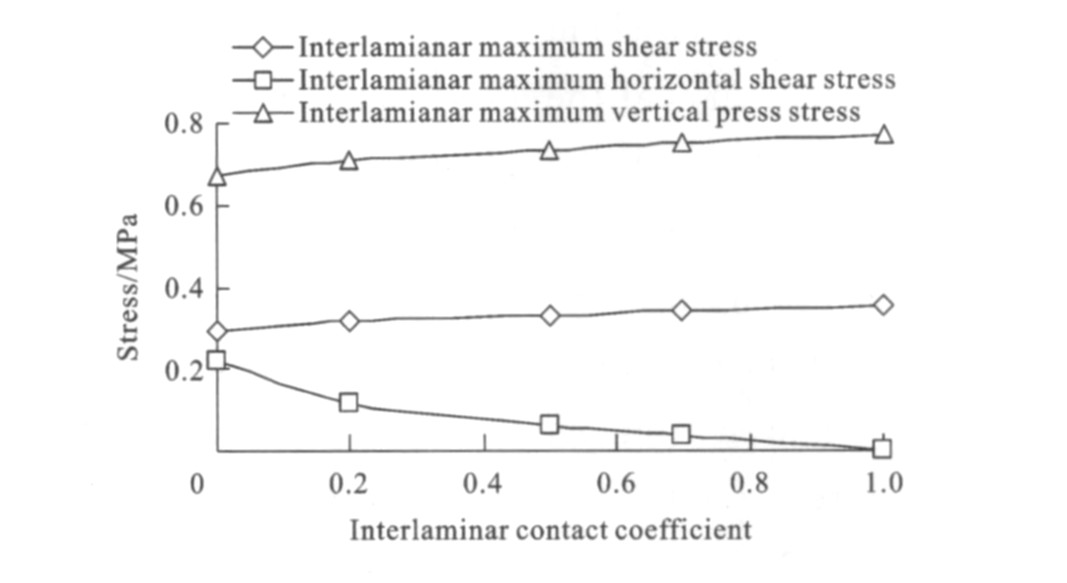
Calculation results are shown in Figs. 3, 4, it indicates that interlaminar contact is completely continuous or completely smooth respectively when α is 0 or 1, it represents semi-continuous and semi-smooth when α is 0.5, it represents 80% or 40% of continuous contact when α is 0.2 or 0.6.
 Figure 3. Interlaminar maximum stresses
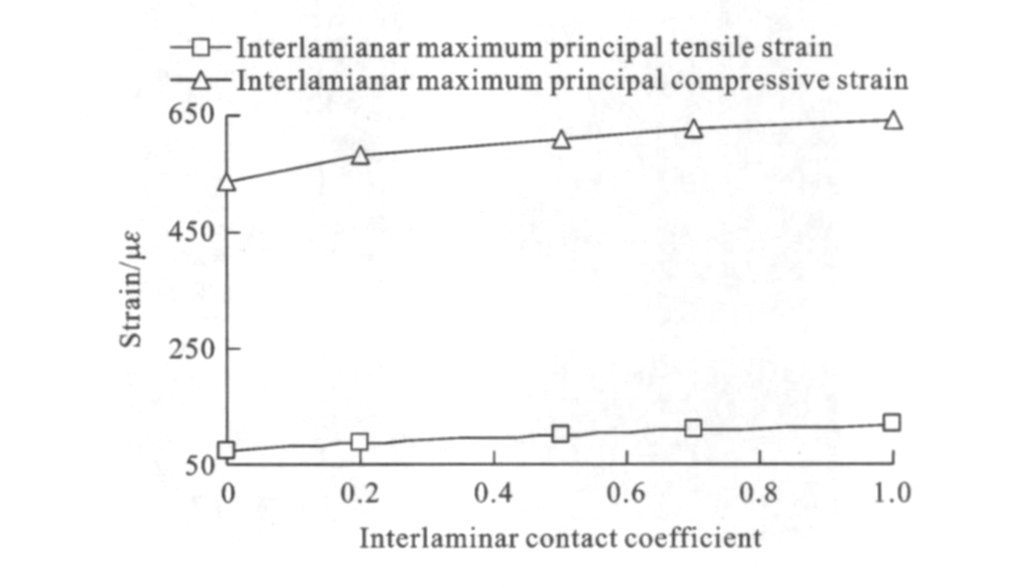
 Figure 4. Interlaminar maximum strains
Figs. 3, 4 show that with the increase of contact coefficient, interlaminar maximum shear stress increases, interlaminar maximum shear stress under smooth contact is larger than under continuous contact state by about 20.3%. The maximum vertical pressure at the bottom of AO increases with the increase of contact coefficient. When α is equal to 1, the absolute value of maximum compressive stress is larger than standard tire pressure (0.7 MPa) by about 9.9%. Stress concentration easily occurs at the bottom of AO when interlamination is perfectly smooth. Interlaminar maximum horizontal shear stress decreases with the increase of contact coefficient, until it reaches zero, this result indicates that the possibility of interlaminar relative displacement increases with the increase of interlaminar contact coefficient, interlaminar friction force and relative constraint force decrease, so the interlaminar horizontal shear stress decreases. The absolute values of interlaminar maximum principal tensile strain and compressive strain increase with the increase of contact coefficient, the maximum principal tensile strain at the bottom of AO increases from 72.19 με to 116.40 με when α changes from 0 to 1.
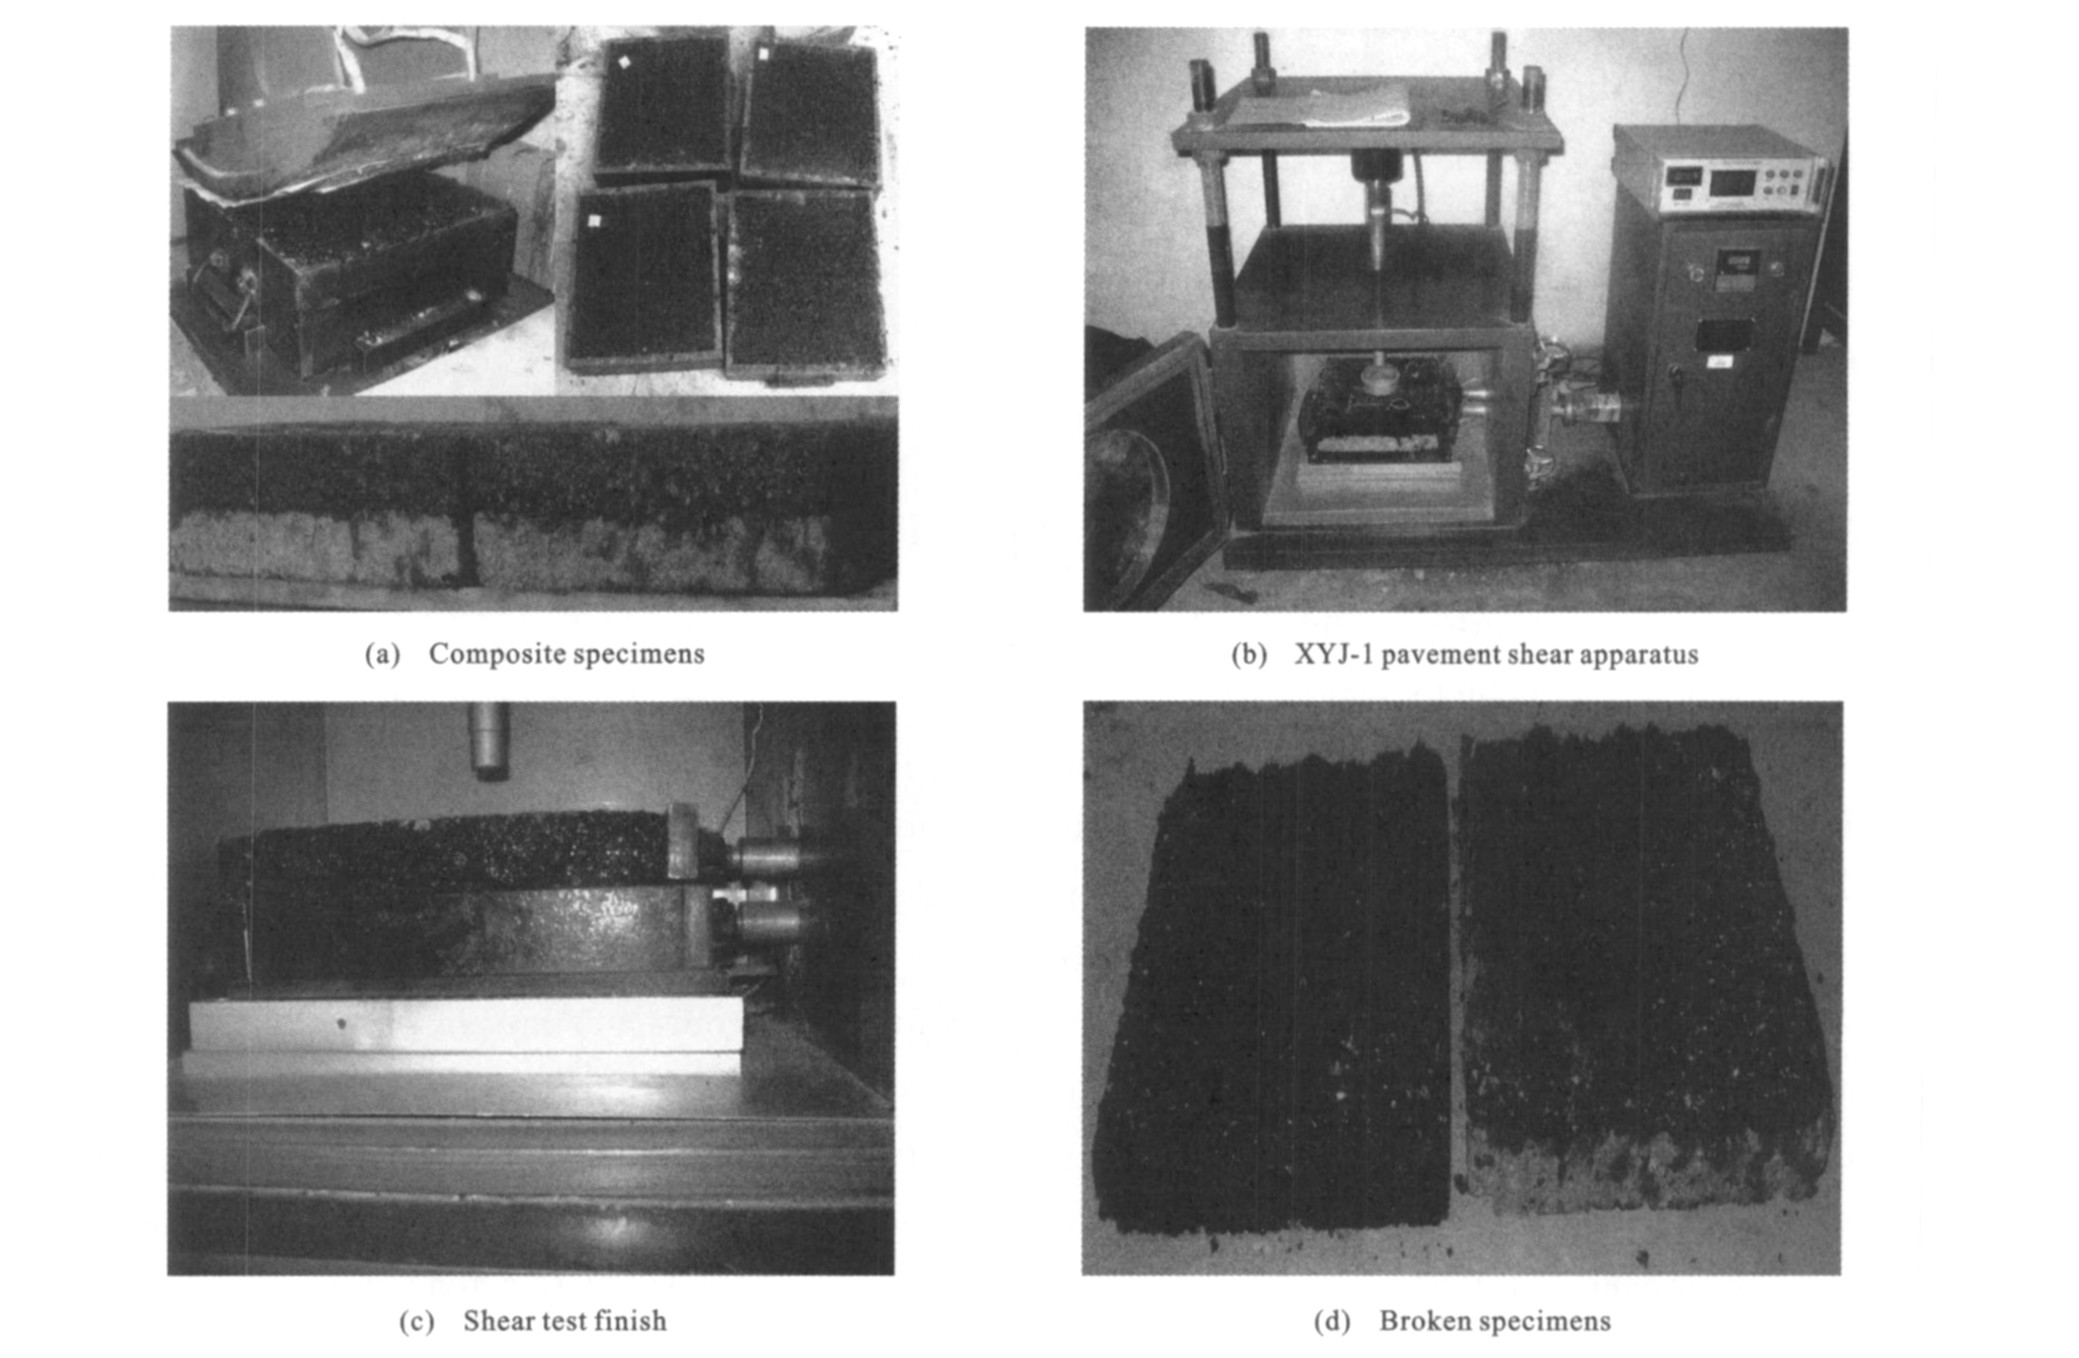
 Figure 5. Pavement structure shear test and broken specimens
In summary, if the interlaminar bonding state between AO and PCCP changes from continuous contact to smooth contact, the phenomenons such as stress concentration (crushing and cracking), relative displacement instability and other failure modes appear on AO under traffic loads. Therefore, how to effectively improve the bonding effect is related to the expected life of AO.
3. Simulation test and result analysis
3.1 Interlaminar horizontal shear slippage failure test
In order to simulate actual working conditions of overlay, pavement structure shear test device equipped with vertical load and temperature control box is used, and is shown in Fig. 5. According to strength criteria of C30, concrete specimens are compounded, the specimens are shaped and cured in rutting mould (300 mm×300 mm×50 mm). PC-3 quick breaking emulsified asphalt made in Shell Company is spread on concrete surface, and the spraying amount is 0.4 L·m-2 without any prior explanation. Then AC-16C asphalt concrete is repaved on concrete layer, its thickness is 50 mm. Composite specimens(300 mm×300 mm×100 mm) are molded by rubbing and kneading. In order to decrease the error caused by the gapping between pressure head and specimen, the vertical pressure head and upper part of composite specimens are fixed, horizontal dynamic load is applied on the under part of composite specimen. Interlaminar shear strength is calculated by the following equation
where F is the maximum failure horizontal shear force (N); A1 is the shear area of specimen (300 mm×300 mm).
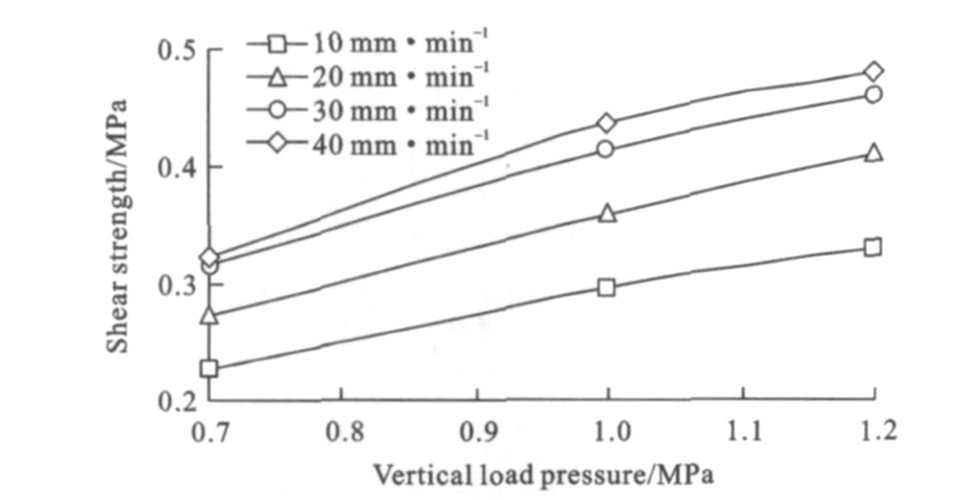
Room test temperature is 30 ℃. In order to approach the contact area of actual tire load equivalent circle (δ=10.65 cm), the radius of vertical loading circle is selected as 10 cm. The loading circle radius of 5 cm situation is shown in Fig. 5(c), vertical forces are equal to 0, 21.98 kN (0.7 MPa), 31.4 kN (1.0 MPa), 37.68 kN (1.2 MPa) respectively. The horizontal shear loading rates are 10, 20, 30, 40 mm·min-1 respectively. Three tests under each condition are carried out, and the average value is selected as the horizontal shear failure strength. There are many influence factors in tests, the fixed conditions are as follows without prior explanation: test temperature is 30 ℃, vertical load is 21.98 kN (0.7 MPa), horizontal shear loading rate is 10 mm·min-1. Test results are shown in Figs. 6-10.
 Figure 6. Relationship between shear strength and shear rate
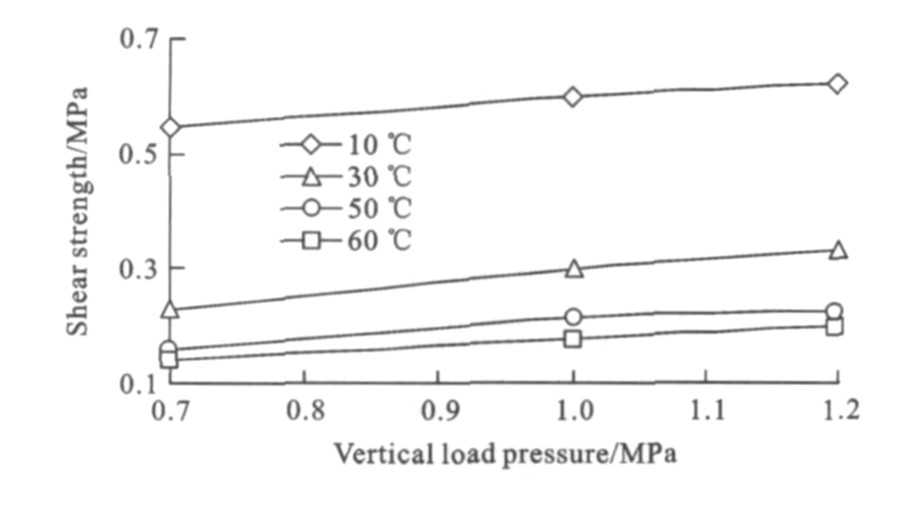
 Figure 7. Relationship between shear strength and test temperature
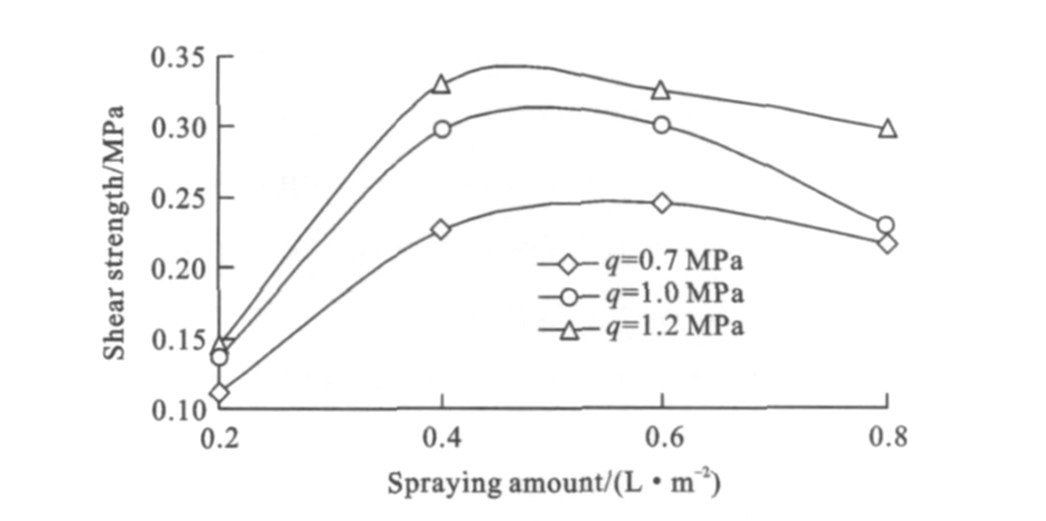
 Figure 8. Relationship between shear strength and spraying amount of viscous oil
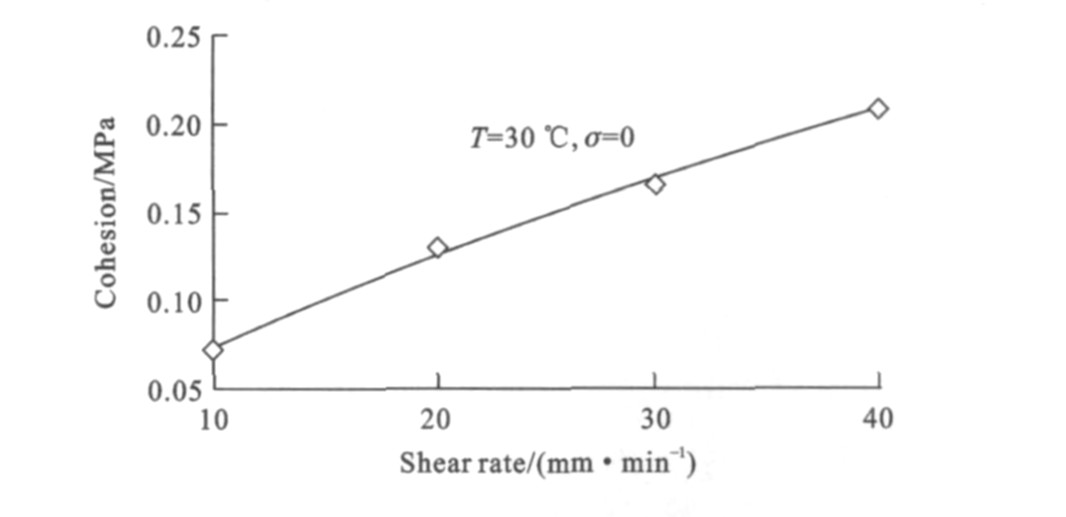
 Figure 9. Relationship between cohesion and shear rate
 Figure 10. Relationship between cohesion and test temperature
In Fig. 6, the interlaminar horizontal shear failure strength increases with the increases of vertical load and shear rate. Fast shear makes tack coat as a whole system to play the role of resisting shear. When shear rate increases to a certain value, shear failure strength is tending towards stability. Test results verify the mechanical calculation results in Fig. 2, when vehicle load is constant, vehicle speed increases, road adhesion coefficient decreases, so interlaminar maximum shear stress decreases. Vehicle speed is direct ratio with shear rate[8, 22], vehicle speed increases, shear rate increases, shear failure strength increases, so it can be considered that the increase of vehicle speed is beneficial for the stability of black and white interlamination.
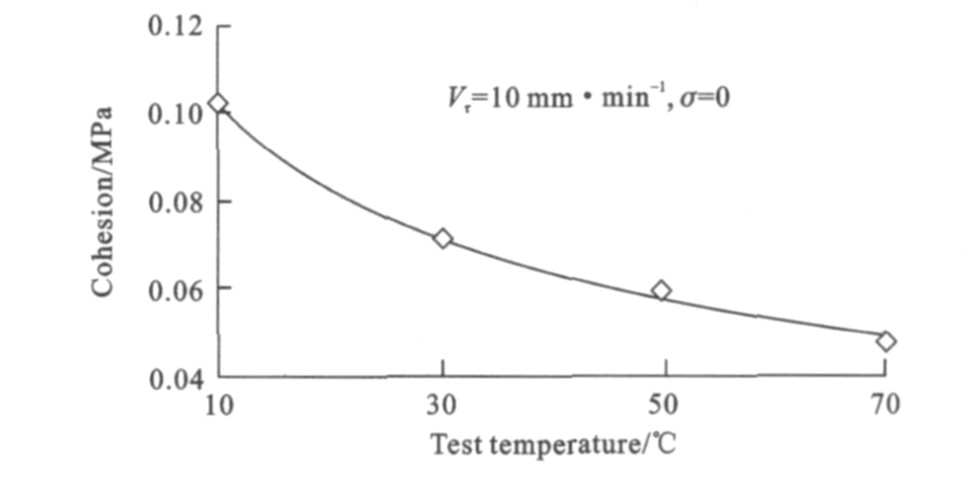
In Figs. 7, 8, interlaminar horizontal shear failure strength significantly decreases with the increase of temperature. When the spraying amount of viscous oil increases, shear failure strength firstly increases and then decreases. The average spraying amount corresponding to the maximum interlaminar horizontal shear strength is 0.48 L·m-2 under different vertical loads.
When there is no vertical load, so normal stress on shear plane is equal to zero, it is known that τ=C. In Figs. 9, 10, the cohesion C of tack coat is direct ratio with shear rate, and is inverse ratio with test temperature. Through MATLAB programming calculation, C is
C=0.043 5V T-0.369 9R2=0.996 2 (10)
where R is correlation coefficient.
In Figs. 6-10, C and φ both trend down with the increases of temperature when shear rate is constant. When test temperature is constant, C and φ both increase with the increase of shear rate. Combining Mohr-Coulomb criterion with MATLAB programming calculation, τ is
In summary, for the asphalt bonding material, the horizontal shear performance of black and white interlamination can be characterized by the following equation
where m1, m2, m3, m4, m5 are undetermined coefficients of materials.
When vehicle is braking or on the slope in moist conditions, and f=0.5, q=0.7 MPa, τa=0.218 MPa is obtained by Fig. 2. When f=0.5, vehicle speed is about 30 km·h-1 by looking at Tab. 1. Through the conversion method[22], shear rate is approximately equal to 100 mm·min-1. Vτ=100 mm·min-1, T=25 ℃ and q=σ=0.7 MPa are substituted in Eq.(11), τ=0.712 MPa is obtained. Selecting Kτ=1.2, τR=0.593 MPa is known by Eq.(2). τa=0.218 MPa is checked by Eq.(3), τa < τR, so the horizontal shear slippage instability in the interlamination does not take place.
In short, in order to reduce the relative slippage and horizontal shear failure between AO and PCCP, vehicle speed should be increased, the road adhesion coefficient should be reduced, and interlaminar horizontal shear strength should be enhanced. The spraying amount of viscous oil should be appropriate. Sudden start and emergency stop drivings should be reduced as much as possible in special road section such as larger longitudinal slope in summer.
3.2 Interfacial bonding failure
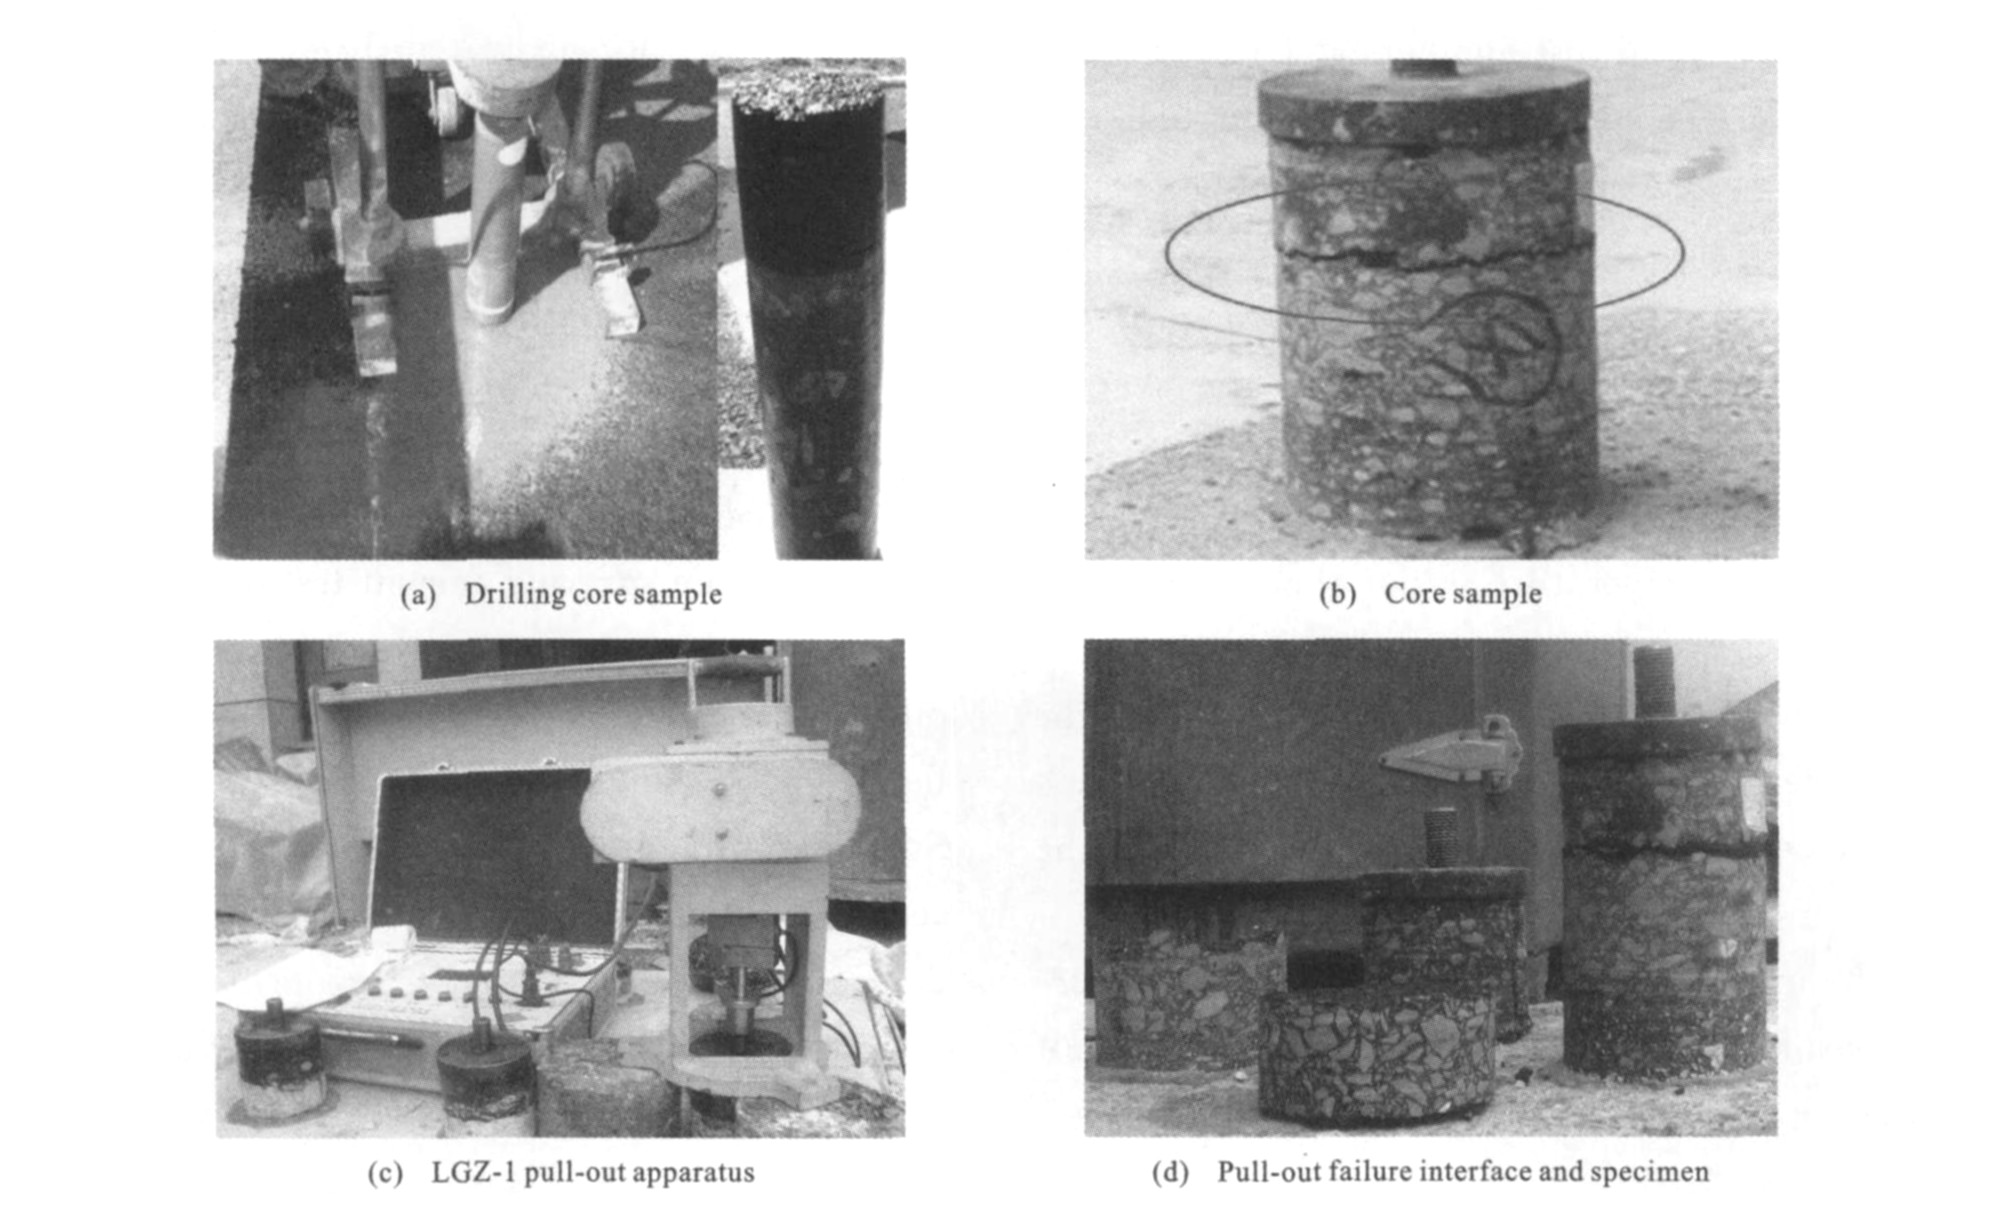
Drilling core samples are taken at locations K153+100-K158+800 on Yantai-Weihai Expressway, the core sample diameter is 100 mm. Drilling depth includes AO (100 mm), tack coat(viscous oil), and old PCCP (260 mm). Direct pull-out tests are conducted(Fig. 11) to evaluate whether interlaminar bonding condition could meet the requirements. The interlaminar viscous oil of drilling core sample is PC-3 quick breaking emulsified asphalt, spraying amount is 0.4 L·m-2. The complete core samples with two smooth end parts are taken, epoxy resin is spread evenly at both ends of each specimen, and direct pull-out test is carried out, Pull-out rate is 10 mm·min-1, the force and displacement are tested. Interlaminar bonding strength is calculated by the following equation
where p is bonding strength (MPa); t is the maximum destructive pull-out force (N); A2 is circular cross sectional area of core sample(502π mm2). Two groups of tests are carried out at (15±1.5) ℃ and (45±1.5) ℃, and each group includes 30 specimens. Test results are shown in Tab. 2 and Figs. 12, 13.
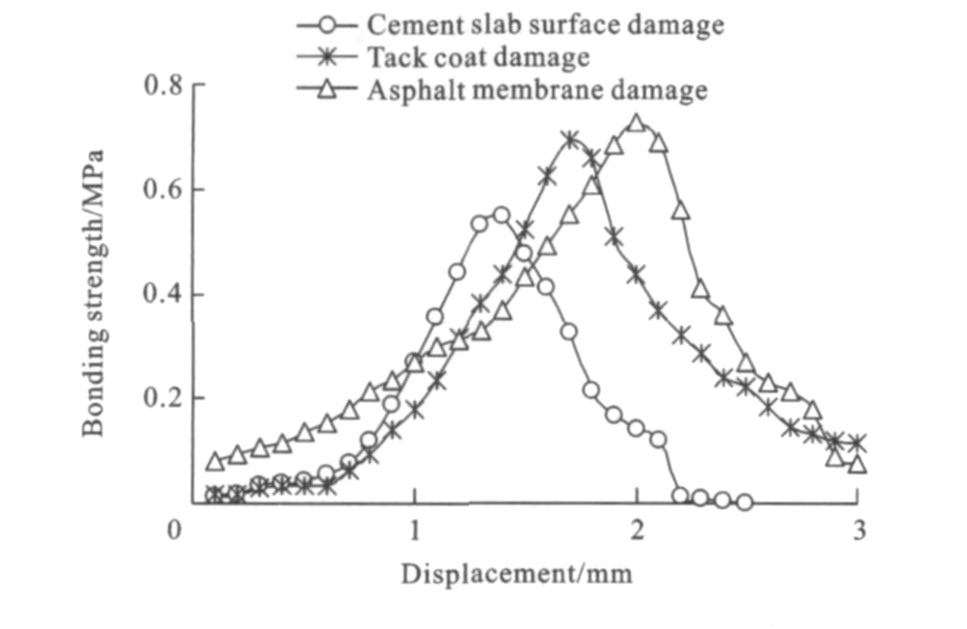
The relationship between the order of failure interface occurrence probability and average bonding strength is shown in Tab. 2 and Fig. 12, the descending order of pull-out failure interface occurrence probability at 15 ℃ is cement slab surface, tack coat, asphalt membrane. When temperature is 45 ℃, the order is tack coat, cement slab surface, asphalt membrane. Interlaminar average pull-out strength increases corresponding to the descending order. This is because the pull-out test failure interface occurs in the weakest link of black and white interlaminar bonding system, the average bonding strength of the most easily damaged interface is also the lowest.
 Figure 11. Direct pull-out testTable 2. Result of direct pull-out test
Pull-out damage interface Cement slab surface damage Tack coat damage Asphalt membrane damage Epoxy damage Experimental temperature/℃ 15 45 15 45 15 45 15 45 Damage number 19 9 6 13 4 6 1 2 Damage probability/% 63.33 30.00 20.00 43.33 13.33 20.00 3.33 6.67 Average bonding strength/MPa 0.518 0.496 0.645 0.314 0.707 0.511 Standard deviation of bonding strength/MPa 0.082 0.059 0.116 0.048 0.149 0.091 | Show TableDownLoad:
CSV
 Figure 12. Typical contrast of pull-out tests at 15 ℃
 Figure 13. Typical contrast of pull-out tests at 45 ℃
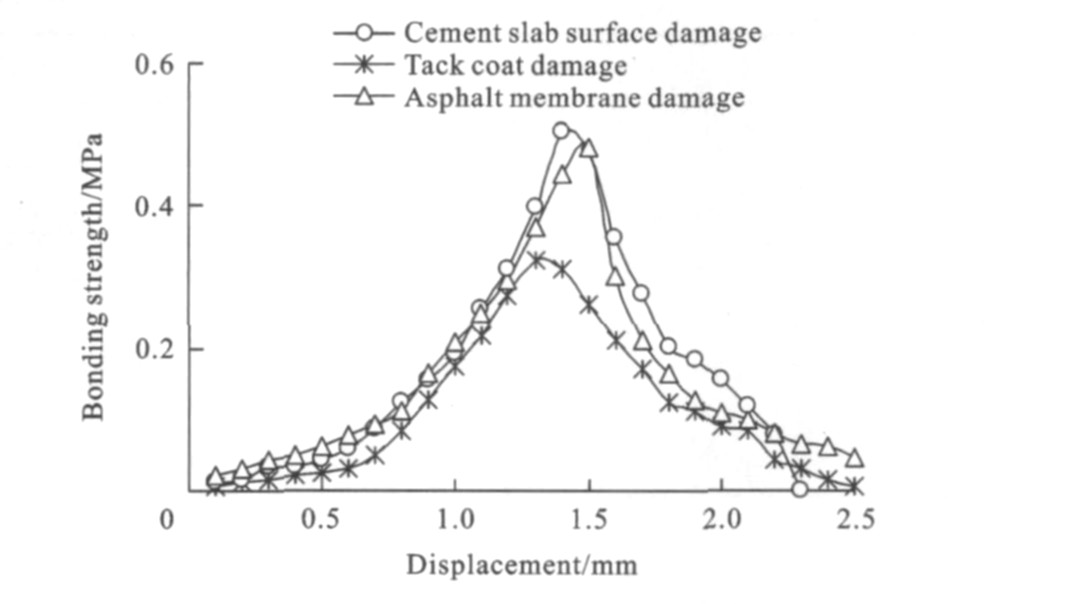
Pull-out failures of tack coat are shown in Fig. 13 and Tab. 2, the average bonding strength decreases from 0.645 MPa to 0.314 MPa when temperature increases from 15 ℃ to 45 ℃. The maximum pull-out strength of tack coat failure at 45 ℃ is the smallest of all failure interfaces, it indicates that temperature is an important influence factor for bonding strength of tack coat.
Test result shows that pull-out failure interfaces often occur at the cement concrete slab surface or the position away from cement slab surface of 1-4 mm. The damage number accounts for 63.33% of total test numbers at 15 ℃, and for 30% of total test numbers at 45 ℃, this indicates that the surface condition of cement slab is the most important factor that affects interface bonding. Pull-out failure interfaces occur at the cement slab surface at 15 ℃ and 45 ℃, the average bonding strengths are 0.518 MPa and 0.496 MPa respectively, the little difference of these values indicates that temperature is not the major factor causing cement slab surface damage, but the improper handling of cement concrete surface is the biggest weak point of interlaminar bonding, such as dust, debris, oil, cracks and voids beneath the slab.
The less incidence of interface damage occurs at the asphalt membrane within overlay. Asphalt membrane damage number is 4 times(13.33%) and 6 times(20.00%) in two groups of tests at 15 ℃ and 45 ℃ respectively. The average bonding strength decreases from 0.707 MPa to 0.511 MPa, These values are the largest of all tests, this indicates that the asphalt membrane has the best cohesiveness and stability in interlaminar system.
The construction quality of asphalt overlay can be evaluated based on drilling core pull-out test. The direct pull-out test is strongly recommended in quality inspection of asphalt overlay. If pull-out strength is higher and damage interfaces occur at the asphalt membrane of AO, it can deduce that the overlay project is of good quality. On the contrary, if pull-out strength is smaller and damage interfaces occur at the cement slab surface or tack coat, overlay project is likely of poor quality.
3.3 Optimum spraying amount test of viscous oil
Molding method of composite specimen and viscous oil are the same as the above. Medium-curing liquid petroleum asphalt made in Shangdong Sunshine Asphalt Company Limited is selected to compare. After test specimens molding for one day, four cylinder specimens are drilled out from each composite specimen. The diameter of cylinder specimen is 100 mm and the height is 100 mm. Each group includes two specimens, and their average value is as interlaminar pull-out strength. Epoxy resin is spread evenly at both ends of each specimen. Loading rate is 10 mm·min-1. According to the above pull-out test process, test results are shown in Tab. 3. When test temperature is 15 ℃ and pull-out rate is changing, test results are shown in Fig. 14.
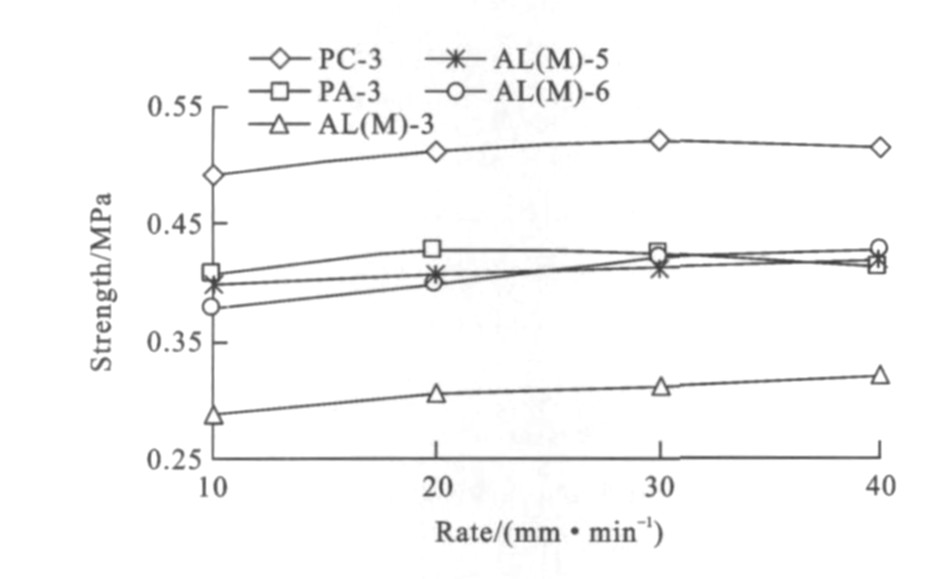
In Tab. 3, the interlaminar pull-out strength decreases with the increase of temperature, the pull-out strength of inside molding specimen is generally less than the strength of field drilling core sample, this is because field mechanized construction and quality control are better than inside molding condition. The increase of liquid petroleum asphalt specification number represents the increase of bitumen viscosity and the enhancing of interlaminar bonding effect, so the average interlaminar pull-out strength increases. When PC-3 emulsified asphalt is as viscous oil, the interlaminar pull-out strength is larger than PA-3 emulsified asphalt as viscous oil. It is because slower de-emulsification speed of anionic emulsified asphalt, and surface charge repulsion causes smaller interlaminar bonding strength. With the increases of spraying amount, pull-out strength firstly increases and then decreases. For liquid petroleum asphalt, when pull-out strength reaches its maximum, the optimum spraying amount is 0.2-0.4 L·m-2. For emulsified asphalt, the optimum spraying amount is 0.4-0.6 L·m-2. In Fig. 14, with the increase of liquid petroleum asphalt pull-out rate, the pull-out strength basically relies on linear increase, but the increase amount is not obvious.
Table 3. Average interlaminar pull-out strengths under different spraying amounts MPaAsphalt type Specification 15 ℃±1.5 ℃, spraying amount/(L·m-2) 45 ℃±1.5 ℃, spraying amount/(L·m-2) 0.2 0.4 0.6 0.2 0.4 0.6 Medium-curing liquid petroleum asphalt (Shangdong Sunshine) AL(M)-3 0.303 0.287 0.283 0.172 0.164 0.141 AL(M)-5 0.356 0.398 0.371 0.173 0.188 0.137 AL(M)-6 0.387 0.378 0.369 0.169 0.194 0.146 Quick breaking emulsified asphalt(Shell) PC-3 0.408 0.492 0.436 0.197 0.261 0.246 PA-3 0.329 0.407 0.406 0.193 0.227 0.227 | Show TableDownLoad:
CSV
 Figure 14. Relationship between pull-out strength and pull-out rate
Combining the above interlaminar shear test results and getting the intersection, the optimum spraying amount of interlaminar viscous oil is recommended as 0.48-0.60 L·m-2 for emulsified asphalt and 0.20-0.40 L·m-2 for liquid petroleum asphalt, the results verify the optimum spraying amount of 0.226 L·m-2[7]. If interlamination is set up with interlayer material, such as geogrid, the optimum spraying amount can increase by 0.15-0.30 L·m-2.
Combining test results of Tab. 3 and Fig. 13, through MATLAB programming, the function relationship is
p=(a1Vp+a2)b1Tb2(c1Sa2+c2Sa+c3) (14)
where Vp is pull-out rate (mm·min-1); Sa is the spraying amount of viscous oil (L·m-2); a1, a2, b1, b2, c1, c2, c3 are undetermined coefficients of materials.
For PC-3 emulsified asphalt, the fitting results of Eq.(14) are as follows: R=0.997 8, mean square error is equal to 0.008, a1=0.023, a2=11.997, b1=0.116, b2=-0.583, c1=-6.303, c2=5.402, c3=0.542, the other undetermined coefficients of materials can be calculated by parity of reasoning.
4. Conclusions
Theoretical calculation shows that the slower vehicle speed is, the bigger road adhesion coefficient is, and the horizontal effect of load is more obvious. The influence of road adhesion coefficient on interlaminar horizontal shear stress is more than the influence of vertical load. In order to reduce interlaminar horizontal slippage instability, vehicle speed should be increased in summer or at larger longitudinal slope road section, sudden start and emergency stop drivings should be reduced, and vehicle axle load should be controlled. While the upper limit value of improving vehicle speed can be studied in the next step. If the black and white interlaminar bonding state (interlamination from continuous contact to smooth contact) is worse, interlaminar displacement instability and stress concentration easily appear, this will accelerate cracking and crushing damages of overlay.
Interlaminar shear test shows that the interlaminar horizontal shear strength increases when vertical load and shear rate increase, and temperature decreases. The interlaminar shear performance of asphalt material can be characterized by proposed equations through MATLAB programming calculation. Pull-out test shows that the pull-out failure interface occurrence probability at 15 ℃ and 45 ℃ are ranked respectively(descending order): cement slab surface, tack coat, asphalt membrane; tack coat, cement slab surface, asphalt membrane. Interlaminar average pull-out strength increases with the descending of above order.
Average pull-out strength and interface failure position are recommended as distinguishinging bases for the construction quality of asphalt overlay. If pull-out strength is higher, and the damage interface occurs at the asphalt membrane of AO, the overlay project is of good quality. On the contrary, if pull-out strength is smaller and damage interface occurs at the cement slab surface or tack coat, the overlay project is likely of poor quality.
Combining shear tests and pull-out tests, the optimum spraying amount of interlaminar viscous oil is recommended as 0.48-0.60 L·m-2 for emulsified asphalt and 0.20-0.40 L·m-2 for liquid petroleum asphalt. If interlamination is set up with interlayer material, the optimum spraying amount can increase by 0.15-0.30 L·m-2. Pull-out strength increases linearly with the increase of pull-out rate, is inverse ratio with test temperature, and has quadratic parabola relationship with the spraying amount of viscous oil. The function relationship among these parameters can be obtained by programming calculation.
-
Table 1. Calculation result of f
Pavementcondition Pavement type Vehicle speed/(km·h-1) 10 30 60 Dry Cement concrete 0.70-0.85 0.65-0.80 0.60-0.75 Asphalt overlay 0.70-1.00 0.65-0.85 0.5-0.65 Macadam pavement — 0.55-0.60 — Moist Cement concrete 0.60-0.70 0.40-0.60 0.35-0.55 Asphalt overlay 0.40-0.65 0.25-0.60 0.10-0.50 Macadam pavement — 0.35-0.40 —  下载: 导出CSV
Table 2. Result of direct pull-out test
Pull-out damage interface Cement slab surface damage Tack coat damage Asphalt membrane damage Epoxy damage Experimental temperature/℃ 15 45 15 45 15 45 15 45 Damage number 19 9 6 13 4 6 1 2 Damage probability/% 63.33 30.00 20.00 43.33 13.33 20.00 3.33 6.67 Average bonding strength/MPa 0.518 0.496 0.645 0.314 0.707 0.511 Standard deviation of bonding strength/MPa 0.082 0.059 0.116 0.048 0.149 0.091
下载: 导出CSV
Table 3. Average interlaminar pull-out strengths under different spraying amounts MPa
Asphalt type Specification 15 ℃±1.5 ℃, spraying amount/(L·m-2) 45 ℃±1.5 ℃, spraying amount/(L·m-2) 0.2 0.4 0.6 0.2 0.4 0.6 Medium-curing liquid petroleum asphalt (Shangdong Sunshine) AL(M)-3 0.303 0.287 0.283 0.172 0.164 0.141 AL(M)-5 0.356 0.398 0.371 0.173 0.188 0.137 AL(M)-6 0.387 0.378 0.369 0.169 0.194 0.146 Quick breaking emulsified asphalt(Shell) PC-3 0.408 0.492 0.436 0.197 0.261 0.246 PA-3 0.329 0.407 0.406 0.193 0.227 0.227
下载: 导出CSV
-
[1] KRUNTCHEVA M R, COLLOP A C, THOM N H. Effect of bond condition of flexible pavement performance[J]. Journal of Transportation Engineering, 2005, 131(11): 880-888. doi: 10.1061/(ASCE)0733-947X(2005)131:11(880) [2] RAAB C, PARTL M N. Investigation into a long-term interlayer bonding of asphalt pavements[J]. Baltic Journal of Road and Bridge Engineering, 2008, 3(2): 65-70. doi: 10.3846/1822-427X.2008.3.65-70 [3] MA Xin, GUO Zhong-yin, LI Zhi-qiang, et al. Shear destruction mechanism of asphalt pavement under moving load[J]. China Journal of Highway and Transport, 2009, 22(6): 34-39. [4] BAEK J, OZER H, WANG Hao, et al. Effects of interface conditions on reflective cracking development in hot-mix asphalt overlays[J]. Road Materials and Pavement Design, 2010, 11(2): 307-334. doi: 10.1080/14680629.2010.9690278 [5] HU Xiao-di, WALUBITA L F. Effects of layer interfacial bonding conditions on the mechanistic responses in asphalt pavements[J]. Journal of Transportation Engineering, 2011, 137(1): 28-36. doi: 10.1061/(ASCE)TE.1943-5436.0000184 [6] LIU Li. Study on the technology performance of asphalt pavement layer interfaces[D]. Xi'an: Chang'an Univerisity, 2008. [7] LENG Z, AL-QADI I L, CARPENTER S H, et al. Interface bonding between hot-mix asphalt and various Portland cement concrete surfaces[J]. Transportation Research Record, 2009(2127): 20-28. [8] XU Qin-wu, ZHOU Qing-hua, MEDINA C, et al. Experimental and numerical analysis of a waterproofing adhe-sive layer used on concrete-bridge decks[J]. International Journal of Adhesion and Adhesives, 2009, 29(5): 525-534. doi: 10.1016/j.ijadhadh.2008.12.001 [9] ZHOU Qing-hua, XU Qin-wu. Experimental study of waterproof membranes on concrete deck: interface adhesion under influences of critical factors[J]. Materials and Design, 2009, 30(4): 1161-1168. doi: 10.1016/j.matdes.2008.06.023 [10] WANG Shui-yin. Study on interlaminar shear strength indoor test method between asphalt concrete layers[J]. Highway, 2010(2): 144-147. [11] WANG Ya-ling, ZHOU Yu-li, YAO Ai-ling, et al. Test of shear and pull-off between asphalt and concrete on bridge deck pavement structure[J]. Journal of Chang'an University: Natural Science Edition, 2009, 29(6): 15-18. [12] WANG Xuan-cang, LIU Kai, LI Shan-qiang. Study on resistance to reflective crack of interlayer materials in asphalt overlay[J]. Journal of Building Materials, 2010, 13(2): 247-252, 271. [13] CHEN Ming-xing. Research on test method and evaluation indexes about interlayer bonding of asphalt pavement[D]. Xi'an: Chang'an Univerisity, 2010. [14] WANG Xuan-cang, WANG Chao-hui, ZHANG Yan-ping. Research and development of interlayer processing technologyof combining pavement[J]. Road Machinery and Construc-tion Mechanization, 2008, 25(2): 9-12. [15] COLLOP A C, SUTANTO M H, AIREY G D, et al. Development of an automatic torque test to measure the shear bond strength between asphalt[J]. Construction and Building Materials, 2011, 25(2): 623-629. doi: 10.1016/j.conbuildmat.2010.07.030 [16] RAAB C, PARTL M N, El-HALIM O A. Evaluation of interlayer shear bond devices for asphalt pavements[J]. Baltic Journal of Road and Bridge Engineering, 2009, 4(4): 186-195. doi: 10.3846/1822-427X.2009.4.186-195 [17] WANG Shui-yin. Influence factors of bond performance between asphalt surface layer and semi-rigid base[J]. Journal of Traffic and Transportation Engineering, 2010, 10(2): 12-19. [18] CHEN D H. Slippage failure of a new hot-mix asphalt overlay[J]. Journal of Performance of Constructed Facilities, 2010, 24(3): 258-264. doi: 10.1061/(ASCE)CF.1943-5509.0000089 [19] BAEK J, Al-QADI I L. Finite element hmethod modeling of reflective cracking initiation and propagation-investigation of the effect of steel reinforcement interlayer on retarding reflect-ive cracking in hot-mix asphalt overlay[J]. Transportation Research Record, 2006(1949): 32-42. [20] BAEK J, Al-QADI I L. Mechanism of overlay reinforcement toretard reflective cracking under moving vehicular loading[C]∥RILEM. 6th RILEM International Conference on Cracking inPavements. Chicago: RILEM, 2008: 563-573. [21] COLLOP A C, THOM N H, SANGIORGI C. Assessmentof bond condition using the Leutner shear test[J]. Proceed-ings of the Institution of Civil Engineers-Transport, 2003, 156(4): 211-217. [22] YUAN Yu-qing. Theories of interlayer between asphalt over-lay and old Portland cement concrete pavement and technology ofatactic polypropylene modified bituminous linoleum to preventcracking[D]. Xi'an: Chang'an University, 2007. [23] NOVAK M, BIRGISSON B, ROQUE R. Tire contact stresses and their effects on instability rutting of asphalt mixture pavements: three-dimensional finite element analysis[J]. Transportation Research Record, 2003(1853): 150-156. [24] XU Qin-wu, SUN Zeng-zhi, WANG Hu, et al. Laboratorytesting material property and FE modeling structural responseof PAM-modified concrete overlay on concrete bridges[J]. Journal of Bridge Engineering, 2009, 14(1): 26-35. -

 DownLoad:


 点击查看大图

计量
- 文章访问数: 919
- HTML全文浏览量: 145
- PDF下载量: 1122
- 被引次数: 0
