Evaluation of international dry bulk shipping market
-
摘要: 应用因子分析法, 建立了国际干散货航运市场评价指标体系, 对国际干散货航运市场进行了综合评价。通过国际干散货航运市场综合评价值与波罗的海干散货综合运价指数的标准化值进行比较, 发现前者可以全面地反映国际干散货航运市场的综合情况。结果表明, 因子分析法是进行国际干散货航运市场综合评价的有效方法。Abstract: This paper studied the evaluation of international dry bulk shipping market by factor analysis, its index system was developed. Through the comparison to baltic freight index, it was pointed that the evaluation result can reflect the main trend of international dry bulk shipping market. The result indicates that factor analysis is an effective measurement for evaluating international dry bulk shipping market.
-
表 1 评价指标体系
Table 1. Evaluation index system
运力供给 船舶供给量 船舶闲置量 运力需求 干散货海运量 运价 波罗的海综合运价指数 航运成本 燃油价格 相关市场 造船市场 新船价格 拆船市场 拆船价格 表 2 评价指标
Table 2. Evaluation indices
指标 变量 单位 波罗的海干散货综合运价指数 X1 船舶供给量 X2 106 DWT 船舶闲置量 X3 106 DWT 燃油价格 X4 美元/t 国际干散货海运量 X5 106 t 新船价格 X6 百万美元/艘 拆船价格 X7 百万美元/艘 注: (1)燃油价格: 考虑到新加坡港是国际著名的补给港, 因此采用新加坡港的HFO价格作为燃油价格; (2)新船价格: 采用远东120000 DWT新船的订造价; (3)拆船价格: 采用远东120000 DWT船舶的拆船价。 表 3 指标的相关系数矩阵
Table 3. Correlation matrix of indices
X1 X2 X3 X4 X5 X6 X7 X1 1.000 X2 -0.049 1.000 X3 0.320 -0.320 1.000 X4 0.179 -0.067 -0.504 1.000 X5 0.030 0.397 -0.622 0.473 1.000 X6 0.491 0.027 0.569 -0.334 -0.316 1.000 X7 0.274 0.258 0.622 -0.417 -0.282 0.603 1.000 表 4 计算结果
Table 4. Computational result
主成分 F1 F2 F3 F4 F5 F6 F7 特征值λi 3.025 1.487 1.268 0.407 0.353 0.317 0.144 方差贡献率/% 43.209 21.240 18.110 5.814 5.047 4.527 2.052 累计方差贡献率/% 43.209 64.449 82.559 88.374 93.421 97.948 100 表 5 公因子负载和方差
Table 5. Component matrix and communalities
公因子负载 公因子方差 F1 F2 F3 X1 0.373 0.531 0.672 0.873 X2 -0.156 0.716 -0.610 0.909 X3 0.902 -0.157 0.124 0.854 X4 -0.631 0.226 0.593 0.801 X5 -0.677 0.573 0.016 0.786 X6 0.779 0.360 0.140 0.756 X7 0.764 0.399 -0.237 0.800 表 6 旋转后的公因子特征值和方差贡献率
Table 6. Rotated eigenvalues and communalities
公因子 特征值 方差贡献率/% 累计方差贡献率/% F1 2.321 33.154 33.154 F2 2.004 28.623 61.777 F3 1.455 20.782 82.559 表 7 旋转后的公因子负载和公因子方差
Table 7. Rotated component matrix and communalities
公因子负载 公因子方差 F1 F2 F3 X1 0.251 0.895 -0.090 0.873 X2 -0.027 0.005 0.953 0.909 X3 -0.666 0.526 -0.365 0.854 X4 0.889 0.059 -0.083 0.801 X5 0.692 -0.069 0.550 0.786 X6 -0.415 0.763 0.038 0.756 X7 -0.609 0.578 0.307 0.800 表 8 公因子系数
Table 8. Factors coefficients
F1 F2 F3 X1 0.312 0.565 -0.086 X2 -0.099 -0.002 0.676 X3 -0.203 0.172 -0.197 X4 0.472 0.208 -0.139 X5 0.289 0.096 0.325 X6 -0.065 0.359 0.066 X7 -0.225 0.214 0.273 表 9 国际干散货航运市场1993~2001综合评价值
Table 9. Evaluation result of international dry bulk shipping market in 1993~2001
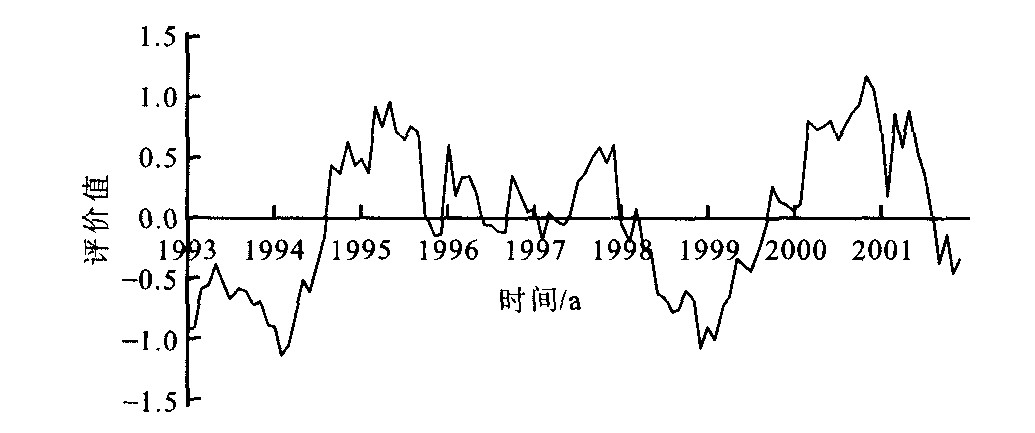
月 年 1993 1994 1995 1996 1997 1998 1999 2000 2001 1 -0.92 -0.90 0.47 0.59 0.06 -0.05 -0.91 0.06 0.75 2 -0.92 -1.15 0.36 0.16 -0.19 -0.22 -1.01 0.11 0.16 3 -0.60 -1.06 0.92 0.33 0.04 0.06 -0.72 0.80 0.86 4 -0.56 -0.81 0.74 0.34 -0.04 -0.28 -0.66 0.72 0.58 5 -0.38 -0.52 0.95 0.20 -0.07 -0.28 -0.34 0.76 0.89 6 -0.55 -0.62 0.71 -0.07 0.01 -0.64 -0.41 0.80 0.54 7 -0.68 -0.40 0.64 -0.06 0.28 -0.66 -0.45 0.64 0.34 8 -0.59 -0.16 0.75 -0.12 0.36 -0.78 -0.29 0.76 0.03 9 -0.60 0.44 0.71 -0.12 0.50 -0.77 -0.06 0.88 -0.39 10 -0.72 0.36 0.02 0.34 0.58 -0.60 0.26 0.93 -0.15 11 -0.69 0.63 -0.15 0.20 0.44 -0.67 0.13 1.17 -0.48 12 -0.88 0.43 -0.14 0.04 0.60 -1.09 0.10 1.06 -0.35 -
[1] 陈家源, 佟成权. 国际航运市场学[M]. 大连: 大连海事大学出版社, 1995. [2] 郭志刚. 社会统计分析方法[M]. 北京: 中国人民大学出版社, 1999. [3] 王增民. 因子分析法在企业经济效益综合分析与评价中的应用[J]. 数理统计与管理, 2002, 21(1): 10-13. https://www.cnki.com.cn/Article/CJFDTOTAL-SLTJ200201002.htmWANG Zeng-min. Asynthetic evaluation on the economic benefitof enterprises and the application of main composition method[J]. Application of Statistics and Management, 2002, 21(1): 10-13. (in Chinese) https://www.cnki.com.cn/Article/CJFDTOTAL-SLTJ200201002.htm [4] 程毛林. 城镇生态系统的因子分析[J]. 数理统计与管理, 2002, 21(1): 19-24. https://www.cnki.com.cn/Article/CJFDTOTAL-SLTJ200201004.htmCHENG Mao-lin. Factor analysison ecological systemof towns[J]. Application of Statistics and Management, 2002, 21(1): 19-24. (in Chinese) https://www.cnki.com.cn/Article/CJFDTOTAL-SLTJ200201004.htm [5] Lloyd's MIU. Dry bulk[J]. Lloyd's Shipping Economist, 1993, 15(2): 39-42. [6] 张文彤. SPSS统计分析教程(高级篇)[M]. 北京: 北京希望电子出版社, 2002. -


 下载:
下载:


