

Method for identifying low-accessibility areas and their contributing factors in public transit accessibility to integrated passenger transportation hubs
-
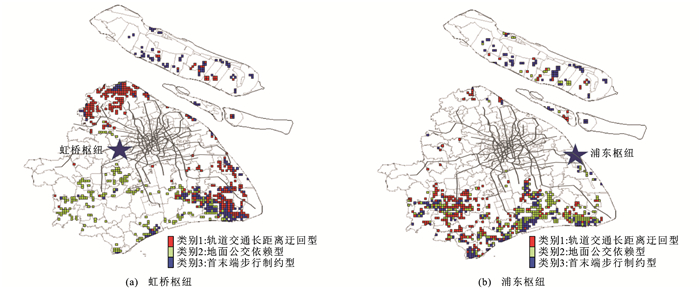
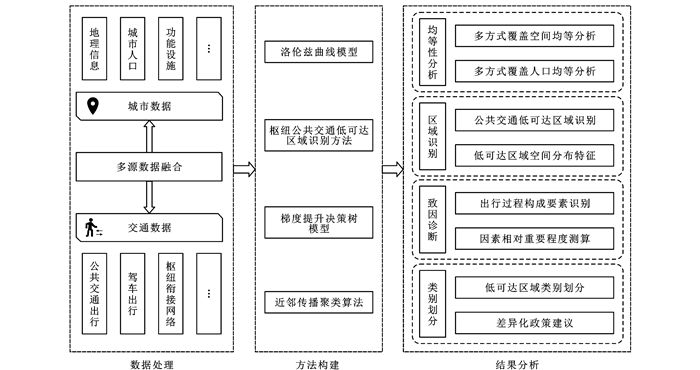
摘要: 针对大规模综合客运枢纽公共交通网络低可达区域及致因难识别的问题,提出了基于可达性的枢纽公共交通服务诊断框架;测度不同可达时间下枢纽多方式网络覆盖空间范围与人口规模,利用洛伦兹曲线模型,分析了不同枢纽公共交通可达空间范围与人口规模的均等性;建立枢纽公共交通低可达区域识别方法,研究了枢纽公共交通服务中低可达区域范围及其分布特征;引入了梯度提升决策树模型,从出行过程构成视角解析特征变量对枢纽公共交通可达时间的影响;设计了面向低可达区域的近邻传播聚类算法,划分不同类别枢纽公共交通低可达区域;使用上海虹桥枢纽和浦东枢纽多方式交通网络开展实例分析。研究结果表明:虽然虹桥枢纽公共交通可达性总体优于浦东枢纽,但在均等性上表现欠佳,可达性区域分异特征较大;虹桥枢纽的公共交通低可达区域呈现多核心离散分布格局,而浦东枢纽则呈现条状集聚形态;在造成枢纽公共交通低可达性区域的致因方面,步行距离对虹桥枢纽的相对影响程度最大(31%),其次是路网非直线系数(29%)和地面公交乘车站数(21%);步行距离对浦东枢纽的相对影响程度上升至37%,其次是地面公交乘车站数(26%)和公共交通线网非直线系数(18%);基于主要影响因素,2个枢纽的公共交通低可达区域被划分为首末端步行制约型、地面公交依赖型、轨道交通长距离迂回型3个类别。Abstract: Regarding the challenge of identifying low-accessibility areas and their contributing factors in public transit accessibility to large-scale integrated passenger transportation hubs, a diagnostic framework was proposed for hub transit services based on accessibility. The spatial coverage and population served by multimodal networks were measured across different accessibility time thresholds. The Lorenz curve model was applied to assess the equity of spatial and population coverage across different hubs. A method was established to identify low-accessibility areas in hub public transit services, examining their spatial extent and distribution patterns. A gradient boosting decision tree model was introduced to analyze how various travel chain components affect hub accessibility from a behavioral perspective. An affinity propagation clustering algorithm targeting low-accessibility areas was designed to categorize distinct types of poorly connected zones. A case study was conducted using multimodal transportation networks at Hongqiao and Pudong hubs in Shanghai. Research results show that although Hongqiao hub generally has better public transit accessibility than Pudong hub, it performs worse in terms of equity, with more pronounced spatial disparities. Low-accessibility areas to Hongqiao exhibit a multi-core, dispersed pattern, while those to Pudong show a linear, clustered distribution. Regarding the contributing factors to low accessibility, walking distance has the greatest relative impact on Hongqiao hub (31%), followed by the road network detour index (29%) and the number of surface bus stops (21%). For Pudong hub, walking distance's influence increases to 37%, followed by the number of bus stops (26%) and the public transit network detour index (18%). Based on these key factors, the low-accessibility areas to both hubs were categorized into three types: first-and-last-mile walking-constrained, bus-dependent, and long-distance detouring rail transit.
-

图 1 枢纽公共交通可达性服务诊断框架
Figure 1. Service diagnostic framework for public transit accessibility to transportation hub

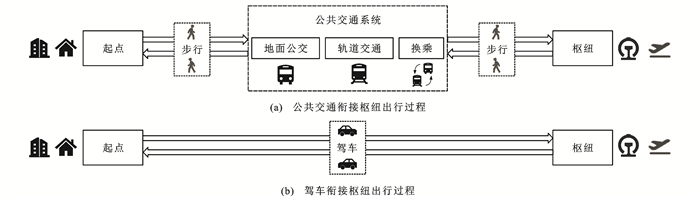
图 3 枢纽公共交通与驾车出行过程
Figure 3. Accessing process to transportation hubs by public transit and car

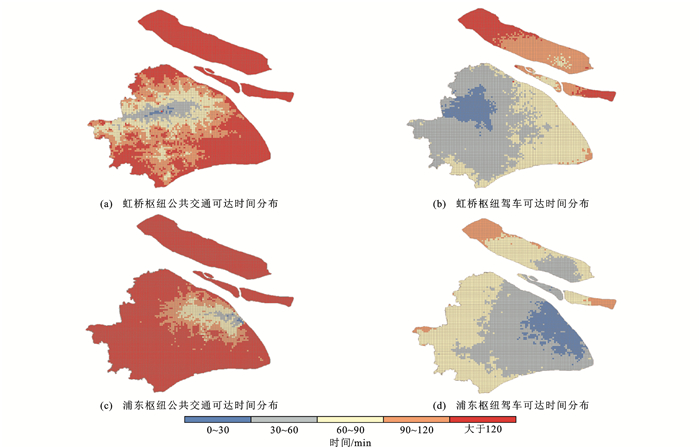
图 4 枢纽公共交通与驾车可达时间分布
Figure 4. Distribution of accessibility to transportation hubs by public transit and car

图 5 枢纽不同交通方式覆盖面积与人口分布
Figure 5. Distribution of areas and population accessing to transportation hubs by different modes

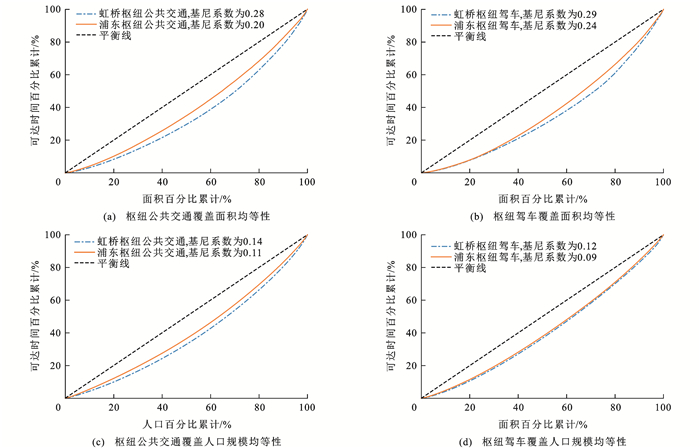
图 6 枢纽公共交通与驾车可达均等性
Figure 6. Equity of the accessibility to transportation hubs by public transit and car

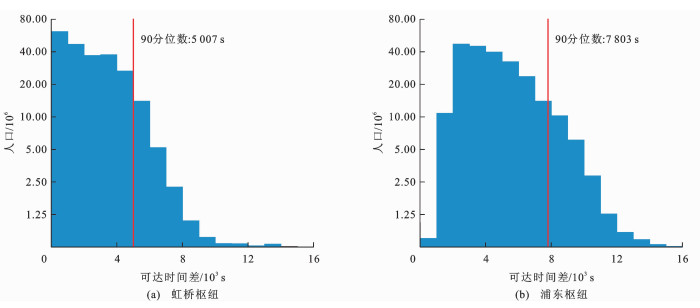
图 8 枢纽覆盖人口与公共交通和驾车可达时间差值分布
Figure 8. Distribution of population and the difference in accessibility time to transportation hubs by public transit and car

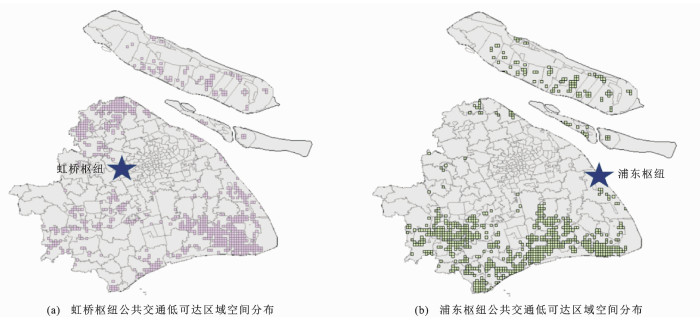
图 9 枢纽公共交通低可达区域空间分布
Figure 9. Spatial distribution of areas with low accessibility to transportation hubs by public transit

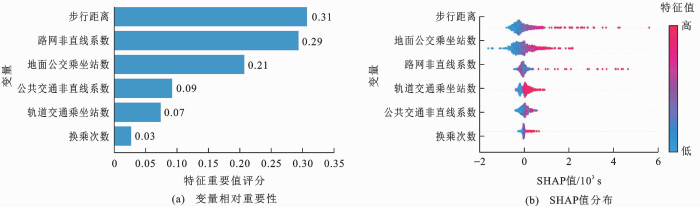
图 10 虹桥枢纽各影响变量相对重要性
Figure 10. Relative importance of influencing factors for Hongqiao transportation hub

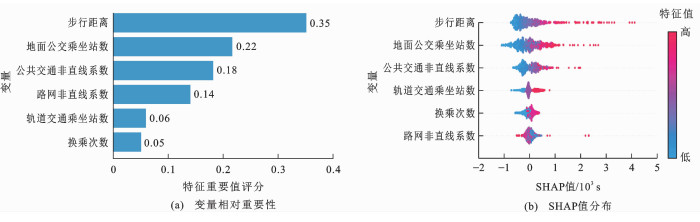
图 11 浦东枢纽各影响变量相对重要性
Figure 11. Relative importance of influencing factors for Pudong transportation hub

图 12 枢纽公共交通低可达区域类别空间分布
Figure 12. Spatial distributions of clusters in areas with low accessibility to transportation hubs by public transit
表 1 虹桥枢纽公共交通低可达区域聚类分析结果
Table 1. Spatial cluster results of areas with low accessibility to Hongqiao transportation hub by public transit
类别 栅格数量 可达时间差值/s 轨道交通站数/个 地面公交站数/个 步行距离/m 公共交通非直线系数 路网非直线系数 1 246 5 343±302 25±2 11±6 1 608±563 1.78±0.29 1.39±0.10 2 151 5 366±438 1±1 26±9 1 608±733 1.55±0.20 1.43±0.12 3 360 6 978±768 16±2 23±9 2 525±965 1.67±0.16 1.44±0.09 平均 252 6 125 16 20 2 044 1.68 1.43  下载: 导出CSV
表 2 浦东枢纽公共交通低可达区域聚类分析结果
Table 2. Spatial cluster results of areas with low accessibility to Pudong transportation hub by public transit
类别 栅格数量 可达时间差值/s 轨道交通站数/个 地面公交站数/个 步行距离/m 公共交通非直线系数 路网非直线系数 1 264 8 223±268 24±4 15±7 1 802±553 1.76±0.22 1.33±0.10 2 261 8 815±344 10±3 34±9 1 870±669 1.82±0.19 1.39±0.13 3 258 10 453±748 21±3 27±6 2 759±898 2.09±0.29 1.40±0.10 平均 261 9 167 19 26 2 140 1.89 1.38
下载: 导出CSV
表 3 枢纽公共交通低可达区域典型案例
Table 3. Typical cases of areas with low accessibility to transportation hubs by public transit
区域类别 中心点坐标 栅格人口 公共交通时间/s 驾车时间/s 公共交通非直线系数 路网非直线系数 轨道交通长距离迂回型 (31.267°N, 121.167°E) 3 795 7 702 1 626 3.45 1.58 (31.627°N, 121.487°E) 1 493 15 883 4 203 2.27 1.37 地面公交依赖型 (30.917°N, 121.077°E) 1 075 8 625 3 248 1.78 1.39 (30.847°N, 121.497°E) 2 256 13 373 3 368 1.50 1.49 首末端步行制约型 (31.467°N, 121.317°E) 3 598 10 932 3 556 1.72 1.28 (30.807°N, 121.447°E) 1 116 15 083 3 788 2.38 1.43
下载: 导出CSV
-
[1] 黄世玉, 杨敏, 王哲源, 等. 高铁枢纽衔接城市交通网络的动静态可达性分析[J]. 交通运输研究, 2023, 9(3): 57-72.HUANG Shi-yu, YANG Min, WANG Zhe-yuan, et al. Dynamic and static accessibility analysis of high-speed rail hub connecting urban transport network[J]. Transportation Standardization, 2023, 9(3): 57-72. [2] 高巍, 欧阳玉歆, 赵玫, 等. 公共服务设施可达性度量方法研究综述[J]. 北京大学学报(自然科学版), 2023, 59(2): 344-354.GAO Wei, OUYANG Yu-xin, ZHAO Mei, et al. A review on accessibility measurements of public service facilities[J]. Acta Scientiarum Naturalium Universitatis Pekinensis, 2023, 59(2): 344-354. [3] 刘纪平, 曹元晖, 王勇, 等. 利用网络泛地图资源评价15 min生活圈医疗服务可达性: 以上海市为例[J]. 武汉大学学报(信息科学版), 2022, 47(12): 2054-2063.LIU Ji-ping, CAO Yuan-hui, WANG Yong, et al. Evaluating the accessibility of medical services in the 15 min life circle using Internet pan-map resources: A case study in Shanghai[J]. Geomatics and Information Science of Wuhan University, 2022, 47(12): 2054-2063. [4] MARWAL A, SILVA E. Literature review of accessibility measures and models used in land use and transportation planning in last 5 years[J]. Journal of Geographical Sciences, 2022, 32(3): 560-584. doi: 10.1007/s11442-022-1961-1 [5] MILLER E J. Accessibility: Measurement and application in transportation planning[J]. Transport Reviews, 2018, 38(5): 551-555. doi: 10.1080/01441647.2018.1492778 [6] TAO T, CAO J. Exploring nonlinear and collective influences of regional and local built environment characteristics on travel distances by mode[J]. Journal of Transport Geography, 2023, 109: 103599. doi: 10.1016/j.jtrangeo.2023.103599 [7] FU X, LAM W H K, CHEN B Y, et al. Maximizing space-time accessibility in multi-modal transit networks: An activity-based approach[J]. Transportmetrica A: Transport Science, 2022, 18(2): 192-220. doi: 10.1080/23249935.2020.1806372 [8] TAO T, WANG J Y, CAO X Y. Exploring the non-linear associations between spatial attributes and walking distance to transit[J]. Journal of Transport Geography, 2020, 82: 102560. doi: 10.1016/j.jtrangeo.2019.102560 [9] LIU R, CHEN Y, WU J P, et al. Mapping spatial accessibility of public transportation network in an urban area—A case study of Shanghai Hongqiao transportation hub[J]. Transportation Research Part D: Transport and Environment, 2018, 59: 478-495. doi: 10.1016/j.trd.2018.01.003 [10] 黄洁, 石雯茜, 陈娱. 居民出行视角下的北京市双枢纽机场可达性研究[J]. 地球信息科学学报, 2022, 24(5): 914-924.HUANG Jie, SHI Wen-qian, CHEN Yu. Accessibility of Beijing dual hub airports from the perspective of residential travel[J]. Journal of Geo-Information Science, 2022, 24(5): 914-924. [11] CHENG L, CHEN Y H, HE S Y, et al. Comparing accessibility to high-speed rail stations by public transit and cars: A national-scale analysis[J]. Journal of Transport Geography, 2025, 123: 104105. doi: 10.1016/j.jtrangeo.2024.104105 [12] 于博宁, 陈学武. 基于可达性分析的高铁站公交集散效能评估[C]// 中国公路学会, 中国航海学会, 中国铁道学会. 2024世界交通运输大会(WTC2024)论文集(交通工程). 北京: 人民交通出版社, 2024: 306-311.YU Bo-ning, CHEN Xue-wu. Evaluation of high-speed rail station bus dispersal efficiency based on accessibility analysis[C]// China Highway and Transportation Society, China Institute of Navigation, China Railway Society. Proceedings of the 2024 World Transport Convention (WTC2024)—Traffic Engineering. Beijing: China Communications Press, 2024: 306-311. [13] 郑姝婕, 陈学武, 齐超. 大城市高速铁路枢纽公共交通可达性提升研究[C]//中国科学技术协会, 交通运输部, 中国工程院, 等. 2022世界交通运输大会(WTC2022)论文集(交通工程与航空运输篇). 北京: 人民交通出版社, 2022: 1782-1786.ZHENG Shu-jie, CHEN Xue-wu, QI Chao. Research on improving public transport accessibility of high-speed rail hubs in megacities[C]//China Association for Science and Technology, Ministry of Transport, Chinese Academy of Engineering, et al. Proceedings of the 2022 World Transport Convention (WTC2022)—Traffic Engineering and Air Transport. Beijing: China Communications Press, 2022: 1782-1786. [14] MARTÍN J C, ROMÁN C, GARCÍA-PALOMARES J C, et al. Spatial analysis of the competitiveness of the high-speed train and air transport: The role of access to terminals in the Madrid-Barcelona corridor[J]. Transportation Research Part A: Policy and Practice, 2014, 69: 392-408. doi: 10.1016/j.tra.2014.09.010 [15] MOYANO A, MOYA-GÓMEZ B, GUTIÉRREZ J. Access and egress times to high-speed rail stations: A spatiotemporal accessibility analysis[J]. Journal of Transport Geography, 2018, 73: 84-93. doi: 10.1016/j.jtrangeo.2018.10.010 [16] ASHIK F R, ISLAM M S, ALAM M S, et al. Dynamic equity in urban amenities distribution: An accessibility-driven assessment[J]. Applied Geography, 2024, 164: 103199. doi: 10.1016/j.apgeog.2024.103199 [17] SHARMA G, PATIL G R. Urban spatial structure and equity for urban services through the lens of accessibility[J]. Transport Policy, 2024, 146: 72-90. doi: 10.1016/j.tranpol.2023.10.017 [18] 杨鹏, 黄洁, 王姣娥, 等. 中国农村物流末端配送网点可达性与公平性测度[J]. 地理学报, 2024, 79(11): 2739-2753.YANG Peng, HUANG Jie, WANG Jiao-e, et al. Measuring accessibility and equity of rural logistics terminal facilities in China[J]. Acta Geographica Sinica, 2024, 79(11): 2739-2753. [19] ZINIA F A, BHANDARI P, TUFFOUR J P, et al. Evaluating social equity of transit accessibility: A case of Salt Lake County, U.S. [J]. Transportation Research Record: Journal of the Transportation Research Board, 2023, 2677(12): 806-814. doi: 10.1177/03611981231170005 [20] GIANNOTTI M, BARROS J, TOMASIELLO D B, et al. Inequalities in transit accessibility: Contributions from a comparative study between Global South and North Metropolitan regions[J]. Cities, 2021, 109: 103016. doi: 10.1016/j.cities.2020.103016 [21] SHAVER H, KIM J, DIAB E, et al. Bridging the gap: A social equity analysis of intra-city transit access to inter-city rail in Canada[J]. Cities, 2025, 163: 106041. doi: 10.1016/j.cities.2025.106041 [22] ZHAO X L, YAN X, YU A L, et al. Prediction and behavioral analysis of travel mode choice: A comparison of machine learning and logit models[J]. Travel Behaviour and Society, 2020, 20: 22-35. doi: 10.1016/j.tbs.2020.02.003 [23] CHEN E H, YE Z R, WU H. Nonlinear effects of built environment on intermodal transit trips considering spatial heterogeneity[J]. Transportation Research Part D: Transport and Environment, 2021, 90: 102677. doi: 10.1016/j.trd.2020.102677 [24] DING C, CAO X J, NSS P. Applying gradient boosting decision trees to examine non-linear effects of the built environment on driving distance in Oslo[J]. Transportation Research Part A: Policy and Practice, 2018, 110: 107-117. doi: 10.1016/j.tra.2018.02.009 [25] DING C, CAO X Y, LIU C. How does the station-area built environment influence metrorail ridership? Using gradient boosting decision trees to identify non-linear thresholds[J]. Journal of Transport Geography, 2019, 77: 70-78. doi: 10.1016/j.jtrangeo.2019.04.011 [26] DING C, CAO X Y, WANG Y P. Synergistic effects of the built environment and commuting programs on commute mode choice[J]. Transportation Research Part A: Policy and Practice, 2018, 118: 104-118. doi: 10.1016/j.tra.2018.08.041 [27] MA X W, TIAN X L, CUI H J, et al. What influences intermodal choices: Metro-centric, bus-centric, hybrid? Insights from machine learning approaches[J]. Transportation Research Part D: Transport and Environment, 2024, 136: 104407. doi: 10.1016/j.trd.2024.104407 [28] 陈启香, 吕斌, 李显林. 站域建成环境对出租车-地铁组合出行的非线性影响[J]. 交通运输工程学报, 2024, 24(5): 285-300. doi: 10.19818/j.cnki.1671-1637.2024.05.019CHEN Qi-xiang, LYU Bin, LI Xian-lin. Nonlinear effect of station-area built environment on taxi-metro combined travel[J]. Journal of Traffic and Transportation Engineering, 2024, 24(5): 285-300. doi: 10.19818/j.cnki.1671-1637.2024.05.019 [29] LEI J Y, HE M, SHI Z B, et al. How does the built environment affect intermodal transit demand across different spatiotemporal contexts[J]. Journal of Transport Geography, 2024, 121: 104033. doi: 10.1016/j.jtrangeo.2024.104033 [30] DELBOSC A, CURRIE G. Using Lorenz curves to assess public transport equity[J]. Journal of Transport Geography, 2011, 19(6): 1252-1259. doi: 10.1016/j.jtrangeo.2011.02.008 [31] SHAFIQ M, LOBO A, COUTO A. Equity of access to rail services by complementary motorized and active modes[J]. Journal of Transport Geography, 2024, 121: 104007. doi: 10.1016/j.jtrangeo.2024.104007 [32] GAO W X, CUI M C, PAN E T, et al. Green commuting within the x-minute city: Towards a systematic evaluation of its feasibility[J]. Journal of Transport Geography, 2024, 121: 104003. doi: 10.1016/j.jtrangeo.2024.104003 [33] ACHEAMPONG R A, ASABERE S B. Urban expansion and differential accessibility by car and public transport in the Greater Kumasi city-region, Ghana: A geospatial modelling approach[J]. Journal of Transport Geography, 2022, 98: 103257. doi: 10.1016/j.jtrangeo.2021.103257 [34] FRIEDMAN J H. Greedy function approximation: A gradient boosting machine[J]. The Annals of Statistics, 2001, 29(5): 1189-1232. doi: 10.1214/aos/1013203450 [35] SHKERA A, PATANKAR V. Assessing non-linear influences of urban layout on driving travel distance: A mumbai case study[J]. The Open Transportation Journal, 2024, 18: e26671212348646. doi: 10.2174/0126671212348646241003061532 [36] XIAO L Z, LO S, LIU J X, et al. Nonlinear and synergistic effects of TOD on urban vibrancy: Applying local explanations for gradient boosting decision tree[J]. Sustainable Cities and Society, 2021, 72: 103063. doi: 10.1016/j.scs.2021.103063 [37] WANG J B, JASON CAO X, LIU K, et al. Exploring the nonlinear effects of built environment characteristics on customized bus service[J]. Transportation Research Part D: Transport and Environment, 2023, 114: 103523. doi: 10.1016/j.trd.2022.103523 [38] ZHANG Y R, HAGHANI A. A gradient boosting method to improve travel time prediction[J]. Transportation Research Part C: Emerging Technologies, 2015, 58: 308-324. doi: 10.1016/j.trc.2015.02.019 [39] 阎莹, 王玉莹, 周旋, 等. 基于混合模型的自动驾驶车辆事故严重程度影响因素分析[J]. 交通运输工程学报, 2025, 25(1): 184-196. doi: 10.19818/j.cnki.1671-1637.2025.01.013YAN Ying, WANG Yu-ying, ZHOU Xuan, et al. Analysis of autonomous vehicle accident severity factors based on hybrid model[J]. Journal of Traffic and Transportation Engineering, 2025, 25(1): 184-196. doi: 10.19818/j.cnki.1671-1637.2025.01.013 [40] FREY B J, DUECK D. Mixture modeling by affinity propagation[J]. Advances in Neural Information Processing Systems, 2005, 18: 1-8. [41] GUO X, YANG Z X, LI C, et al. Combining the classic vulnerability index and affinity propagation clustering algorithm to assess the intrinsic aquifer vulnerability of coastal aquifers on an integrated scale[J]. Environmental Research, 2023, 217: 114877. doi: 10.1016/j.envres.2022.114877 [42] WEI Z X, HE D Q, JIN Z Z, et al. Density-based affinity propagation tensor clustering for intelligent fault diagnosis of train bogie bearing[J]. IEEE Transactions on Intelligent Transportation Systems, 2023, 24(6): 6053-6064. doi: 10.1109/TITS.2023.3253087 [43] ZHAO Y L, YANG L T, ZHANG R H. A tensor-based multiple clustering approach with its applications in automation systems[J]. IEEE Transactions on Industrial Informatics, 2018, 14(1): 283-291. doi: 10.1109/TII.2017.2748800 [44] DENG Z L, LI L N, DU Y J. Can polycentric urban morphology improve transportation carbon emission efficiency? Evidence from 285 Chinese cities, 2005—2020[J]. Transportation, 2024: 1-28. [45] MENG M X, SHANG Y P, YANG Y. Did highways cause the urban polycentric spatial structure in the Shanghai metropolitan area?[J]. Journal of Transport Geography, 2021, 92: 103022. doi: 10.1016/j.jtrangeo.2021.103022 [46] 袁晓玲, 王书蓓, 贺斌. 中国城市多中心发展格局演化及驱动因素研究[J]. 城市问题, 2023(12): 60-69.YUAN Xiao-ling, WANG Shu-bei, HE Bin. The evolution and driving factors of polycentric development pattern in Chinese cities[J]. Urban Problems, 2023(12): 60-69. [47] ZHANG T L, CHEN WW, SUN B D. The mechanism for the intra-city employment growth: The role of employment centers[J]. Cities, 2025, 160: 105810. doi: 10.1016/j.cities.2025.105810 [48] XU Y M, YAN X, LIU X Y, et al. Identifying key factors associated with ridesplitting adoption rate and modeling their nonlinear relationships[J]. Transportation Research Part A: Policy and Practice, 2021, 144: 170-188. doi: 10.1016/j.tra.2020.12.005 [49] LIU X, CHEN X H, POTOGLOU D, et al. Travel impedance, the built environment, and customized-bus ridership: A stop-to-stop level analysis[J]. Transportation Research Part D: Transport and Environment, 2023, 122: 103889. doi: 10.1016/j.trd.2023.103889 [50] TU M T, LI W X, ORFILA O, et al. Exploring nonlinear effects of the built environment on ridesplitting: Evidence from Chengdu[J]. Transportation Research Part D: Transport and Environment, 2021, 93: 102776. doi: 10.1016/j.trd.2021.102776 [51] GAN Z X, YANG M, FENG T, et al. Examining the relationship between built environment and metro ridership at station-to-station level[J]. Transportation Research Part D: Transport and Environment, 2020, 82: 102332. doi: 10.1016/j.trd.2020.102332 [52] 胡迪. 上海南部地区多层次轨道交通网络布局[J]. 城市轨道交通研究, 2023(增2): 19-22.HU Di. Layout of multi-level rail transit network in Shanghai southern region[J]. Urban Mass Transit, 2023(S2): 19-22. [53] 胡康琼. 基于长三角一体化的上海轨道交通融合发展策略[J]. 城市轨道交通研究, 2024, 27(1): 6-10, 16.HU Kang-qiong. Shanghai rail transit integration development strategy based on Yangtze River Delta integration[J]. Urban Mass Transit, 2024, 27(1): 6-10, 16. -


计量
- 文章访问数: 9
- HTML全文浏览量: 6
- PDF下载量: 1
- 被引次数: 0
