| Citation: | LU Qing-chang, LIU Peng, XU Biao, CUI Xin. Resilience-based protection decision optimization for metro network under operational incidents[J]. Journal of Traffic and Transportation Engineering, 2023, 23(3): 209-220. doi: 10.19818/j.cnki.1671-1637.2023.03.016

|
| P(ηnm=α)=λαnmα!e−λnmα=0,1,⋯ | (1) |
| λnm=λj | (2) |
In the formula:jNumber of subway stations.
Using logarithmic normal distribution to represent failed subway stations under operational eventsnmProbability characteristics of required recovery time
| P(dnm=β)=1βσnm√2πe−[ln(β)−μnm]22σ2nmβ>0 | (3) |
Based on equation (3), subway stations under operational eventsnmThe remaining recovery time is determined by a variableste, nmDescription, ifste, nm=0 indicates that the simulated operational event did not occur at the sitenmOtherwise, the subway stationnmThe recovery timeste, nmdodnm.
After an operational event occurs, the efficiency of subway network operation and passenger transportation are important indicators for evaluating network performance. This article constructs a performance evaluation index L (t) based on network operational efficiency, namely
| L(t)=∑n(f1,t0,nz1,t0,n+f2,t0,nz2,t0,n)+∑aft0,azt0,a∑n(f1,t,nz1,t,n+f2,t,nz2,t,n)+∑aft,azt,a | (4) |
In the formula:f1, t0, nandf2, t0, nBefore the occurrence of operational eventst0Always pass through any station in the transportation networkn(n∈N)The inbound and outbound passenger flow;ft0, aPrior to the occurrence of operational eventst0Always pass through the road sectionaFoot traffic;z1, t0, nandz2, t0, nBefore the occurrence of operational eventst0Time StationnImpedance of entry time and exit time;zt0, aPrior to the occurrence of operational eventst0Time sectionaTime impedance;f1, t, nandf2, t, nAfter the operational event, respectivelytTime passes through the sitenThe inbound and outbound passenger flow;ft, aAfter the operation eventtAlways pass through the road sectionaPassenger flow;z1, t, nandz2, t, nAfter the operational event, respectivelytTime StationnImpedance of entry time and exit time;zt, aAfter the operation eventtTime sectionaThe time impedance.
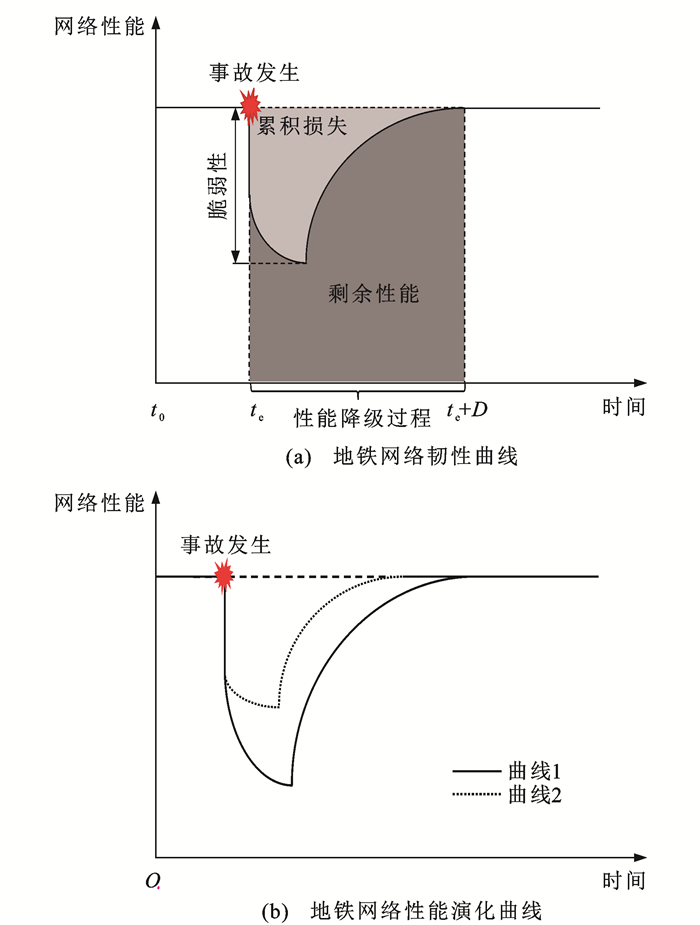
| R=∫te+Dte1−L(t)dt≈∑i∈k[1−L(ti)]Δt | (5) |
In the formula:L(ti)FortiTime network performance.
According to equation (5),RThe smaller the size, the smaller the performance loss during the recovery process, and the higher the resilience of the subway network.
This article proposes a two-layer optimization model based on resilience to solve the optimization problem of protection decisions in subway networks. The upper level model is an optimization model for subway network protection decisions, with the objective function being the expectationRMinimum, that is, the cumulative performance loss during the entire process of performance degradation and recovery is minimized. The decision variable is the protection status of each subway station, and the objective function isE(R)For
| minE(R)=E{∑i[1−L(ti)]Δt} | (6) |
| {t1=tetk=te+D−ΔtΔt=ti+1−ti | (7) |
| L(te+D)=1 | (8) |
| ∑nmynm⩽ | (9) |
| s_{t_{\mathrm{e}}, n_{\mathrm{m}}} y_{n_{\mathrm{m}}}=0 | (10) |
| y_{n_{\mathrm{m}}} \in\{0, 1\} | (11) |
In the formula:ynmAs a 0-1 decision variable, if the subway stationnmProtected,ynm=1. Otherwiseynm0BTo protect the budget, determine the maximum number of sites that can be protected.
Equation (6) minimizesRExpectations; Equation (7) is the discrete-time set calculated by the model; Equation (8) constrains network performance inte+DAlways restore to the level before the operation event; Equation (9) is a budget constraint, which means that the number of protected subway stations does not exceed the budgetBEquation (10) limits the operation recovery time of any protected road section to 0; Equation (11) is for protecting decision variablesynmThe binary constraint.
| \begin{array}{l} \min Z_{t_i}(f)=\sum\limits_a z_{t_i, a}+\sum\limits_{n_{\mathrm{m}}} \int_0^{f_{1, t_i, n_{\mathrm{m}}}} z_{1, t_i, n_{\mathrm{m}}}(x) \mathrm{d} x+ \\ \sum\limits_{n_{\mathrm{b}}} \int_0^{f_{1, t_i, n_{\mathrm{b}}}} z_{1, t_i, n_{\mathrm{b}}}(x) \mathrm{d} x+\sum\limits_{n_{\mathrm{m}}} z_{2, t_i, n_{\mathrm{m}}}+ \\ \sum\limits_{n_{\mathrm{b}}} z_{2, t_i, n_{\mathrm{b}}} \end{array} | (12) |
| \sum\limits_u f_{t_i, u, w}=q_w | (13) |
| f_{t_i, a}=\sum\limits_w \sum\limits_u f_{t_i, u, w} \delta_{t_i, a, u, w} | (14) |
| f_{1, t_i, n_{\mathrm{m}}}=\sum\limits_{w w} \sum\limits_u f_{t_i, u, w} \delta_{1, t_i, n_{\mathrm{m}}, u, w} | (15) |
| f_{1, t_i, n_{\mathrm{b}}}=\sum\limits_w \sum\limits_u f_{t_i, u, w} \delta_{1, t_i, n_{\mathrm{b}}, u, w} | (16) |
| f_{2, t_i, n_{\mathrm{m}}}=\sum\limits_w \sum\limits_u f_{t_i, u, w} \delta_{2, t_i, n_{\mathrm{m}}, u, w} | (17) |
| f_{2, t_i, n_{\mathrm{b}}}=\sum\limits_w \sum\limits_u f_{t_i, u, w} \delta_{2, t_i, n_{\mathrm{b}}, u, w} | (18) |
| f_{t_i, u, w} \geqslant 0 | (19) |
| z_{1, t_i, n_{\mathrm{m}}}(x)=\frac{H_{n_{\mathrm{m}}}}{2}+\left\lceil\frac{F_{t_{i-1}, n_{\mathrm{m}}}+x}{C_{n_{\mathrm{m}}}}\right\rceil H_{n_{\mathrm{m}}}+s_{t_i, n_{\mathrm{m}}} | (20) |
| z_{2, t_i, n_{\mathrm{m}}}=\frac{z_{\mathrm{d}, n_{\mathrm{m}}}}{\zeta_{t_i, n_{\mathrm{m}}}} | (21) |
| z_{1, t_i, n_{\mathrm{b}}}(x)=\frac{H_{n_{\mathrm{b}}}}{2}+\left\lceil\frac{F_{t_{i-1}, n_{\mathrm{b}}}+x}{C_{n_{\mathrm{b}}}}\right\rceil H_{n_{\mathrm{b}}} | (22) |
| z_{2, t_i, n_{\mathrm{b}}}=z_{\mathrm{d}, n_{\mathrm{b}}} | (23) |
| z_{t_i, a}=z_{\mathrm{d}, a} \quad a \in\left\{A_{\mathrm{x}}, A_{\mathrm{m}_1}, A_{\mathrm{m}_2}, A_{\mathrm{b}}\right\} | (24) |
| F_{t_i, n_{\mathrm{m}}}=F_{t_{i-1}, n_{\mathrm{m}}}+f_{1, t_i, n_{\mathrm{m}}}-\left\lfloor\frac{\Delta t}{H_{n_{\mathrm{m}}}}\right\rfloor C_{n_{\mathrm{m}}} \zeta_{t_i, n_{\mathrm{m}}} | (25) |
| F_{t_i, n_{\mathrm{b}}}=F_{t_{i-1}, n_{\mathrm{b}}}+f_{1, t_i, n_{\mathrm{b}}}-\left\lfloor\frac{\Delta t}{H_{n_{\mathrm{b}}}}\right\rfloor C_{n_{\mathrm{b}}} | (26) |
| s_{t_i, n_{\mathrm{m}}}=s_{t_{\mathrm{e}}, n_{\mathrm{m}}}-(i-1) \Delta t | (27) |
| \zeta_{t_i, n_{\mathrm{m}}}= \begin{cases}1 & s_{t_i, n_{\mathrm{m}}}=0 \\ 0 & s_{t_i, n_{\mathrm{m}}}>0\end{cases} | (28) |
| F_{t_i, n_{\mathrm{m}}}, F_{t_i, n_{\mathrm{b}}} \geqslant 0 | (29) |
Equations (12) to (19) are standard user equilibrium allocation problems, where equation (12) is used to calculatetiThe equilibrium flow of the network at time, equation (13) represents that all travel demands can be met, and equations (14) to (18) are used to calculatetiAlways pass through the road sectionaAnd the sitenmandnbThe passenger flow is limited by equation (19)fti, u, wIs a non negative variable; Equations (20) to (23) are road resistance calculation functions, and equation (20) istiTime subway stationnmImpedance of station entry time, including the time passengers wait for the subway to arrive at the stationHnm/2[22]Recovery waiting timesti, nmWaiting time in line\left\lceil\frac{F_{t_{i-1}, n_{\mathrm{m}}}+x}{C_{n_{\mathrm{m}}}}\right\rceil H_{n_{\mathrm{m}}}Equation (21) istiTime subway stationnmThe impedance of departure time; Equation (22) istiTime Bus StopnbImpedance of station entry time, including the time passengers wait for the bus to arrive at the bus stopHnb/2. Waiting time in line\left\lceil\frac{F_{t_{i-1}, n_{\mathrm{b}}}+x}{C_{n_{\mathrm{b}}}}\right\rceil H_{n_{\mathrm{b}}}Equation (23) istiTime Bus StopnbThe impedance of departure time; Equation (24) represents the driving section inside the subway caram1∈Am1Bus routes within the busab∈AbTransfer sections between subway linesam2∈Am2Transfer section between bus and subwayax∈AxFixed time impedance; Formula (25) calculationtiTime subway stationnmAccumulated passenger flow, byti-1Accumulated passenger flow upon arrival at the station at any given timeFti-1, nm、tiThe passenger flow arriving at the momentf1, ti, nmandtiThe passenger flow leaving by subway at all times\left\lfloor\frac{\Delta t}{H_{n_{\mathrm{m}}}}\right\rfloor C_{n_{\mathrm{m}}} \zeta_{t_i, n_{\mathrm{m}}}Decision, and only for subway stationsnmNormal operation, i.eζti, nm=Passengers can only leave the station at 1 o'clock; Formula (26) calculationtiAlways at the bus stopnbAccumulated passenger flow at the station, byti-1Accumulated passenger flow over timeFti-1, nb、tiThe passenger flow arriving at the momentf1, ti, nbandtiPassenger flow leaving by bus at all times\left\lfloor\frac{\Delta t}{H_{n_{\mathrm{b}}}}\right\rfloor C_{n_{\mathrm{b}}}decision; Formula (27) calculationtiTime subway stationnmRemaining operational recovery time; Equation (28) is used to determinetiThe operational status of each subway station at all times; Equation (29) isFti, nmandFti, nbNon negative constraints.
| 编号 | 站点名称 | 车头时距/min | 地铁列车容量/(人次·veh-1) | 正常运营路段客流/(人次·h-1) |
| 1 | 西北工业大学(5号线) | 4 | 560 | 2 232 |
| 2 | 边家村 | 4 | 460 | 2 127 |
| 3 | 省人民医院·黄雁村 | 4 | 460 | 2 505 |
| 4 | 南稍门(5号线) | 4 | 380 | 2 949 |
| 5 | 文艺路 | 4 | 440 | 1 428 |
| 6 | 建筑科技大学·李家村(5号线) | 4 | 540 | 2 547 |
| 7 | 太乙路 | 4 | 560 | 1 242 |
| 8 | 雁翔路北口 | 4 | 560 | 1 482 |
| 9 | 青龙寺(5号线) | 4 | 480 | 1 389 |
| 10 | 青龙寺(3号线) | 3 | 480 | 1 563 |
| 11 | 北池头 | 3 | 480 | 1 299 |
| 12 | 大雁塔(3号线) | 3 | 320 | 3 852 |
| 13 | 小寨(3号线) | 3 | 380 | 3 624 |
| 14 | 吉祥村 | 3 | 480 | 2 568 |
| 15 | 太白南路 | 3 | 480 | 2 103 |
| 16 | 科技路(3号线) | 3 | 560 | 2 985 |
| 17 | 科技路(6号线) | 4 | 560 | 2 307 |
| 18 | 西北工业大学(6号线) | 4 | 560 | 2 307 |
| 19 | 南稍门(2号线) | 2 | 360 | 2 565 |
| 20 | 建筑科技大学·李家村(4号线) | 4 | 400 | 2 343 |
| 21 | 体育场 | 2 | 400 | 1 629 |
| 22 | 西安科技大学 | 4 | 400 | 1 341 |
| 23 | 小寨(2号线) | 2 | 340 | 2 820 |
| 24 | 大雁塔(4号线) | 4 | 280 | 2 682 |
 DownLoad:
CSV
DownLoad:
CSV
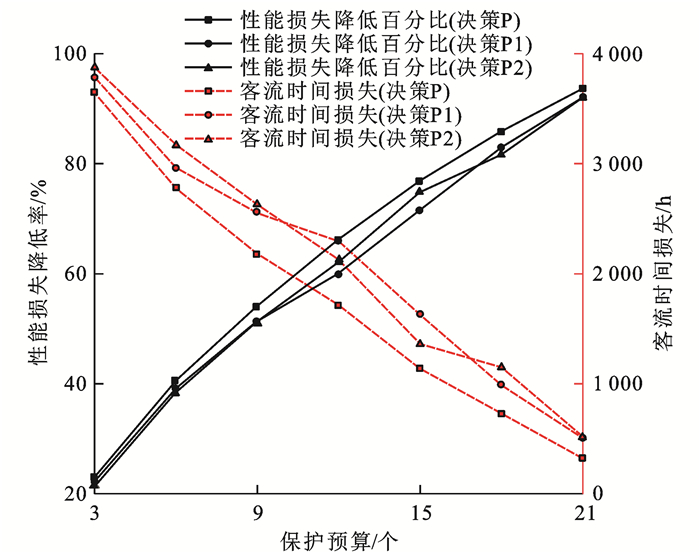
In order to verify the necessity and effectiveness of considering cumulative performance loss and bus network substitution in the optimization problem of subway protection decisions, this paper analyzes the proposed optimal protection decision P, vulnerability based protection decision P1, and protection decision P2 that only considers the subway network. Protect decision P1 based on the degree of network performance degradation at the time of the operational eventL(te)As the objective function, the cumulative performance loss during the performance degradation process was not taken into account. The protection decision P2 is only based on the analysis of the subway network, taking into account the cumulative performance loss, but does not consider the substitution effect of the public transportation network under operational events.
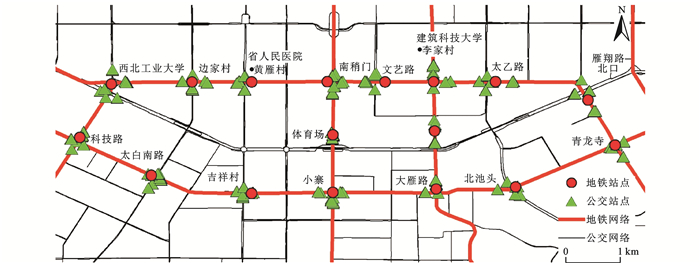
In order to visually describe the differences in protection priority levels among different stations, this article is based on the subway stationsB=3,B=Until 6B=At 21:00, the order of protection in the protection decision is divided into 8 protection priorities for the 24 subway stations in the study area, with 3 stations as one protection priority. of whichB=The protection priority of the protected site at 3 o'clock is the highest, with a protection priority of 1. The protection priority of the site that does not appear in any budget protection decisions is the lowest, with a protection priority of 8.Figure 7The change in protection priority from decision P2 to decision P for each subway station shows significant differences in the protection priority of 16 stations in 2 decisions, indicating that the ground bus network, as an important alternative to the subway network, will have an impact on subway protection decisions. Specifically, if the change in protection priority of a subway station is negative, then the station has a higher protection priority in the protection decision P2 that does not consider the substitution effect of buses, indicating that it relies more on the substitution effect of buses; Among the 14 transfer stations, only Dayan Pagoda Station (Line 3) and Xiaozhai Station (Line 3) have higher protection priority in protection decision P2; Among the 10 non transfer stations, Jixiang Village Station, Bianjia Village Station, Taibai South Road Station, Yanxiang Road North Exit Station, and Wenyi Road Station have higher protection priority in decision P2. The other 5 non transfer stations have the same protection priority in both decisions, and no station has a higher protection priority in decision P. This result indicates that overall, non transfer stations rely more on the substitution role of the public transportation network. Due to the lack of redundant subway lines at non transfer stations during operational events, they require alternative transportation options provided by other modes to ensure the topological connectivity of these stations. combineFigure 7andTable 1It can be seen that for the same type of station, the larger the passenger flow, the more dependent it is on the substitution effect of the public transportation network, such as a flow greater than 2500 people per hour-1The Huangyan Village Station and Jixiang Village Station of the Provincial People's Hospital rely most on the substitution effect of public transportation, with a flow of less than 1500 people per hour-1The Taiyi Road Station, Yanxiang Road North Exit Station, Sports Stadium Station, and Xi'an University of Science and Technology Station have the same protection priority in the two decisions. This is because the number of passengers who transfer to the bus network after these stations fail is relatively higher. Without the bus network as an alternative travel option, more passengers will be affected.

| 预算/个 | 韧性 | 保护决策站点选择 |
| 0 | 2.72 | 无 |
| 3 | 2.09 | 12、14、15 |
| 6 | 1.61 | 4、12、13、14、15、16 |
| 9 | 1.25 | 2、3、4、12、13、14、15、16、21 |
| 12 | 0.91 | 2、3、4、6、12、13、14、15、16、19、21、24 |
| 15 | 0.62 | 2、3、4、6、12、13、14、15、16、17、18、19、21、22、24 |
| 18 | 0.38 | 2、3、4、6、8、10、12、13、14、15、16、17、18、19、21、22、23、24 |
| 21 | 0.17 | 1、2、3、4、6、7、8、10、12、13、14、15、16、17、18、19、20、21、22、23、24 |
DownLoad:
CSV
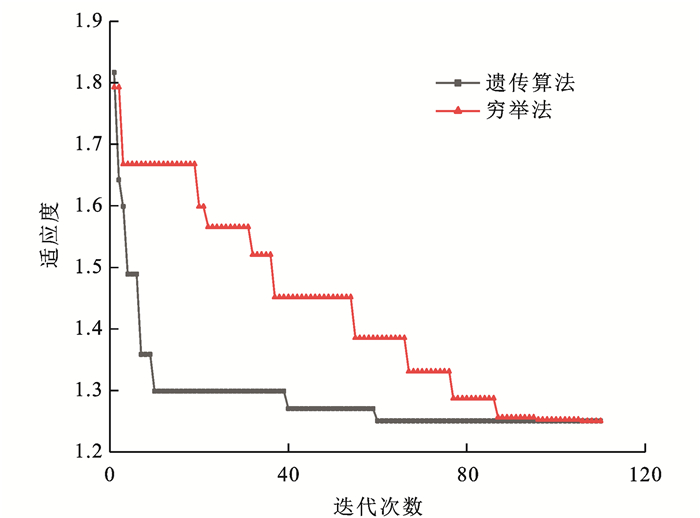
(1) Resilience based protection decisions are superior to vulnerability based protection decisions and protection decisions that do not consider the substitution effect of public transportation. When protecting a small number of sites in the network, vulnerability based protection decisions can provide similar protection effects as resilience based protection decisions, with a difference of less than 0.50% between the two; When there are many sites involved in the network, the difference in protection effectiveness between the two decisions can be significant, up to 6.18%. Therefore, resilience based protection decisions are suitable for major events that cause widespread network failure.
(4) The failure of the subway network under operational events will affect the normal operation of the public transportation network. Analyzing the resilience of the multi-mode transportation system coupled with the bus subway and carrying out protection decision optimization of the coupled transportation system will be the future research content.
| [1] |
LU Qing-chang. Modeling network resilience of rail transit under operational incidents[J]. Transportation Research Part A: Policy and Practice, 2018, 117: 227-237. doi: 10.1016/j.tra.2018.08.015
|
| [2] |
LIU Kai, ZHU Jia-tong, WANG Ming. An event-based probabilistic model of disruption risk to urban metro networks[J]. Transportation Research Part A: Policy and Practice, 2021, 147: 93-105. doi: 10.1016/j.tra.2021.03.010
|
| [3] |
ZHANG Shu-yang, LO H K, NG K F, et al. Metro system disruption management and substitute bus service: a systematic review and future directions[J]. Transport Reviews, 2021, 41(2): 230-251. doi: 10.1080/01441647.2020.1834468
|
| [4] |
MA Chao-qun, ZHANG Shuang, CHEN Quan, et al. Characteristics and vulnerability of rail transit network based on perspective of passenger flow characteristics[J]. Journal of Traffic and Transportation Engineering, 2020, 20(5): 208-216. (in Chinese) doi: 10.19818/j.cnki.1671-1637.2020.05.017
|
| [5] |
LU Qing-chang, ZHANG Lei, XU Peng-cheng, et al. Modeling network vulnerability of urban rail transit under cascading failures: a coupled map lattices approach[J]. Reliability Engineering and System Safety, 2022, 221: 108320. doi: 10.1016/j.ress.2022.108320
|
| [6] |
YAN Yong-ze, HONG Liu, HE Xiao-zheng, et al. Pre-disaster investment decisions for strengthening the Chinese railway system under earthquakes[J]. Transportation Research Part E: Logistics and Transportation Review, 2017, 105: 39-59. doi: 10.1016/j.tre.2017.07.001
|
| [7] |
CHEN Xue-wei, QIN Jin, ZHOU Ying-liang. Optimization of transportation network emergency prevention in uncertain environments[J]. Journal of Railway Science and Engineering, 2021, 18(5): 1307-1315. (in Chinese) doi: 10.19713/j.cnki.43-1423/u.T20200623
|
| [8] |
JIN Jian-gang, LU Lin-jun, SUN Li-jun, et al. Optimal allocation of protective resources in urban rail transit networks against intentional attacks[J]. Transportation Research Part E: Logistics and Transportation Review, 2015, 84: 73-87. doi: 10.1016/j.tre.2015.10.008
|
| [9] |
STARITA S, SCAPARRA M P. Optimizing dynamic investment decisions for railway systems protection[J]. European Journal of Operational Research, 2016, 248(2): 543-557. doi: 10.1016/j.ejor.2015.07.025
|
| [10] |
STARITA S, SCAPARRA M P. Passenger railway network protection: a model with variable post-disruption demand service[J]. Journal of the Operational Research Society, 2017, 64(4): 603-618.
|
| [11] |
SARHADI H, TULETT D M, VERMA M. An analytical approach to the protection planning of a rail intermodal terminal network[J]. European Journal of Operational Research, 2017, 257(2): 511-525. doi: 10.1016/j.ejor.2016.07.036
|
| [12] |
SONG Hong-yu, SHANGGUAN Wei, SHENG Zhao, et al. Optimization method of dynamic trajectory for high-speed train group based on resilience adjustment[J]. Journal of Traffic and Transportation Engineering, 2020, 21(4): 235-250. (in Chinese) doi: 10.19818/j.cnki.1671-1637.2021.04.018
|
| [13] |
LI Zhao-long, JIN Chun, HU Pan, et al. Resilience-based recovery strategy optimization in emergency recovery phase for transportation networks[J]. Systems Engineering—Theory and Practice, 2019, 39(11): 2828-2841. (in Chinese) https://www.cnki.com.cn/Article/CJFDTOTAL-XTLL201911010.htm
|
| [14] |
BEŠINOVIĆ N. Resilience in railway transport systems: a literature review and research agenda[J]. Transport Reviews, 2020, 40(4): 457-478. doi: 10.1080/01441647.2020.1728419
|
| [15] |
ZHANG Dong-ming, DU Fei, HUANG Hong-wei, et al. Resiliency assessment of urban rail transit networks: Shanghai Metro as an example[J]. Safety Science, 2018, 106: 230-243. doi: 10.1016/j.ssci.2018.03.023
|
| [16] |
ZHANG Jie-fei, REN Gang, MA Jing-feng, et al. Decision-making method of repair sequence for metro network based on resilience evaluation[J]. Journal of Transportation Systems Engineering and Information Technology, 2020, 20(4): 14-20. (in Chinese) https://www.cnki.com.cn/Article/CJFDTOTAL-YSXT202004003.htm
|
| [17] |
YIN Yong, CHEN Jin-qu, ZHU Man, et al. Repair strategies for failure of urban rail transit stations[J]. Journal of Southwest Jiaotong University, 2020, 55(4): 865-872. (in Chinese) https://www.cnki.com.cn/Article/CJFDTOTAL-XNJT202004024.htm
|
| [18] |
HUANG Ying, LIU Meng-ru, WEI Jin-guo, et al. Research on urban metro network recovery strategy based on resilience curve[J]. Journal of Catastrophology, 2021, 36(1): 32-36. (in Chinese) https://www.cnki.com.cn/Article/CJFDTOTAL-ZHXU202101007.htm
|
| [19] |
LYU Biao, GUAN Xin-yi, GAO Zi-qiang. Evaluation and optimal recovery strategy of metro network service resilience[J]. Journal of Transportation Systems Engineering and Information Technology, 2021, 21(5): 198-205, 221. (in Chinese) https://www.cnki.com.cn/Article/CJFDTOTAL-YSXT202105021.htm
|
| [20] |
CHEN Jin-qu, ZHANG Fan, PENG Qi-yuan, et al. Resilience assessment and partition of an urban rail transit station under large passenger flow[J]. Journal of Safety and Environment, 2022, 22(6): 2994-3002. (in Chinese) https://www.cnki.com.cn/Article/CJFDTOTAL-AQHJ202206008.htm
|
| [21] |
WANG J Y T, EHRGOTT M, CHEN A. A bi-objective user equilibrium model of travel time reliability in a road network[J]. Transportation Research Part B: Methodological, 2014, 66: 4-15.
|
| [22] |
CAI Hong, ZHU Jin-fu, YANG Cheng, et al. Vulnerability analysis of metro network incorporating flow impact and capacity constraint after a disaster[J]. Journal of Urban Planning and Development, 2017, 143(2): 04016031.
|
| [23] |
CHEN Jin-qu, LIU Jie, PENG Qi-yuan, et al. Resilience assessment of an urban rail transit network: a case study of Chengdu Subway[J]. Physica A: Statistical Mechanics and Its Applications, 2022, 586: 126517.
|
| [24] |
NOGAL M, O'CONNOR A, CAULFIELD B, et al. Resilience of traffic networks: from perturbation to recovery via a dynamic restricted equilibrium model[J]. Reliability Engineering and System Safety, 2016, 156: 84-96.
|
| [25] |
HOU Ben-wei, LI Xiao-jun, HAN Qiang, et al. Post-earthquake connectivity and travel time analysis of highway networks based on Monte Carlo simulation[J]. China Journal of Highway and Transport, 2017, 30(6): 287-296. (in Chinese) https://www.cnki.com.cn/Article/CJFDTOTAL-ZGGL201706012.htm
|
| [26] |
AYDIN N Y, DUZGUN H S, HEINIMANN H R, et al. Framework for improving the resilience and recovery of transportation networks under geohazard risks[J]. International Journal of Disaster Risk Reduction, 2018, 31: 832-843.
|
| [27] |
LI Shu-qing, LI Zhe, ZHU Wen-ying. Equilibrium assignment model of integrated transit network[J]. Journal of Traffic and Transportation Engineering, 2013, 13(1): 62-69. (in Chinese) doi: 10.19818/j.cnki.1671-1637.2013.01.010
|
| [28] |
KATO H, KANEKO Y, INOUE M. Comparative analysis of transit assignment: evidence from urban railway system in the Tokyo Metropolitan Area[J]. Transportation, 2010, 37: 775-799.
|
| [29] |
JUN M J, CHOI K, JEONG J E, et al. Land use characteristics of subway catchment areas and their influence on subway ridership in Seoul[J]. Journal of Transport Geography, 2015, 48: 30-40.
|
| [30] |
GORDON J B, KOUTSOPOULOS H N, WILSON N H M. Estimation of population origin-interchange-destination flows on multimodal transit networks[J]. Transportation Research Part C: Emerging Technologies, 2018, 90: 350-365.
|
| [1] | MA Fei, ZHAO Cheng-yong, SUN Qi-peng, CUI Rui-ying, MA Zhuang-lin, ZHU Yu-jie, WANG Zuo-hang. Integrated resilience of urban rail transit network with active passenger flow restriction under major public health disasters[J]. Journal of Traffic and Transportation Engineering, 2023, 23(1): 208-221. doi: 10.19818/j.cnki.1671-1637.2023.01.016 |
| [2] | ZHANG Song-liang, LI De-wei, YIN Yong-hao. Trip reservation and train operation plan optimization method of urban rail transit under demand responsive mechanism[J]. Journal of Traffic and Transportation Engineering, 2022, 22(4): 285-294. doi: 10.19818/j.cnki.1671-1637.2022.04.022 |
| [3] | HUI Yang, WANG Yong-gang, PENG Hui, HOU Shu-qian. Subway passenger flow prediction based on optimized PSO-BP algorithm with coupled spatial-temporal characteristics[J]. Journal of Traffic and Transportation Engineering, 2021, 21(4): 210-222. doi: 10.19818/j.cnki.1671-1637.2021.04.016 |
| [4] | XU De-jie, MAO Bao-hua, CHEN Shao-kuan, GONG Liang, ZENG Jun-wei. Optimization of operation scheme for full-length and short-turn routings considering operation proportion[J]. Journal of Traffic and Transportation Engineering, 2021, 21(2): 173-186. doi: 10.19818/j.cnki.1671-1637.2021.02.015 |
| [5] | YU Chao-jun, JIANG Ju, XU Hai-yan, ZHU Ping. Multi-objective optimization of flight-gate assignment based on improved genetic algorithm[J]. Journal of Traffic and Transportation Engineering, 2020, 20(2): 121-130. doi: 10.19818/j.cnki.1671-1637.2020.02.010 |
| [6] | PENG Qi-yuan, LIU Jie. Comprehensive coordination quantitative analysis of urban rail transit planning network and urban planning[J]. Journal of Traffic and Transportation Engineering, 2019, 19(3): 134-144. doi: 10.19818/j.cnki.1671-1637.2019.03.014 |
| [7] | ZHANG Tong, MAO Bao-hua, XU Qi, FENG Jia, TANG Ji-meng. Timetable optimization of tram considering energy saving goals[J]. Journal of Traffic and Transportation Engineering, 2019, 19(6): 171-181. doi: 10.19818/j.cnki.1671-1637.2019.06.016 |
| [8] | YANG Zhong-zhen, YU Shu-nan, CHEN Gang. Optimzation of mixed air cargo transportation network[J]. Journal of Traffic and Transportation Engineering, 2016, 16(1): 103-114. doi: 10.19818/j.cnki.1671-1637.2016.01.013 |
| [9] | WU Qi-bing, CHEN Feng, GAO Yong-xin, LI Xiao-hong, ZHAI Qing-sheng. Computation model of standing-passenger density in urban rail transit carriage[J]. Journal of Traffic and Transportation Engineering, 2015, 15(4): 101-109. doi: 10.19818/j.cnki.1671-1637.2015.04.013 |
| [10] | LEI Ding-you, YOU Wei, ZHANG Ying-gui, PI Zhi-dong. Path optimization model and algorithm of multimodal transport for long and bulky cargo[J]. Journal of Traffic and Transportation Engineering, 2014, 14(1): 75-83. |
| [11] | ZHU Hui-ling, JI Ming-jun. Optimal model and improved genetic algorithm of containership stowage on full route[J]. Journal of Traffic and Transportation Engineering, 2014, 14(5): 59-67. |
| [12] | CHEN Jin-jie, WANG Xing-ju, GAO Gui-feng. Blocking cost model of urban rail transit[J]. Journal of Traffic and Transportation Engineering, 2011, 11(2): 102-107. doi: 10.19818/j.cnki.1671-1637.2011.02.017 |
| [13] | LUO Xiao-qiang, CHEN Kuan-min. Determined models of optimal length for urban rail transit line[J]. Journal of Traffic and Transportation Engineering, 2010, 10(3): 62-66. doi: 10.19818/j.cnki.1671-1637.2010.03.011 |
| [14] | Feng Xue-jun, Wang Wei, Jiang Liu-peng. Optimization model and algorithm of port cluster system[J]. Journal of Traffic and Transportation Engineering, 2008, 8(3): 77-81. |
| [15] | An Xue-wu, Du Dian-hu, Ma Chao-qun, Zhou Wei. Computation model of network scale for urban rail transit based on traffic demand overflow[J]. Journal of Traffic and Transportation Engineering, 2008, 8(3): 82-85. |
| [16] | SHI Hong-guo, PENG Qi-yuan, GUO Han-ying. Traction calculation of urban mass transit[J]. Journal of Traffic and Transportation Engineering, 2004, 4(3): 30-33. |
| [17] | BU Lei, YIN Chuan-zhong, PU Yun. Genetic algorithm for optimal arrangement of general piece goods[J]. Journal of Traffic and Transportation Engineering, 2004, 4(4): 84-87. |
| [18] | CHANG Yun-tao, PENG Guo-xiong. Urban arterial road coordinate control based on genetic algorithm[J]. Journal of Traffic and Transportation Engineering, 2003, 3(2): 106-112. |
| [19] | XU Jin-liang, WANG Hai-jun, YANG Shao-wei. Optimization of highway profile based on genetic algorithms[J]. Journal of Traffic and Transportation Engineering, 2003, 3(2): 48-52. |
| [20] | NIU Hui-min, HU An-zhou. A class of nonlinear optimization models for location of station by genetic algorithm[J]. Journal of Traffic and Transportation Engineering, 2002, 2(1): 80-84. |
| 1. | 张开冉,殷苏平,蒋明君. 城市轨道交通网络韧性优化研究. 安全与环境学报. 2025(02): 527-535 .  | |
| 2. | 肖红,刘书君,王孝坤. 突发事件下地铁网络韧性评估及恢复策略研究. 铁道运输与经济. 2025(02): 161-171 . | |
| 3. | 封益航,胡斌,王莉丽,柯昌英. 基于NK模型的动态修复策略下物流网络抗毁性研究. 系统工程理论与实践. 2024(04): 1405-1420 . | |
| 4. | 马飞,蒋金凤,敖誉芸,马壮林,刘擎. 非均衡大客流冲击下城市轨道交通网络抗毁性建模及演化特征. 清华大学学报(自然科学版). 2024(10): 1717-1733 . | |
| 5. | 张洁斐,任刚,唐磊,杜建玮,顾厚煜,宋建华. 城市多模式交通网络韧性评估研究综述. 交通信息与安全. 2024(03): 102-113 . | |
| 6. | 吴鹏,李得伟. 时空视角下城市群铁路客运网络抵抗韧性. 清华大学学报(自然科学版). 2024(11): 1860-1869 . | |
| 7. | 王文,徐祝源,张文鸽. 物流系统韧性与提升策略. 物流科技. 2024(23): 14-17 . |

Figures(8) / Tables(2)
Copyright《Journal of Traffic and Transportation Engineering》编辑部陕ICP备05001904号-1
Address :Editorial Department of Journal of Traffic and Transportation Engineering, Chang 'an University, Middle Section of South Second Ring Road, Xi 'an, Shaanxi(710064) Tel:029-82334388 Email:jygc@chd.edu.cn
All visit:1713340Today's visit:1057
Supported by:
Beijing Renhe Information Technology Co. Ltd

LIU Xi-bin, MA Jian, HAO Ru-ru, SONG Qing-song. Design of regenerative braking energy feedback system for ultracapacitor heavy-duty tractor[J]. Journal of Traffic and Transportation Engineering, 2013, 13(2): 60-65. doi: 10.19818/j.cnki.1671-1637.2013.02.009

| 编号 | 站点名称 | 车头时距/min | 地铁列车容量/(人次·veh-1) | 正常运营路段客流/(人次·h-1) |
| 1 | 西北工业大学(5号线) | 4 | 560 | 2 232 |
| 2 | 边家村 | 4 | 460 | 2 127 |
| 3 | 省人民医院·黄雁村 | 4 | 460 | 2 505 |
| 4 | 南稍门(5号线) | 4 | 380 | 2 949 |
| 5 | 文艺路 | 4 | 440 | 1 428 |
| 6 | 建筑科技大学·李家村(5号线) | 4 | 540 | 2 547 |
| 7 | 太乙路 | 4 | 560 | 1 242 |
| 8 | 雁翔路北口 | 4 | 560 | 1 482 |
| 9 | 青龙寺(5号线) | 4 | 480 | 1 389 |
| 10 | 青龙寺(3号线) | 3 | 480 | 1 563 |
| 11 | 北池头 | 3 | 480 | 1 299 |
| 12 | 大雁塔(3号线) | 3 | 320 | 3 852 |
| 13 | 小寨(3号线) | 3 | 380 | 3 624 |
| 14 | 吉祥村 | 3 | 480 | 2 568 |
| 15 | 太白南路 | 3 | 480 | 2 103 |
| 16 | 科技路(3号线) | 3 | 560 | 2 985 |
| 17 | 科技路(6号线) | 4 | 560 | 2 307 |
| 18 | 西北工业大学(6号线) | 4 | 560 | 2 307 |
| 19 | 南稍门(2号线) | 2 | 360 | 2 565 |
| 20 | 建筑科技大学·李家村(4号线) | 4 | 400 | 2 343 |
| 21 | 体育场 | 2 | 400 | 1 629 |
| 22 | 西安科技大学 | 4 | 400 | 1 341 |
| 23 | 小寨(2号线) | 2 | 340 | 2 820 |
| 24 | 大雁塔(4号线) | 4 | 280 | 2 682 |
DownLoad:
CSV
| 预算/个 | 韧性 | 保护决策站点选择 |
| 0 | 2.72 | 无 |
| 3 | 2.09 | 12、14、15 |
| 6 | 1.61 | 4、12、13、14、15、16 |
| 9 | 1.25 | 2、3、4、12、13、14、15、16、21 |
| 12 | 0.91 | 2、3、4、6、12、13、14、15、16、19、21、24 |
| 15 | 0.62 | 2、3、4、6、12、13、14、15、16、17、18、19、21、22、24 |
| 18 | 0.38 | 2、3、4、6、8、10、12、13、14、15、16、17、18、19、21、22、23、24 |
| 21 | 0.17 | 1、2、3、4、6、7、8、10、12、13、14、15、16、17、18、19、20、21、22、23、24 |
DownLoad:
CSV
| 编号 | 站点名称 | 车头时距/min | 地铁列车容量/(人次·veh-1) | 正常运营路段客流/(人次·h-1) |
| 1 | 西北工业大学(5号线) | 4 | 560 | 2 232 |
| 2 | 边家村 | 4 | 460 | 2 127 |
| 3 | 省人民医院·黄雁村 | 4 | 460 | 2 505 |
| 4 | 南稍门(5号线) | 4 | 380 | 2 949 |
| 5 | 文艺路 | 4 | 440 | 1 428 |
| 6 | 建筑科技大学·李家村(5号线) | 4 | 540 | 2 547 |
| 7 | 太乙路 | 4 | 560 | 1 242 |
| 8 | 雁翔路北口 | 4 | 560 | 1 482 |
| 9 | 青龙寺(5号线) | 4 | 480 | 1 389 |
| 10 | 青龙寺(3号线) | 3 | 480 | 1 563 |
| 11 | 北池头 | 3 | 480 | 1 299 |
| 12 | 大雁塔(3号线) | 3 | 320 | 3 852 |
| 13 | 小寨(3号线) | 3 | 380 | 3 624 |
| 14 | 吉祥村 | 3 | 480 | 2 568 |
| 15 | 太白南路 | 3 | 480 | 2 103 |
| 16 | 科技路(3号线) | 3 | 560 | 2 985 |
| 17 | 科技路(6号线) | 4 | 560 | 2 307 |
| 18 | 西北工业大学(6号线) | 4 | 560 | 2 307 |
| 19 | 南稍门(2号线) | 2 | 360 | 2 565 |
| 20 | 建筑科技大学·李家村(4号线) | 4 | 400 | 2 343 |
| 21 | 体育场 | 2 | 400 | 1 629 |
| 22 | 西安科技大学 | 4 | 400 | 1 341 |
| 23 | 小寨(2号线) | 2 | 340 | 2 820 |
| 24 | 大雁塔(4号线) | 4 | 280 | 2 682 |
| 预算/个 | 韧性 | 保护决策站点选择 |
| 0 | 2.72 | 无 |
| 3 | 2.09 | 12、14、15 |
| 6 | 1.61 | 4、12、13、14、15、16 |
| 9 | 1.25 | 2、3、4、12、13、14、15、16、21 |
| 12 | 0.91 | 2、3、4、6、12、13、14、15、16、19、21、24 |
| 15 | 0.62 | 2、3、4、6、12、13、14、15、16、17、18、19、21、22、24 |
| 18 | 0.38 | 2、3、4、6、8、10、12、13、14、15、16、17、18、19、21、22、23、24 |
| 21 | 0.17 | 1、2、3、4、6、7、8、10、12、13、14、15、16、17、18、19、20、21、22、23、24 |
 DownLoad:

 DownLoad:


