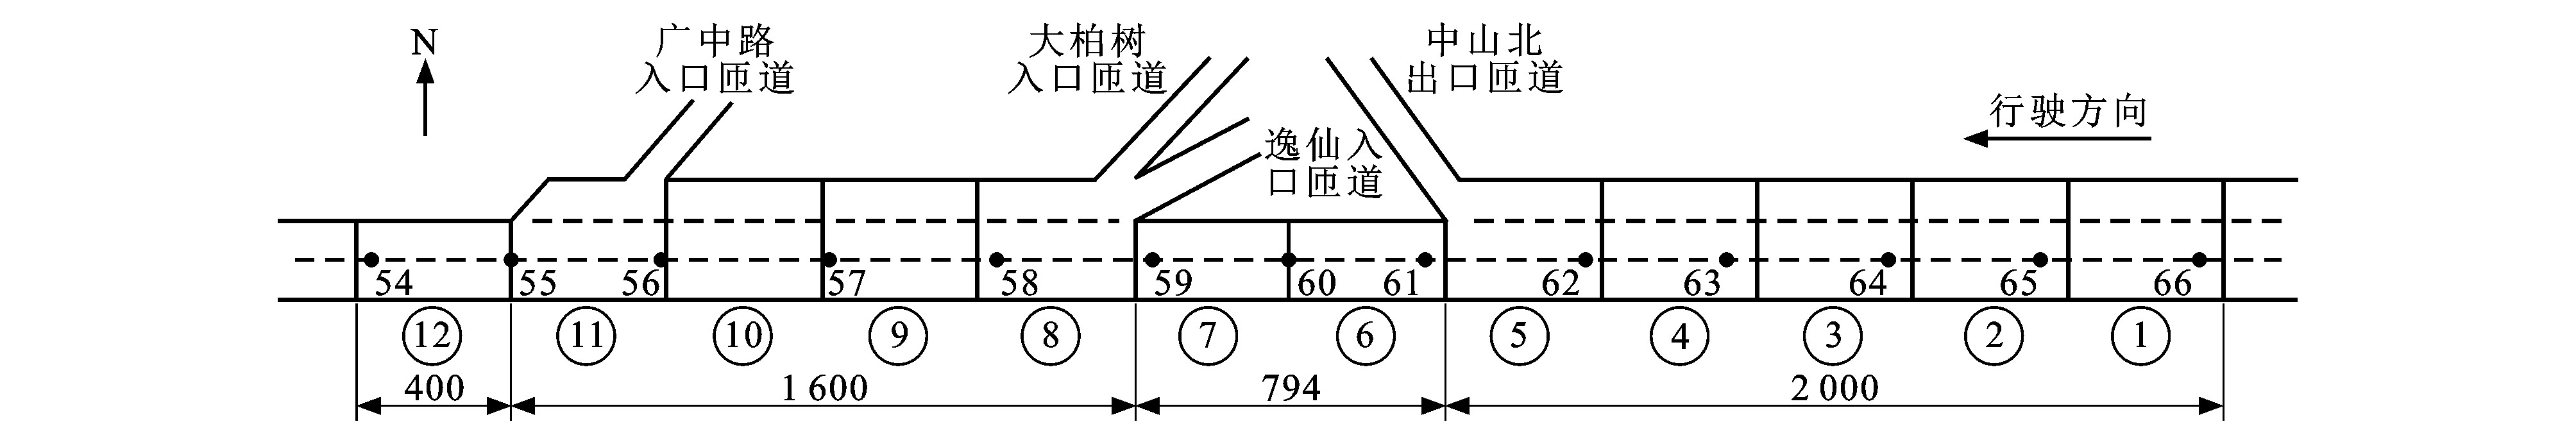
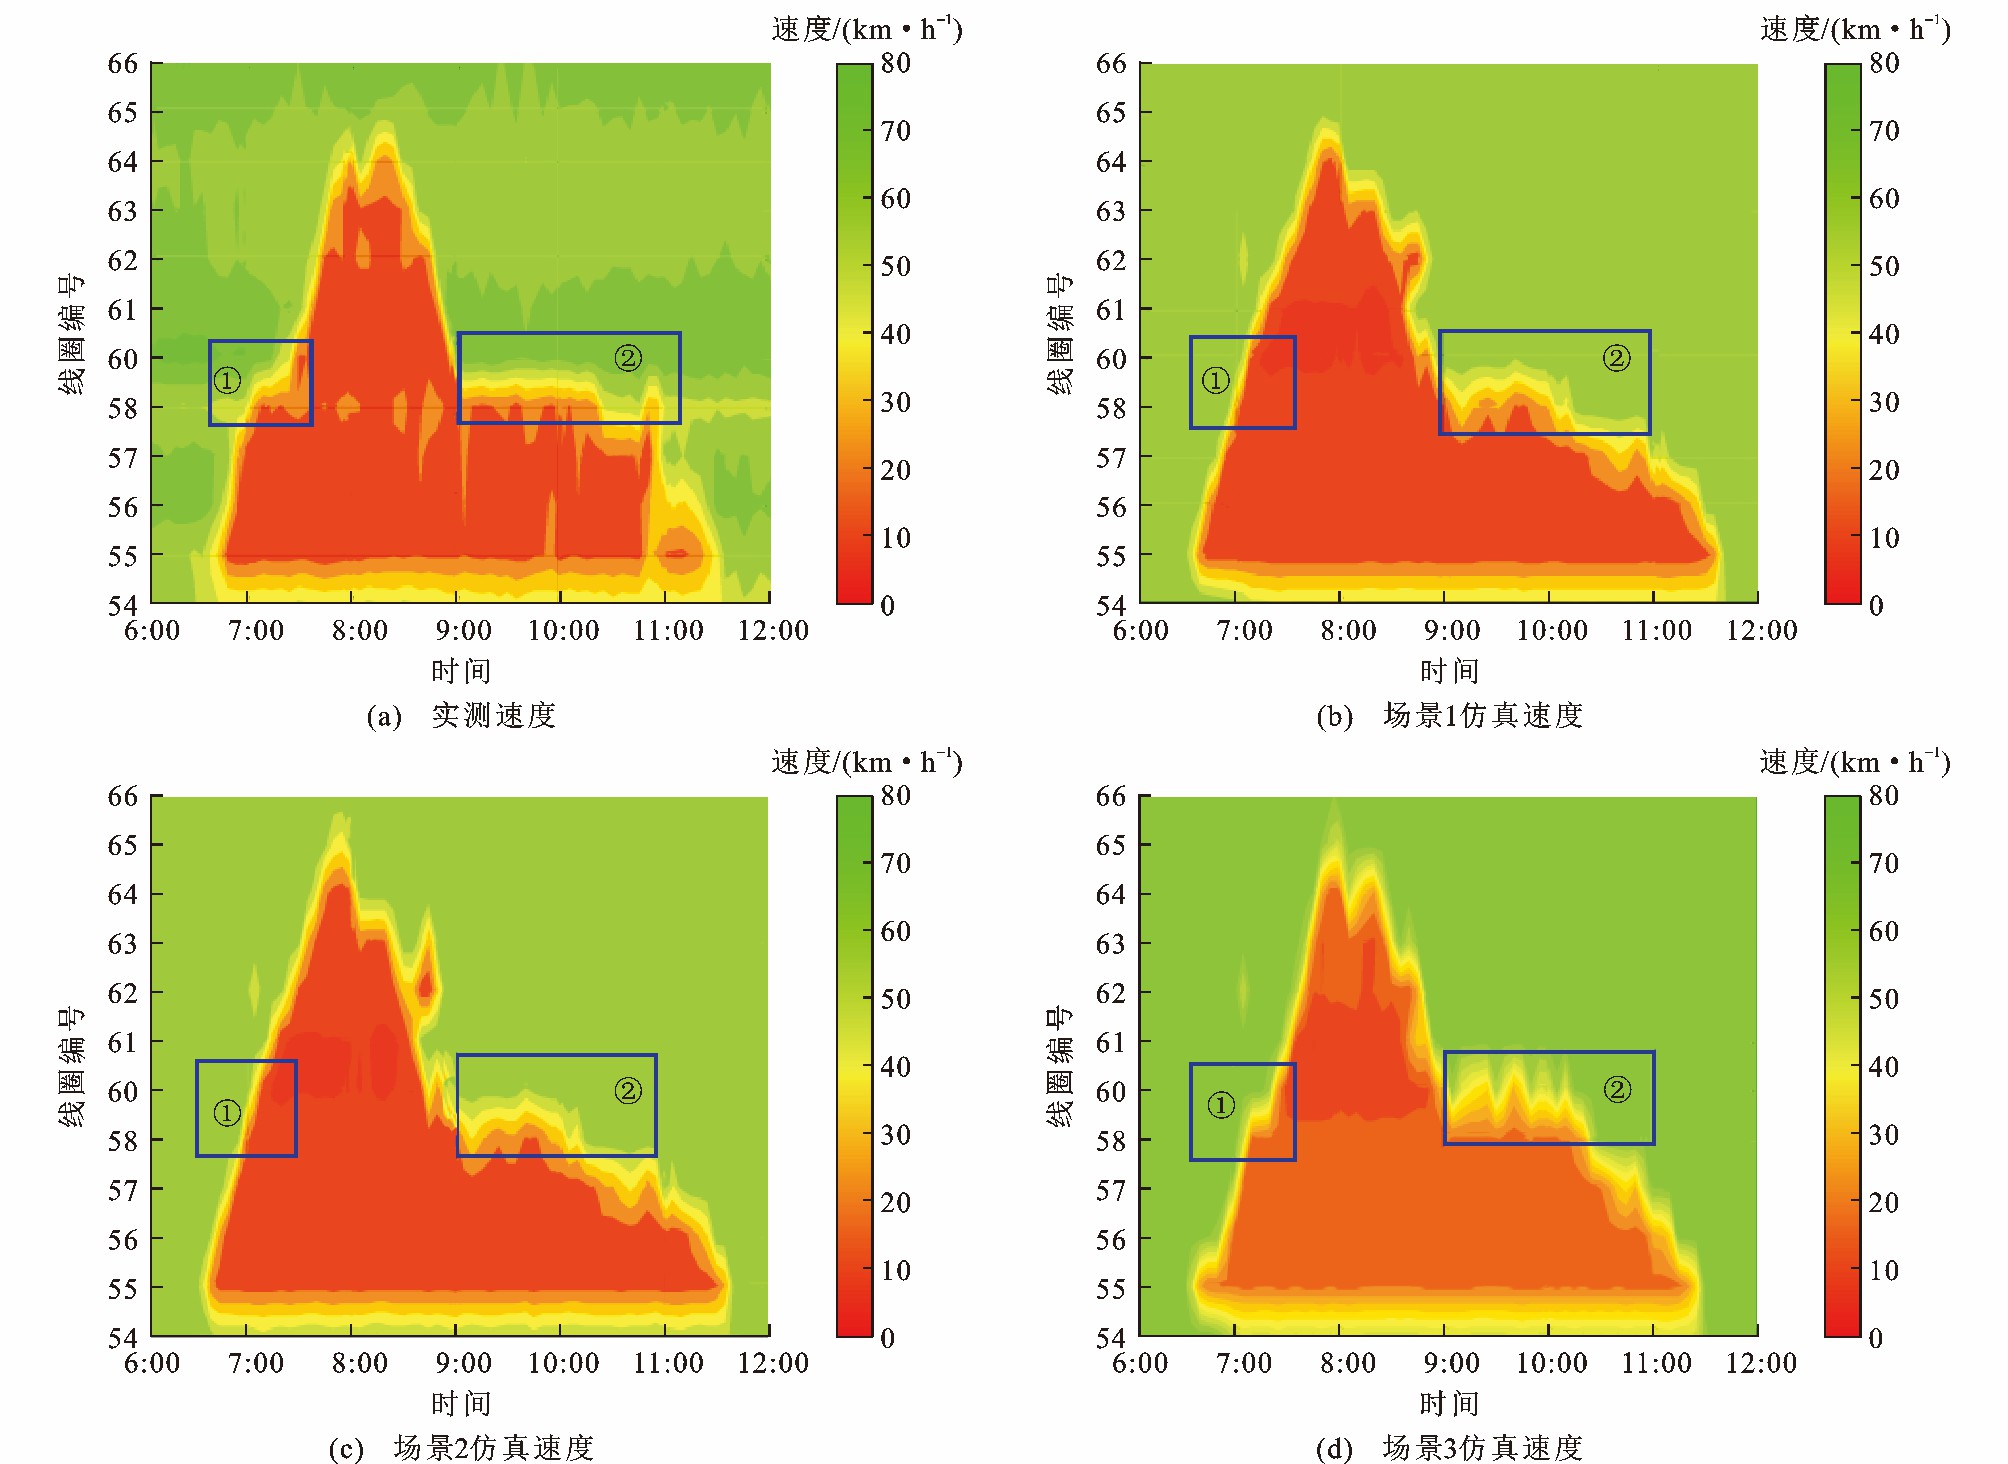
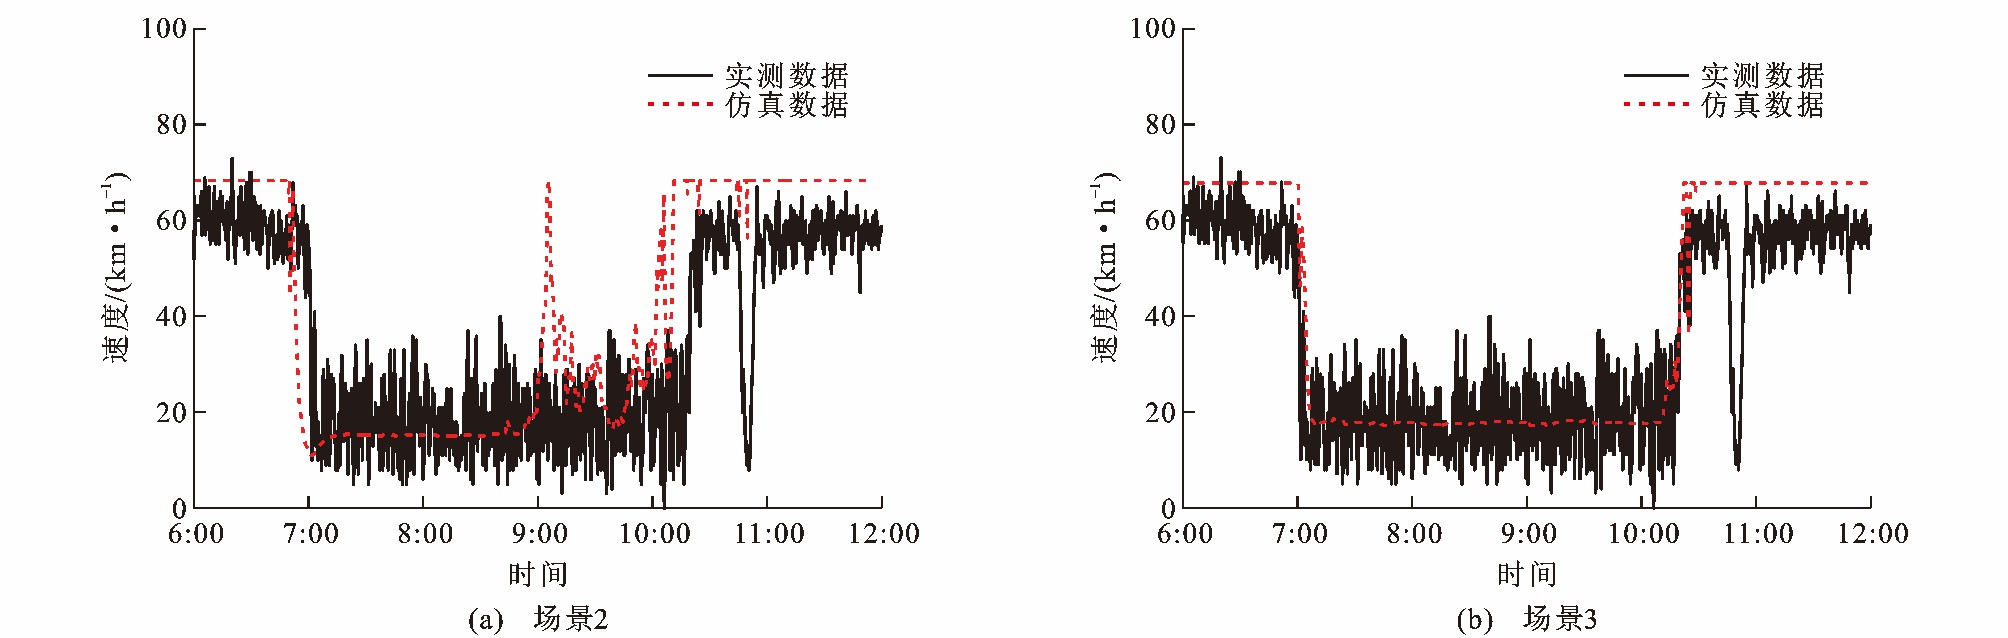
2019 Vol. 19, No. 3

Display Method:
Dynamic characteristics of gravel soil low embankment in Xinjiang
YANG Xiao-hua, WAN Qi, LIU Da-peng, BAO Han
Abstract: Based on the Sanchakou-Shache Expressway in Xinjiang, the subgrade model test with 1∶1 ratio was carried out within the influence range of one wheel for the standard axle load, and the dynamic characteristics of low embankment were studied under vehicle load. The different moisture content states of the subsoil in service in the oasis area were considered, the low embankment road structure was divided into four parts, including pavement, base, subgrade, and subsoil according to the general road design standards, the dynamic characteristics of low embankment under different loads were simulated, and the effects of peak values, frequencies and repetition times of dynamic loads on the dynamic characteristics were studied. Research result indicates that the vertical stresses under different loading cases decrease rapidly with the increase of subgrade depth, and attenuate by 69.2% at the depth of 0.8 m. The stresses at different depths vary linearly with the static and short-term dynamic load, while the strains show a nonlinear trend. Due to the modulus difference of different soil layers, the strains appear obvious stratification in the subgrade and subsoil. The change of water content of the subsoil has obvious influence on the dynamic characteristics of low embankment, and the strain at the top of the subsoil increases by 1.8 times when the water content increases from 18% to 28%.The increase of short-term dynamic load frequency has little effect on the stress and strain, and they decrease by 7% and 9%, respectively when the frequency increases from 1 Hz to 5 Hz at the tops of the subgrade and subsoil.When the peak values of static load, short-term dynamic load and long-term dynamic load are 50 kN at the tops of the subgrade and subsoil, the stress and strain under the short-term dynamic load are 79%-95% and 75%-95% of the values under the static load, respectively, while the stress and strain caused by the long-term dynamic load are 1.02-1.11 and 1.9-3.3 times of the values under the static load, respectively.More>
2019, 19(3): 1-9. doi: 10.19818/j.cnki.1671-1637.2019.03.001
Deformation properties of remolded loess under cyclic loading
WENG Xiao-lin, LI Hao, SHANG Xu-wen, JIA Yang, ZHOU Shang-qi, HU Ji-bo
Abstract: To study the effect of coupling changes in principal stress direction and magnitude on the stress-strain state and non-coaxiality of soil, a series of cyclic torsional shear tests were carried out on the saturated remolded loess by using a hollow cylindrical torsional shear apparatus, and the variation rules and influencing factors of stress-strain state and non-coaxial angle were analyzed. Experimental result shows that the axial strain is always in a compression state, the hoop strain accumulates negatively first and then positively, the radial strain is basically in a tension state, the tension and compression states of shear strain alternate, the fluctuation characteristics of axial, hoop and shear strain curves are obvious, while the fluctuation characteristic of radial strain curve is weak, indicating that each strain component shows different development laws under the cyclic loading. The axial and radial strains and the variation amplitudes of hoop and shear strains increase first and then decrease as the intermediate principal stress coefficient increases, indicating that the intermediate principal stress coefficient affects the cumulation of each strain component. With the increase of rotation range of principal stress direction angle, the axial and radial strains decrease gradually, the trend of hoop strain changing from negative to positive advances, and the variation amplitude of shear strain decreases gradually, indicating that the rotation range of principal stress direction angle affects the development trend of each strain component. The hysteresis phenomena of shear and normal differential stress-strain curves are obvious, and the stiffness consolidates cyclically, but the cyclic strengthening of shear stiffness is more obvious than that of normal differential stiffness, indicating that the secondary anisotropy occurs in the soil. This is an intrinsic cause of the non-coaxial phenomenon. The non-coaxial angle curve moves down first and then moves up as the intermediate principal stress coefficient increases, and moves up gradually as the cycle number increases. The variation range of non-coaxial angle curve increases as the deviating stress amplitude increases. Thus, the intermediate principal stress coefficient, cycle number and deviating stress amplitude can obviously affect the stress-strain state and non-coaxiality of saturated remolded loess, which should be considered in loess engineering design and constitutive relationship research.More>
2019, 19(3): 10-18. doi: 10.19818/j.cnki.1671-1637.2019.03.002
Influence of foam condition on foam expansion rate of base asphalt
HAN Yue-jie, DING Zhi-yong, WU You, LI Jun
Abstract: A 3 D modeling of asphalt generator was carried out by the modeling software Solidworks. The finite element simulation software Fluent was used to simulate the base asphalt foaming processes under different parameters, and the results from the experiment and the simulation were compared. The reliability of finite element simulation technology on the study of base asphalt foam expansion rate was analyzed. The finite element simulation was performed on the foaming cavity and fluid materials inside the foaming cavity. The distributed cloud images of temperature, velocity, pressure, and various phases in the foaming cavity were investigated by using the Fluent post-processing function. Simulation result shows that during the whole foaming process, the increase of base asphalt temperature results in the decrease of asphalt viscosity and the increase of water vapor in the foaming cavity. When the base asphalt temperature rises from 120 to 160 ℃, the foam expansion rate of base asphalt increases from 4 to 11, revealing a great impact of base asphalt temperature on the foam expansion rate. The increase of base asphalt flow rate serves to the increase of total amount of base asphalt in the foaming cavity and reduces the contact time and area between the base asphalts. When the entrance flow rate of base asphalt increases from 60 to 120 g·s-1, the foam expansion rate of base asphalt fluctuates between 7 and 11, indicating that the change of base asphalt flow rate has a great impact on its foam expansion rate. When the water consumption increases from 2.0% to 3.5%, the foam expansion rate of base asphalt remains the same basically, indicating that the water consumption has little effect on the foam expansion rate of base asphalt. The lowest foam expansion rate obtained by the simulation is 3.57. At this time, the base asphalt flow rate is 120 g·s-1, the base asphalt temperature is 120 ℃, and the water consumption is 3.0%.More>
2019, 19(3): 19-26. doi: 10.19818/j.cnki.1671-1637.2019.03.003
Test method of clip bite force
ZHANG Feng, LIU Jia-qi, GAO Lei, LIU Guan-zhi
Abstract: To study the relationship between the mutation segment of tension test curve and the clip bite force when using the lift-off method to test the force of prestressed steel strand, the high-frequency acquisition technique in the resistive pressure sensor was used to test the prestressed steel strand forces of a prestressed concrete beam under and outside the anchorage when the clip disengages. A total of 20 samples were tested. The clip bite force test scheme was designed. A total of 326 samples were tested and the statistical analysis was performed. The calculation formula for the clip bite force considering the tension was established. Through the verification test of 37 samples, the test accuracy of bite force correction results was studied. 257 samples were tested in the actual project, and the test results were compared with the proposed calculated formula results. Research result shows that the clip will break away from the original bite mark when the steel strand extends more than 4.5 mm. However, when the clip disengages during the actual test, the tension will be stopped in time, so the lift-off test will not change the effective prestress of prestressed steel strand under the anchorage and affect the project quality. When installing the clip, if the clip does not completely fit the taper hole of socket, the clip will have a large elastic pressing force in the lateral direction to form an additional friction force. The friction force will completely disappear when the clip is separated from the socket. The change of tension outside the anchorage is not obvious at this moment, so the slope of descending segment of tension test curve obtained by the lift-off method has a dispersion after the peak tension, and it is related to the clip installation precision. The bite force of socket in the lift-off test consists of the transient internal force redistributions under and outside the anchorage. The proposed calculation formula for clip bite force can eliminate the test error caused by the bite force between the clip and the socket, and improve the test accuracy by 6.78%. The test bite force in the actual project is larger than the mutation segment of tension test curve obtained by the lift-off method. Therefore, when using the lift-off method to test the prestressed steel strand, the effective prestress under the anchorage is the difference between the peak value of tension test curve obtained by the lift-off method and the bite force.More>
2019, 19(3): 27-35. doi: 10.19818/j.cnki.1671-1637.2019.03.004
Long-term push out test and finite element analysis of steel-concrete composite specimens
SONG Rui-nian, ZHAN Yu-lin, LIU Fang, ZHAO Ren-da
Abstract: The long-term interface slip and strain development process for steel-concrete composite specimens with different shear connectors were investigated through the push out test and finite element method. Referring to the standard specimen of push out test in the Eurocode 4, two sets of specimens were designed for the long-term push out tests. The studs and PBLs were used as the shear connectors, respectively, the long-term load was applied by screw rods, and the interface slip, concrete strain and steel girder strain were measured during the long-term loading process. The long-term deformations of concrete specimens with the dimensions of 150 mm×150 mm×300 mm were loaded and tested synchronously to calculate the concrete creep coefficient. The effect of creep model on the calculation result was compared, and different concrete creep simulation methods were discussed. Research result shows that the interface slip and concrete strain increase rapidly at the initial stage of loading and keep stable in 120 d after loading. The maximum interface slips of stud specimens and PBL specimens are 0.162 and 0.068 mm, respectively, and located at the bottom of interface. The maximum concrete strains of stud specimens and PBL specimens are 7.30×10⁻⁵ and 1.34×10⁻⁴, respectively, and located at the bottom of concrete slab. The steel girder strain remains basically stable during the whole test process. There is no obvious stress redistribution. The maximum steel girder strains of stud specimens and PBL specimens are 3.7×10⁻⁵ and 6.5×10⁻⁵, respectively, and located at the top of steel girder. The concrete creep is the main factor affecting the long-term performance of steel-concrete composite specimen. The errors between the concrete creep coefficients calculated by different concrete creep models and the test values are 60%-140%, indicating that the concrete creep model has a significant impact on the finite element results. When using the exponential function to fit the test result of concrete creep coefficient, the fitting error is 2.4%. The error between the concrete creep coefficient calculated by the CEB-FIP90 model and test value is 3.71% at the later loading stage. The CEB-FIP90 model is recommended to calculate the concrete creep coefficient when the actual test cannot be carried out.More>
2019, 19(3): 36-45. doi: 10.19818/j.cnki.1671-1637.2019.03.005
Field simulation test of bridge pile foundation damage in high altitude and strong salt marsh area
FENG Zhong-ju, HU Hai-bo, WANG Fu-chun, XU Zhan-hui, YAO Xian-hua, LIU Ning
Abstract: In order to explore the damage status of highway bridge pile foundation subjected to dry-wet cycle and freeze-thaw cycle in high altitude and strong salt marsh area, the effects of pile body positions, concrete mix proportions, concrete admixtures and external protective measures on the mechanical properties of bridge pile foundation were studied by the field simulation test. The microscopic mechanism of pile foundation damage was analyzed by the SEM analysis, EDS analysis and chemical composition analysis. Research result shows that the anti-erosion ability and inner steel bar corrosion of pile foundation concrete are affected by the position of pile body. For the benchmark concrete specimens, when the curing age is 360 d, the erosion resistance coefficients of pile foundation concrete in the water, on the ground, and at the depths of 0.25 and 1.25 m are 0.80, 0.63, 0.75, and 0.76, respectively, and the corrosion rates of steel bar area at the corresponding positions are 76%, 91%, 66%, and 65%, respectively. The anti-erosion ability of pile foundation concrete is affected by the concrete mix proportion and concrete admixture, and the anti-erosion ability of the concrete with slag is the strongest on the whole. When the contents of sand, water, gravel, reducer, cement, rust inhibitor, and expansion agent are consistent, the average erosion resistance coefficients of concrete specimens with 87.25 kg·m-3 fly ash, 21.8 kg·m-3 silica ash, and 87.25 kg·m -3 slag are 0.79, 0.89, and 0.91 at the curing age of 360 d, respectively. The steel casing has a protective effect on the concrete erosion in a short time, but the protection period under long-term erosion is generally 2-3 years. When the curing age changes from 90 d to 360 d, the mass fraction of element C in pile foundation concrete increases from 0 to 9.61%, so that more and more CaCO3 molecules are produced, together with the expansion of ettringite and other crystals, resulting in the swelling and cracking of pile foundation concrete.More>
2019, 19(3): 46-57. doi: 10.19818/j.cnki.1671-1637.2019.03.006
Distribution characteristics of grouting reinforcement ring for tunnel with heterogeneous weak surrounding rock
ZHANG Cong, YANG Jun-sheng, XIE Yi-peng, DAI Yong, LIANG Xiong, GONG Fang-hao
Abstract: Based on the random distribution theory and fluid-solid coupling theory, the dynamic changes of physical parameters of surrounding rock and the time-varying viscosity of grouts in the grouting process were considered, a grout diffusion equation of a tunnel with heterogeneous weak surrounding rock under fluid-solid coupling was deduced. A grout diffusion model of small pipe grouting in heterogeneous weak surrounding rock was established by using the multi-field coupling software COMSOL Multiphysics, and the effects of grouting parameters and arrangement of small pipe on the grout diffusion and the formation of grouting reinforcement ring were systematically studied. Research result shows that the grout in heterogeneous weak surrounding rock disperses in a quasi-elliptical shape. The diffusion patterns change continuously with the dynamic changes of grouting pressure, grouting time and parameters of surrounding rock, and finally tend to be stable. In the grouting process, the permeability of surrounding rock and the penetration capacity of grout can be improved to a certain degree with the increases of grouting pressure and grouting time. While increasing the length of small pipe or reducing the angle of small pipe is beneficial to the formation of grouting reinforcement ring. To achieve the optimal grouting effect, the pre-grouting reinforcement pressure of small pipe in Dongtoushan Tunnel should be designed as 1 MPa, the grouting time should be controlled at 400 s, the angle of small pipe should not be less than 30°, and the length of small pipe should be more than 2.5 m. With the field monitoring and verification, the 28-day compressive strength of tunnel surrounding rock increases to 2 MPa, the permeability coefficient of surrounding rock reduces to 10-5 cm·s-1, the settlement value of vault roof excavated by subsequent step method is less than 3 cm, and the integrity and continuity of surrounding rock are improved significantly.More>
2019, 19(3): 58-70. doi: 10.19818/j.cnki.1671-1637.2019.03.007
Effects of post-pouring belt void of base slab on track structure and train operation of CRTSⅡ slab track
YANG Rong-shan, WANG Jie, JIANG Heng-chang, CHEN Shuai, DU Jin-xin
Abstract: Under the uninterrupted train running condition, the post-pouring belt of CRTSⅡ slab track base slab on the bridge was repaired by using the ultra-high pressure water jet method. The statics calculation model of CRTSⅡ slab track structure was established, and the effects of post-pouring belt with different void length on the vertical displacements of rail and track slab and the tensile stress of track slab were analyzed. The vehicle-track coupling dynamics calculation model was established, and the influences of normal running on track structure, running safety and comfort were analyzed when the complete void length of the post-pouring belt of base slab was 1.0 m. Calculation result shows that under the action of 1.5 times static wheel load, the vertical displacements of rail and track slab increase with the increase of the void length of post-pouring belt. When the complete void length of post-pouring belt is 1.0 m, the vertical displacements of rail and track slab both increase by 0.03 mm, so the complete void has less effect on vertical displacements. When the void length of post-pouring belt is 0.7, 0.8, 0.9 and 1.0 m, respectively, the maximum tensile stress of track slab is 0.96, 1.12, 1.18 and 1.22 MPa, respectively. When the post-pouring belt completely voids, the maximum tensile stress is less than the designed tensile strength of 1.96 MPa, and the track slab will not crack. When the train speed is 300 km·h-1 and the complete void length of post-pouring belt is 1.0 m, the maximum vertical displacements of rail and track slab are 0.91 and 0.32 mm, and less than the reference values of 1.5 and 0.4 mm in Technical Regulations for Dynamic Acceptance for High-Speed Railways Construction (TB 10761—2013), which shows that the normal running after post-pouring belt voids can not cause great influence on the track structure. When the complete void of post-pouring belt occures, the vertical acceleration of track slab is about 3 times of the value under the normal condition, which indicates that normal running will increase the vibration intensity of the lower foundation. The statics and dynamics analysis results show that using the ultra-high pressure water jet method to repair the post-pouring belt of base slab can allow the train travel at normal speeds.More>
2019, 19(3): 71-78. doi: 10.19818/j.cnki.1671-1637.2019.03.008
Torsional coupled vibration characteristics of multi-stage blade disc-shaft system of aeroengine
XU Zi-li, ZHOU Zi-xuan
Abstract: Aiming at the multi-stage blade disc rotor structure, the coupling effect of multi-stage blade bending deformation and shaft torsional deformation was taken into account, the centrifugal rigidity of blade was lead in, and the coupling vibration model containing multi-stage blades, two-stage blade discs and shaft was established. The differential equations of multi-stage blade disc-shaft coupling vibration were derived by using Hamilton principle, the system mass matrix and stiffness matrix were obtained by using numerical integration method, and then the coupled modes of the system were solved. The effects of natural frequency of blade disc, blade length, blade disc spacing and blade twist angle on vibration characteristics were studied. Analysis result shows that the two-stage blade disc-shaft coupling vibration includes 3 types of coupling modes, and the natural frequency of each order is separated from each other at the boundary of blade disc natural frequencies. When the blade length is less than 1 m, the first and second order coupling frequencies are greatly affected by the radius of shaft. When the blade length exceeds 1 m, the first and second order coupling frequencies are greatly affected by the blade length. When the system rotation speed is 2 000 rad·s-1, the variation amplitudes of 1-3 order coupling mode frequencies decrease by 5, 3 and 7 Hz under the influence of blade disc spacing, respectively. The speed-frequency curve has obvious frequency steering characteristics, the blade twist angle increases by 60°, and the steering area increases by 500 rad·s-1. The two-stage blade disc system will produce coupling modes different from the single-stage blade disc system, and the coupling frequency will be significantly affected by both short blade and long blade. The changes of blade twist angle and blade disc spacing will make the coupling area move, which reduces the risk of resonance that may occur.More>
2019, 19(3): 79-88. doi: 10.19818/j.cnki.1671-1637.2019.03.009
Rapid analysis method of weight-reduced orifice plate structure based on stiffness equivalence model
NEI Jing-xin, REN Jun-ming, TAN Wei, CHEN Li-jun
Abstract: In order to calculate and analyze the structure of weight-reduced orifice plate more efficiently, a rapid analysis method was proposed. The general stiffness equivalence relationship between weight-reduced orifice plate structure model and planar plate structure model was researched. The relational expressions were established between the aperture, hole distance of weight-reduced orifice plate, the equivalent Young's modulus, and thickness of corresponding planar plate. The orifice plate structure model was replaced with equivalent planar plate structure model for deformation analysis. The local node displacement was applied to corresponding target hole model, and the stress distribution of target hole area was calculated. The accuracy of proposed method was verified by experiments and simulations. The stability of stiffness equivalence relationship was verified by applying different loads to an actual weight-reduced orifice plate structure. The effectiveness of the method in practical engineering was verified by an example of a car body chasis with orifice plate. Analysis result shows that compared with experimental results, the maximum error of deformation of rapid analysis method is about 3%, and the maximum error of strain is about 5%. Under different loads, the deviation of equivalent Young's modulus is about 2.5%, and the deviation of equivalent plate thickness is about 1.3%. The average calculation error of deformation and local stress of rapid analysis method is less than 6.7%, and the calculation time is shortened by about 50%. So, the rapid analysis method can replace the traditional method to analyze the performance of weight-reduced orifice plate structure.More>
2019, 19(3): 89-99. doi: 10.19818/j.cnki.1671-1637.2019.03.010
Fatigue performance and life assessment of railway axle with inside axle box
LIU Yu-xuan, WU Sheng-chuan, LI Cun-hai, KANG Guo-zheng, LIANG Shu-lin
Abstract: Low cycle fatigue test, high cycle fatigue test under rotating bending and crack growth rate test of EA4 T alloy steel were carried out. Considering load type, surface quality, dimension coefficient and other factors, the fatigue limit of standard small specimen was modified to predict the fatigue performance of full-scale axle. The finite element model of railway axle with inside axle box (RAIB) was established. The difference of critical safety position between RAIB and traditional railway axle with outside axle box (RAOB) was analyzed. Based on the safe life design theory, combined with the modified linear Miner fatigue cumulative damage criterion and load spectrum, the fatigue strength and service performance of RAIB were studied. The crack growth rate curves were fitted by using the Paris formula, NASGRO equation and LAPS model, respectively. Based on the damage tolerance design method, the crack propagation lifes of RAIB and RAOB were estimated. Analysis result shows that the fatigue limits of standard small specimens is obviously higher than that of full-scale axles, and the mean values of fatigue limit are 369 and 286 MPa, respectively. Compared with the traditional RAOB, the critical safety position of RAIB has been transferred from unload groove to axle center due to the change of loading position. The total fatigue life of RAIB is 2.5×10¹² km, which meets the design requirements of 30-year service life. However, there are inevitably defects on the surface of the axle during transportation or service, and serious stress concentration exists at the defect, which provides convenient conditions for the initiation and propagation of cracks and greatly reduces the fatigue life of axle. When the crack depth in critical safety position of axle extends to 5 mm, the residual lives of RAIB and RAOB are only 3.2×10⁵ and 2.0×10⁵ km, respectively, and the non-destructive inspection interval should be reasonably formulated according to the accuracy of non-destructive test to ensure the safe service of axle.More>
2019, 19(3): 100-108. doi: 10.19818/j.cnki.1671-1637.2019.03.011
Impact of air flow characteristics underneath carbody on snow accumulation in bogie region of high-speed train
CAI Lu, ZHANG Ji-ye, LI Tian, AN Chao
Abstract: Aiming at the problem of snow accumulation around the bogie region of high-speed train, the aerodynamics model of the train including refined bogie was established. The detached-eddy simulation was used to simulate the air flow field around the high-speed train at the running speed of 350 km·h-1. The influence of air flow field characteristics on the snow particle transport in the vehicle bottom and bogie region was analyzed. The vortex core lines were extracted, and the relationship between the vortex characteristics of the bogie region and the snow particle transport was studied. Analysis result shows that the underneath air flow is mainly turned upside down from the front and rear wheelsets into the bogie region, forming a swirling air flow around axle. The vorticity in the bottom of bogie region is large than 1 000 s-1, and the vortexes are basically longitudinal. The vorticity in the top of bogie region is less than 200 s-1, and the vortexes are basically longitudinal. The vortexes in the gap between the bogie wheelset and the front/rear end walls are mostly vertical. The vorticity around the back wheelset is more than 5 times larger than that around the front wheelset. The vorticity in the interior region of bogie is less than 200 s-1, and the vortexes are chaotic. The scale, strength and direction characteristics of the vortex reflect that the air flow entering the bogie region has a relative strong ability to carry snow particles, while the outflow of bogie has weaker ability to carry snow particles. The negative pressure in the lower part of head car is large, and there are strong vortexes on both sides of the vehicle bottom and the skirt, which makes it easy to roll up the snow on the track to form snow smoke. Except for head car, the shear stress on the vehicle bottom and the bogie is less than 1 Pa in most areas, and the corresponding frictional wind speed is less than 0.9 m·s-1. The deposited snow particles are difficulty sheared by the internal air flow.More>
2019, 19(3): 109-121. doi: 10.19818/j.cnki.1671-1637.2019.03.012
Macroscopic traffic flow model of expressway on-ramp bottlenecks
SUN Jian, YIN Ju-yuan, LI Tao-ning
Abstract: Based on on-ramp merging mode and fundamental diagram form, an adjusted cell transmission model (CTM) was proposed. On-ramp state variables were introduced to track the traffic state of on-ramps, and new on-ramp merging rules were defined.The dual capacity fundamental diagram was introduced to the adjusted CTM in order to adapt to the varying capacities under different traffic conditions. The nelder-mead method and genetic algorithm were combined, and a hybrid multi-objective parameter optimization method was proposed. Three simulation scenarios were established, the performances of adjusted CTM and the hybrid multi-objective parameter optimization method were evaluated. Simulation result shows that for the prediction of the occurrence time and ending time of congestion on the upstream of on-ramp, compared with the original CTM, the adjusted CTM improves the accuracy by 22.3 and 10.8 min, respectively. For the simulation of the propagation and dissipation of congestion at the on-ramp merging section, the result of adjusted CTM is closer to the actual propagation/dissipation rules.As for the simulation of the early-onset breakdown traffic characteristic on the test segment, the fitting errors of adjusted CTM for the maximum pre-queue flow and queue discharge flow are below 4%, which are less than the values of original CTM. In the term of model simulation accuracy, compared with the original CTM, the various indexes of adjusted CTM are better, the simulated speed error of the former is 10.42 km·h-1, which is 25.4% lower than the value of the latter. Compared with the traditional genetic algorithm, the hybrid multi-objective parameter optimization method can reduce the total calculation times, and the total consumed time of parameter calibration shortens by 29.3%.More>
2019, 19(3): 122-133. doi: 10.19818/j.cnki.1671-1637.2019.03.013
Comprehensive coordination quantitative analysis of urban rail transit planning network and urban planning
PENG Qi-yuan, LIU Jie
Abstract: The comprehensive coordination between urban rail transit planning network and urban planning in multi-radii and multi-directions was analyzed based on the fractal theory, the sector dimensions of urban rail transit planning network and urban road planning network based on network equivalent length were proposed, and the sector dimension of urban rail transit planning stations based on the equivalent stations was proposed. The sector dimension of urban traffic demand was proposed referring to the fractal dimension of population. The comprehensive coordination evaluation indicator of urban rail transit planning network and urban planning based on the vector similarity and fractal consistency was established by using the four sector dimensions. Taking two schemes of urban rail transit planning network in Nanchong as examples, the comprehensive coordination between urban rail transit planning network and urban planning was analyzed. Analysis result shows that the mean of the sector dimension decreases with the increase of research radius, and it's consistent with the urban rail transit planning network and urban planning. The higher the vector similarity between urban rail transit planning network and urban planning, the higher the matching degree in directions. The stronger the fractal consistency between urban rail transit planning network and urban planning, the better the coordination in the research area. The coordination between urban rail transit planning network and urban planning cannot be fully reflected only from the fractal consistency, it should be analyzed by combining the vector similarity and fractal consistency. The coordination between urban rail transit planning network and urban planning changes with the change of research radius. When the research radius is 3, 6, 9, 12 and 15 km, respectively, the comprehensive coordination indicator between scheme 1 and urban planning in Nanchong is 0.48, 0.45, 0.40, 0.53 and 0.43, respectively, and the comprehensive coordination indicator between scheme 2 and urban planning in Nanchong is 0.40, 0.50, 0.48, 0.51 and 0.47, respectively. The values of coordination indicators between the two schemes and urban planning in Nanchong are consistent with the reality. Therefore, the indicators and method are applicable to the comprehensive coordination evaluation of urban rail transit planning network and urban planning.More>
2019, 19(3): 134-144. doi: 10.19818/j.cnki.1671-1637.2019.03.014
Safety scheduling of hazardous materials transportation vehicle considering spatio-temporal dissimilarity
CHAI Huo, HE Rui-chun, DAI Cun-jie, MA Chang-xi
Abstract: To ensure a safety distance between the hazardous materials transportation vehicles, the travel routes and departure time intervals of hazardous materials transportation vehicles were optimized in term of space-time. The impact of hazardous material transportation vehicle accident on other vehicles and the relationship between the hazardous material transportation vehicle accident and the spatio-temporal distance were analyzed, an evaluation method of spatio-temporal safety distance between vehicles was proposed, and taking the spatio-temporal safty distance as a constraint, the calculation method of vehicle safety departure time interval was proposed. A scheduling model of hazardous material transportation vehicle satisfying the spatio-temporal dissimilarity constraint was established. A two-stage solution method was designed to generate the vehicle scheduling timetable. The NSGA-Ⅱ optimization algorithm was used to optimize the travel route of vehicle at the first stage. The genetic algorithm and approximation algorithm based on the inserting thought were designed to optimize the departure time interval at the second stage. To verify the effectiveness of vehicle scheduling model and algorithm, the advantages and disadvantages of different methods at each stage were compared, and the influences of hazardous material accident impact factor and accident impact acceptance on the scheduling results were analyzed. Research result shows that the proposed method can obtain hazardous material transportation vehicle scheduling timetables with different hazardous material accident impact factors, and always ensure the vehicles a safe distance during driving. The average total transportation times obtained by the genetic algorithm and approximation algorithm are 2.45 and 2.49 h, respectively, indicating that the optimal solution of approximation algorithm is inferior to that of genetic algorithm, but the run time is only 1/10 000-1/5 000 of that of genetic algorithm. The smaller the hazardous material accident impact factor or the accident impact acceptance, the larger the vehicle safety departure time interval is, which leads to a longer total transportation time. The vehicle scheduling considering the spatio-temporal dissimilarity can compensate for the deficiency of dissimilar routing method only considering the spatial dissimilarity. At the same time, using the dissimilar routing method can prevent the problem of missing the optimal transportation route.More>
2019, 19(3): 145-156. doi: 10.19818/j.cnki.1671-1637.2019.03.015
Scheduling optimization of tramp shipping based on temporal and spatial attributes of shipping demand
JIANG Zhen-feng, CHEN Dong-xu, YANG Zhong-zhen, LIU Yi-ming
Abstract: The shippers' choice behaviors and the temporal and spatial distribution characteristics of shipping demand were considered, the carrier's ship operation period was divided into multiple continuous time windows, the selection inertia of the shipper was transformed into the potential market shares of the carriers on the shipping segment based on the discrete selection model, and the freight volumes of the carriers in the spot market in different time windows were optimized. An optimization model was built with the maximum profits of the carriers as the objective, and the shipping scheduling scheme was solved during the planning period, so as to determine the shipping cargo and voyage connection. Seven countries in the Pacific region, including China, Canada, Australia, Russia, Indonesia, Brazil, and America, were selected as the main importers and exporters of dry bulk cargoes, and one port of each country was selected as the node of transport network. According to the data published by Clarkson's official website, such as the routes, freight rates, and demand of dry bulk cargoes, the optimal scheduling of tramp ships be obtained by the genetic algorithm. Computation result shows that in the same shipping time window, the sailing time and profit of the ship are 58 days and 3.01×10⁵ USD under the optimal scheduling scheme, respectively. While, in the traditional scheduling scheme maximizing the profit on each segment, the sailing time and profit of the ship are 56 days and 2.48×10⁵ USD, respectively, and the profit is 5.30×10⁴ USD lower than the profit under the optimal scheduling scheme. Therefore, in order to maximize the profit in the shipping period, under the influence of the temporal and spatial change of freight demand and the inertia of shipper choice, the ship should carry out the voyage without profit or with low profit in some time windows.More>
2019, 19(3): 157-165. doi: 10.19818/j.cnki.1671-1637.2019.03.016
Spatial evolution of coal transportation network of China
WANG Wen-ya, LI Zhen-fu
Abstract: To investigate the evolution rules and intrinsic mechanisms of coal transportation network of China, a coal transportation network evolution model based on the coal price cost and transportation cost selection mechanism was proposed referring to the modeling ideas of complex networks. Through adjusting the model parameters, the influences of model parameters on the network characteristics were analyzed. To reflect the effect of dynamic fluctuation in coal price on node selection, a coal price fluctuation function was constructed to serve the evolution model. The simulating calculation was conducted through the coal transportation data of China in 1998, and the simulation results were compared with the coal transportation network characteristics of China in 2016 to verify the rationality of the proposed coal transportation network evolution model. Research result shows that the node strength is more suitable for analyzing the characteristics of coal transportation network of China than the node degree. The coal transportation network of China is a heterogeneous network. Removing a few nodes with high strength will severely affect the network connectivity. Increasing importing nodes of coal transportation will reduce the impact of removing a few nodes with high strength on the network. Increasing exporting nodes of coal transportation can enhance the reliability of coal transportation network of China, improve the potential of ports in the areas such as Shandong and Liaoning, and drive the regional economic development. Increasing importing nodes of coal transportation can make the southeast coast region and central region of China critical nodes, and also enhance the reliability of coal transportation network of China, but will weaken the network invulnerability and the tendency of critical nodes connecting with non-critical nodes. The transmission and tightness of network will show a tendency of increasing first and then decreasing. Thus, when increasing importing and exporting nodes of coal transportation, the overall planning of coal transportation network and the construction and management of hub areas should be strengthened. The coal transportation resource allocation should be rationally guided, so as to improve the overall performance of coal transportation network of China.More>
2019, 19(3): 166-177. doi: 10.19818/j.cnki.1671-1637.2019.03.017
Heterogeneous vehicular network selection method considering network congestion and system fairness
LI Xiao-chi, XU Zhi-gang, CHEN Ting, ZHAO Xiang-mo
Abstract: The bounded rationality characteristic of evolutionary game was used to implement the network selection, and the network resource of heterogeneous vehicular network system was evenly distributed. The fairness of the system was guaranteed by optimizing evolutionary game with two-layer game while some of the vehicles can transmit message in extreme congestion. The network simulation scene combined with dedicated short-range communication (DSRC), long-term evolution, and wireless local area network was designed, and the traditional method based on multiple criteria decision making, the network selection method based on evolutionary game, and the network selection method based on two-layer game were compared. Simulation result shows that the large scale ping-pong effects of dynamic network environment in heterogeneous vehicular network switching was firstly solved by using the heterogeneous vehicular network selection method based on evolutionary game and two-layer game. The two-layer game can suppress congestion and provide system fairness. The network selection method based on two-layer game can drive the heterogeneous network system to achieve the stability of network system state in 2-3 switching cycles. In the preset dynamic network evaluation condition and the general scene with 80 terminals, the terminal average network evaluation index of two-layer game is 19.5% higher than that of evolutionary game, and it provides reliable services for three kinds of network cooperation. In the extreme congestion scenario with 190 terminals, the terminals are reasonably distributed and share the DSRC network resources. The terminal average network evaluation index of two-layer game is 10.3% higher than that of evolutionary game, and the evaluation index of two-layer game DSRC network is 2.18 times of evolutionary game. Therefore, the basic safety messages broadcast, system fairness and basic connected vehicle service can be ensured.More>
2019, 19(3): 178-190. doi: 10.19818/j.cnki.1671-1637.2019.03.018