Distribution properties of internal air voids in asphalt mixtures
-
Abstract: X-ray computed tomography(CT) technology was adopted to scan the internal structures of AC-16, SMA-16 and OGFC-16 mixture specimens compacted using Marshall and Superpave gyratory compactor(SGC) methods. Digital image processing technology was adopted to analyze the spatial distribution of their internal air voids. The result shows that the distributions of air voids are not uniform in mixture specimens, and they vary greatly with the compacting styles and gradations of asphalt mixtures. Throughout the specimen height, air void percents are bigger on the top and at the bottom, and are smaller in the middles of the specimens compacted by SGC method, whereas the distribution variances are not marked for the specimens compacted by Marshall method. Throughout the cross sections of the specimens, air voids distribute more in the outside parts than in the middle parts for AC-16 and SMA-16 mixtures. 3 tAbs, 11 figs, 10 refs.
-
Key words:
- pavement engineering /
- asphalt mixture /
- internal air void /
- spatial distribution /
- CT
摘要: 利用X-rayCT无损检测设备分别对Marshall与SGC成型的AC-16、SMA-16与OGFC-16三种沥青混合料的内部结构进行扫描, 利用数字图像处理技术, 分析了混合料内部的空隙分布特征。分析结果表明: 沥青混合料内部空隙呈不均匀分布状态, 其变异性受成型方式与级配型式的影响。在试件的高度方向, SGC成型试件的内部空隙总体上呈现“两头大、中间小”的特性, 但Marshall成型试件的空隙分布特征并不显著。在试件的横向, AC-16与SMA-16试件的空隙较多地分布在试件边缘, 试件呈“外疏内密”状态。 -
0. Introduction
Asphalt mixture is a three-phase compound comprising of aggregates, asphalt mastic and air voids. At present, the macroscale and overall indices such as air void percent, bulk density, voids in mineral aggregate(VMA) and voids filled with asphalt(VFA), are usually adopted to characterize the volumetric properties of asphalt mixture. These statistical indices simply describe the overall orientation of the specimen, while the microstructure properties of the internal specimen, such as the spatial arrangement of aggregate, aggregate interlock, skeleton contact, mastic distribution and air voids can not be accurately determined. The internal microstructure of asphalt mixture is highly correlated with the long-term performance and mechanical properties of asphalt pavement.
The digital image processing (DIP) technology was initially adopted by Yue to study the shape, orientation and spatial distribution in asphalt mixture[1-5]. Shashidhar adopted the computed tomography (CT) system to scan the distribution of aggregates, mastic and air voids in asphalt mixture, and found the correlation between asphalt pavement rutting and coarse aggregate interlock contact in the specimen[6]. Wang also used CT system and DIP technology to quantify the microstructure of pavement cores with three different gradations drilled from WesTrack testing field[7-8]. The volumetric indices such as VMA, VFA and air void percent of the drilled cores were calculated by DIP method. Air void distributions were scanned by CT and analyzed by DIP technology for two different specimens compacted by Superpave gyratory compactor (SGC) and linear kneading compactor[9], and air void can be fitted using the Weibull distribution curve. Masad utilized the CT images to measure the void distribution and characterize the fluid flow path in connected voids in the field core[10]. The aforementioned research focused more on analyzing the internal structure of the same type of asphalt mixtures by DIP technology, and less on comparing the diversities between different gradation mixtures designed by different methodologies.
The compaction method and aggregate gradation have influence on the internal structure and mechanical performance of asphalt mixture. The AC-16, SMA-16 and OGFC-16 mixture specimens designed by SGC and Marshall methods are scanned by CT and the internal void distributions are measured by DIP technology in this paper. The work also provide digital model for the mechanical simulation and elaborate the mechanical characteri-stics of asphalt mixture.
1. Materials
1.1 Aggregate gradation
Three different gradations are used in the study, namely, a continuous dense AC-16 gradation, a stone matrix asphalt SMA-16 gradation and an open graded friction course OGFC-16 gradation. The gradations for three mixtures are shown in Tab. 1.
Table 1. Passing percents of three gradations
1.2 Performances of asphalt mixtures
The AC-16 and SMA-16 mixtures are designed using the Marshall method, and their air voids are mainly maintained at 4% and other performance indices are also considered. The main indices for AC-16, SMA-16 and OGFC-16 designed by Marshall method are presented in Tab. 2.
As the design method and controlling criteria for OGFC-16 mixture was not presented in the SuperpaveTM design system, the air void percent and gradation of OGFC-16 are kept in the same for SGC specimens and Marshall specimens in this paper. The optimum asphalt content is 3.7% for OGFC-16 mixture. The optimum asphalt contents are set at 3.7% and 4.7% for AC-16 and SMA-16 mixtures respectively.
Table 2. Performance parameters of asphalt mixtures
2. CT scanning of internal structures for mixture specimens
2.1 CT system and its technical data
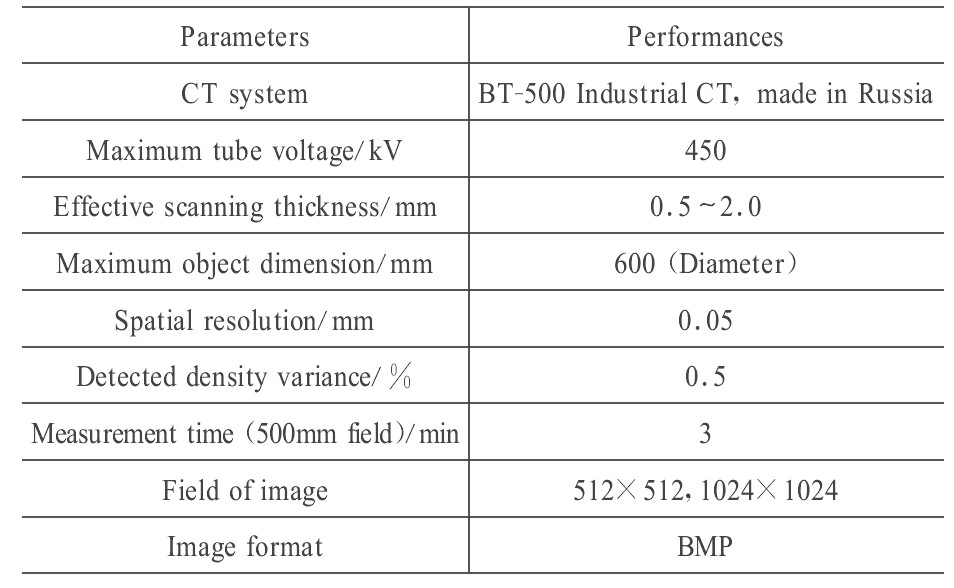
The basic data of CT system adopted in this paper are shown in Tab. 3.
Table 3. Technical data of CT system
2.2 Scanning slice positions
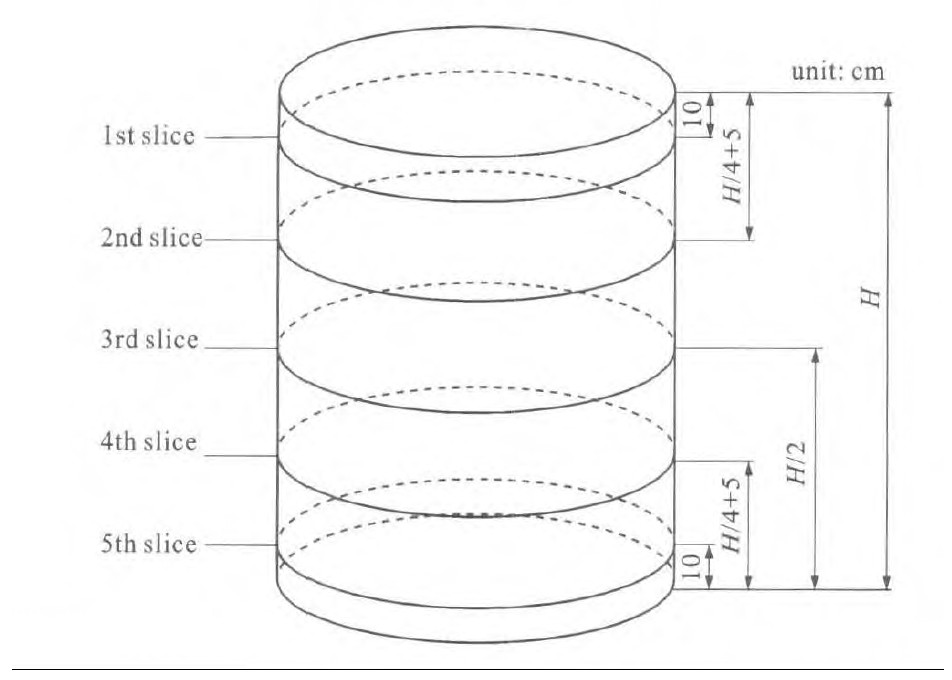
The scanning slice positions are presented in Fig. 1 for the two compaction method and three gradation specimens.
2.3 Internal structure images of mixture specimens
The scanned CT images of the internal structures for these specimens are listed in Fig. 2 to Fig. 7. The images are arranged from left to right and correspond to slices from top to bottom as shown in Fig. 1.
2.4 Calculation method of internal air voids
The threshold between the mastic and aggregate is automatically calculated by edge recognition in digital image analysis soft package Image Pro-plus 5.0. By this method, the internal air void is quantified and measured for the 2D images.
3. Air void distributions among different slices
The DIP method is adopted to calculate the air void distribution and study the influence of aggregate gradations and compaction methods with the aforementioned 6 groups of images.
3.1 Air void distributions in SGC mixture specimens
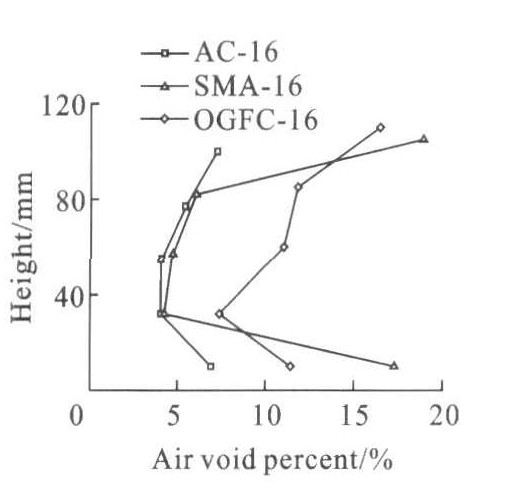
The air void distributions are shown in Fig. 8 for the different slices along the height of the mixture specimens compacted by SGC.
It can be inferred from Fig. 8 that, throug-hout the specimen height, the air void percents are bigger on the top and at the bottom, and are smaller in the middles of the specimens compacted by SGC.
Meanwhile, the aggregate gradations have remarked influence on the air void distributions through the specimen height. The void percent variance is least for the continuous dense AC-16 gradation, with only 1.5% standard deviation. For the open graded friction course OGFC-16, the variance is comparatively intermediate, with 3.2% standard deviation. The stone matrix asphalt mixture SMA-16 has the largest variance of 7.2% standard deviation.
The internal structure is being rearranged spatially in asphalt mixture when the specimens are compacted by a gyratory compactor. For the three parts of coarse aggregates, medium size aggregates and mastic, they need different amounts of energy to get rearranged. The coarse aggregates need the biggest energy and the mastic needs the smallest energy.
The coarse aggregates have a high content in SMA-16 mixture, and they need high energy to get rearranged spatially, while the low content medium size aggregates need low energy to get rearranged. With the given gyratory compaction energy in the compaction process, the coarse aggregates only have little spatial rearrangement, while middle size aggregates have much spatial rearrangement. The spatial rearrangement is remarkable between the coarse aggregates and the medium size aggregates in compaction process, which makes the significant variance of air void distributions in SMA-16 mixture specimens.
There are low content of coarse aggregates and high content of medium size aggregates in AC-16 mixture. With a given gyratory compaction energy, the spatial rearrangement of coarse aggregates matches well with the medium size aggregates. The result in a consistent spatial rearrangement of the coarse aggregates and medium size aggregates gives the low variance of air void distributions in AC-16 mixture specimens.
The design number of gyratory compaction is 100 for the three gradation mixture specimens in this research. The gyratory compaction energy is higher than the 50 Marshall blows for SMA-16 and OGFC-16 mixtures, which may result in higher variance of air void distributions for SMA-16 and OGFC-16 mixtures compacted by SGC.
3.2 Air void distribution in Marshall mixture specimens
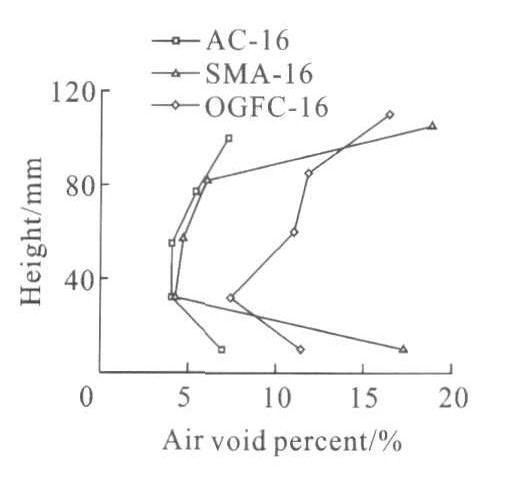
The air void distributions are shown in Fig. 9 among different slices along the height of the mixture specimens compacted by Marshall.
It can be inferred from Fig. 9 that, throug-hout the specimen height, the air void distribution variances are not marked for the specimens compacted by Marshall.
The AC-16 specimen has the lowest variance of air voids, with 0.6% standard deviation. The OGFC-16 specimen has the intermediate, with 1.0% standard deviation. The SMA-16 specimen has the greatest variance of 1.2% standard deviation.
3.3 Influence of air void distribution by compaction style
It can be inferred from the comparison between
Fig. 8 and Fig. 9 that, the air void variances of the specimens compacted by SGC are more significant than that of the specimens compacted by Marshall. Their standard deviations are given as: AC-16 specimens(1.5%, 0.6%), SMA-16 specimens(7.2%, 1.2%), OGFC-16 specimens(3.2%, 1.0%).
The coarse aggregates, medium size aggregates and mastic in the mixture specimen are also rearranged when the mixture specimen is compacted by Marshall blow. But its mechanism is a little different with that of SGC specimen. In the gyratory compacting process of SGC, the three components contact one another and get rearranged smoothly, while in the Marshall method, the components collide rigidly in the compacting process. Because of the angularity of the aggregates, the aggregates need less energy to get rearranged with flexible contact and more energy with rigid collision during the compaction process. The compaction energy of SGC is higher than that of Marshall, especially for SMA-16 and OGFC-16 specimens. As a result, the spatial rearrangement scale of the aggregates in SGC specimens is higher than that in Marshall specimens, and the variance of air void distribution in SGC specimens deviates more greatly than that in Marshall specimens.
4. Air void distribution in cross section
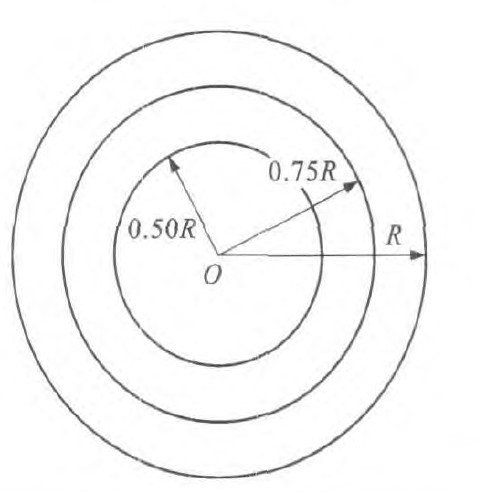
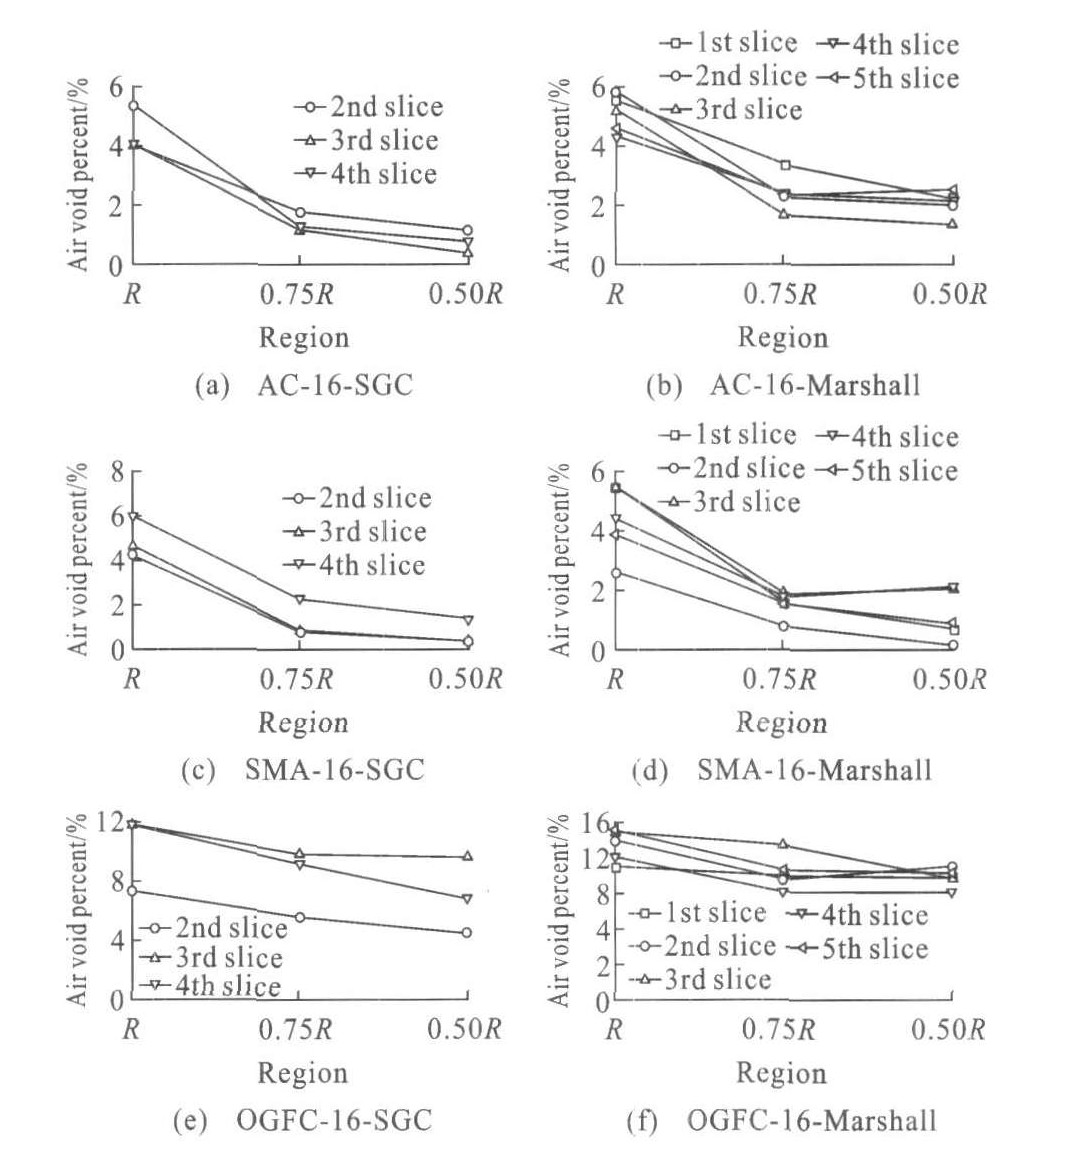
The air void distribution characteristics in the cross section are also studied by the 6 groups CT images. The circular areas at radii R, 0.75R and 0.50R are considered to calculate the air void distribution (Fig. 10). Note that R is the radius of cross section slice.
The 1st and 5th slices of SGC specimens are not included in calculating the air void distribution due to the marked variances of air voids on the top and at the end of SGC specimens. The air void distribution in the cross section of each slice is shown in Fig. 11.
It can be inferred from Fig. 11 that air voids distribute unevenly through the cross sections of AC-16 and SMA-16 mixtures. Generally, the outer parts have more air voids than the inner parts in the cross sections. Air voids increase through the radius length. The "sparse outer and dense inner" pattern gets more obvious in SGC specimens.
For the OGFC-16 mixture specimens, air void variances are not clear and distribute uniformly in the cross sections of both SGC specimens and Marshall specimens.
In the compaction process of asphalt mixture specimens, some coarse aggregates will be constrained by the steel mould when they get rearranged in the exterior part of the cross section, and their position will get preliminarily fixed. The medium size aggregates and mastic will continuously move in the middle part of the specimens(both in height direction and cross section) and get rearranged fully, and get their optimum spatial positions. The coarse aggregates get fixed in the end section in height direction and in outer part in the cross section, and can not be filled with the uniform middle size aggregates and mastic. As a result, the exterior parts have more air voids in the mixture specimens.
5. Conclusions
(1) Air void distribution is not uniform in asphalt mixture, and it varies greatly with the kind of compacting effort and the gradation of asphalt mixture. Throughout the specimen height, air void percent is greater on the top and at the bottom, and is small in the middle part of the specimen compacted by SGC. The distribution variance is not significant for the specimen compacted by Marshall. Air void distributions are uneven through the cross section of AC-16 and SMA-16 mixtures. The exterior part has more air voids than the inner part in the cross section.
(2) Based on the influence of type of compaction effort, the air void distributions of SGC specimens have more variances than that of Marshall specimens along both height and radial directions.
(3) Based on the influence of aggregate gradation, SMA-16 mixture specimens have more air void distribution variances in both height and radial directions.
(4) For the mixtures compacted by SGC, the bigger variance parts are suggested to be removed in the mechanical performance test. The deviationwould be little if the cores drilled from original SGC specimen without the end part are taken in the mechanical performance tests.
-
图 10 0空隙分布区域Fig. 10 Different regions of void distribution
表 1 Passing percents of three gradations
Table 1. Passing percents of three gradations

表 2 Performance parameters of asphalt mixtures
Table 2. Performance parameters of asphalt mixtures

表 3 Technical data of CT system
Table 3. Technical data of CT system
-
[1] LI Yan-chun, MENG Yan, ZHOU Li-wei, et al. Grey relation degree analysis of influence factors on asphalt mixtures voids[J]. China Journal of Highway and Transport, 2007, 20(1): 30-34. (in Chinese) [2] PENG Bo, DING Zhi-yong, DAI Jing-liang. Road performance comparison of different asphalt mastics[J]. Journal of Traffic and Transportation Engineering, 2007, 7(3): 61-65. (in Chinese) [3] WANG Hai-nian, HAOPei-wen. Advancesin microstructure study on asphalt mixture[J]. Journal of Chang an University: Natural Science Edition, 2008, 28(3): 11-15. (in Chinese) [4] YUE Zhong-qi, BEKKI NG W, MORI N I. Application of digital i mage processing to quantitative study of asphalt con-crete microstructure[J]. Transportation Research Record, 1995, 1492: 53-60. [5] YUE Zhong-qi, MORI N I. Digital i mage processing for aggregate orientation in asphalt concrete mixtures[J]. Canadian Journal of Civil Engineering, 1996, 23(2): 480-489. doi: 10.1139/l96-052 [6] SHASHIDHAR N. X-ray tomography of asphalt concrete[J]. Transportation Research Record, 1999, 1681: 186-192. [7] WANG L B, FROST J D, SHASHIDHAR N. Microstructure study of WesTrack mixes from X-ray tomography i mages[J]. Transportation Research Record, 2001, 1767: 85-94. doi: 10.3141/1767-11 [8] WANG L B, FROST J, MOHAMMAD L, et al. Three-di mensional aggregate evaluation using X-ray tomography i maging[C]//TRB. 81st Annual Meeting of Transportation Research Board. Washington DC: Transportation Research Board, 2002: 1-22. [9] MASAD E, TASHMAN L, SOMEDAVAN N, et al. Micro-mechanics-based analysis of stiffness anisotropy in asphalt mixtures[J]. Journal of Materials in Civil Engineering, 2002, 14(5): 374-383. doi: 10.1061/(ASCE)0899-1561(2002)14:5(374) [10] MASAD E, BUTTON J. I mplications of experi mental measurements and analyses of the internal structure of hot-mix asphalt[J]. Transportation Research Record, 2004, 1891: 212-220. -


 DownLoad:

 DownLoad:


 下载:
下载:


