| Citation: | WANG Chun-sheng, HE Wen-long, ZHANG Wen-ting, YAO Shu-kui. Static system reliability analysis of cable-stayed bridge based on improved BP neural network[J]. Journal of Traffic and Transportation Engineering, 2024, 24(5): 86-100. doi: 10.19818/j.cnki.1671-1637.2024.05.006

|
As the span of cable-stayed bridges continues to increase, geometric nonlinearity becomes more prominent, structural complexity increases, and failure modes become more diverse. Therefore, in modern cable-stayed bridge design, only focusing on the safety and reliability design of components is no longer sufficient to meet the needs of engineering construction. It is urgent to grasp the reliability design of cable-stayed bridges at the structural system level. In the early reliability analysis of cable-stayed bridge systems, a simple structural example was used to search for all failure modes and establish a failure tree, which was verified to be feasible and effective. However, this method has a large computational load and low efficiency, and is not suitable for the reliability analysis of actual cable-stayed bridge systems. Therefore, it is urgent to develop new calculation ideas combined with computer programs[1]In recent years, many scholars have conducted extensive research on the calculation methods of component reliability and system reliability of cable-stayed bridges.
The key to calculating the reliability index of components lies in how to explicitly express high-order nonlinear implicit functional functions. Monte Carlo simulation (MCS) combined with finite element calculation has a huge volume and is difficult to achieve structural reliability calculation; Response Surface Method (RSM) fits functional functions near design points in the form of quadratic expressions, requiring a small sample size and high computational efficiency[2-6]However, polynomial functions are difficult to accurately approximate high-order nonlinear functional functions; Support Vector Machine (SVM) and Artificial Neural Network (ANN) are machine learning methods that have been developed and improved in both theoretical and applied research in recent years. SVM uses different forms of kernel functions and corresponding parameters to construct the SVM network structure, and determines the SVM approximate expression of the functional function through limited sample training, which can be used for reliability analysis of actual cable-stayed bridges[7-9]However, as the number of training samples increases, the computational and storage requirements also rapidly increase; ANN trains a certain number of sample points to fit the functional function of the structure, which has good generalization ability and is often used for reliable analysis of long-span bridges. Among them, backpropagation (BP) neural network has the advantages of forward information transmission, error backpropagation, and automatic adjustment of weights to achieve training accuracy. It has good generalization ability and is currently one of the widely used ANNs, but it is prone to getting stuck in local optimal solutions. Zhang Jianren et al[10]On the basis of known structural functional functions, genetic algorithm (GA) is introduced to search for design verification points, and then BP neural network is used to fit the functional function near the design points. Importance Sampling Monte Carlo Simulation (ISMCS) is used to solve the reliability index, avoiding the limitations of traditional RSM relying on JC method and polynomial function, and efficiently analyzing the reliability of a four span cable-stayed bridge main beam and tower; Li et al[11]Adopting the hyper Latin cubic sampling technique to evenly distribute the training data in the sample space, in order to improve the accuracy of BP neural network prediction. Based on the First Order Second Moment (FORM) method, the verification points are calculated, and the ISMCS is used to solve the reliability index, which is applied to the displacement reliability analysis of a five span self anchored suspension bridge; Cheng et al[12-13]Based on the fitting of structural functional functions using BP neural network, GA is introduced to analyze the reliability of mid span displacement of long-span suspension bridges according to the geometric meaning of reliability indicators. The above methods have promoted the promotion and application of BP neural network in the reliability analysis of large and complex bridge structures. However, due to the randomness of the initial weights and threshold selection of the network, the algorithm efficiency is difficult to guarantee, and the accuracy of reliability index calculation is insufficient due to the influence of design verification point iteration errors.
The key to studying the reliability of structural systems lies in identifying failure modes and calculating the probability of system failure. The limit state system represented by Moses' load increment method and the probability evaluation system represented by Thoft Christensen's branch bound method are currently the two mainstream failure mode identification systems[14]In response to the problem of multiple failure modes in cable-stayed bridges,βThe boundary method and its improved algorithm are simple and computationally efficient, and are widely used in the search for failure modes of cable-stayed bridges[15-17]Differential equivalent recursive algorithm is suitable for calculating the failure probability of series parallel systems, Zhang Xiaoqing et al[18-19]On this basis, the expression of equivalent failure modes was derived, and the calculation errors were corrected, providing an effective path for reliability calculation of complex structural systems.
Cable stayed bridges are complex high-order statically indeterminate structural systems, and the efficiency of calculating component reliability and the speed of searching for failure modes constrain the research progress of system reliability. It is necessary to establish a complete analysis process for the reliability of cable stayed bridge systems and develop corresponding efficient calculation programs. To address the issues of efficiency and accuracy in calculating the reliability index of cable-stayed bridge components, GA optimized BP neural network is introduced to optimize the initial weights and thresholds, efficiently reconstruct the functional functions of key components of cable-stayed bridges, and quickly search for verification points. The global optimal solution is theoretically obtained, and ISMCS is used to calculate the reliability index of components, forming the GA-BP-GA-Monte Carlo (GBGMC) algorithm for component reliability index; Apply the correction againβThe boundary method is used to screen candidate failure units for each failure process, search for the main failure modes of cable-stayed bridges, and establish a failure tree; Finally, the equivalent safety margin equations for each failure mode were fitted using the first-order response surface method, and based on the calculation of the correlation coefficients for each failure mode, an improved differential equivalent recursive algorithm was used to calculate the reliability of the structural system, forming a complete reliability analysis method for cable-stayed bridge systems, and corresponding programs were developed. The method proposed in this article was applied to a cable-stayed bridge engineering example to conduct a complete system reliability calculation and analysis, providing support for the reliability design of cable-stayed bridge systems.
Structural reliability analysis is the process of introducing random variables based on probability statistics into deterministic structures to calculate the failure probability of the structurePf, usually in the form of numerical integration[20]Expressed As
| Pf=∫g(x)<0f(x)dxx=(x1,⋯,xi,⋯,xn)T | (1) |
In the formula:xiFor the thiInput value (random variable); N is the total number of random variables;g(·)For functional functions;f(x)The probability density function of a random variable.
In practical engineering structures,g(x)Usually, it is a high-order nonlinear implicit function, and its failure probability cannot be directly calculated by numerical integration. Therefore, it is necessary to fit the functional function to make it explicit. RSM, SVM, and ANN[10]The implicit limit state equation of the structure can be reconstructed by both methods. Among them, BP neural network is widely used due to its advantages of error backpropagation adjustment and effectively balancing computational efficiency and accuracy. The basic process of traditional algorithms is to first use BP neural network to fit the functional function, and then combine JC method or MCS to calculate reliability. However, in the actual reliability calculation process, on the one hand, due to the significant difference in the magnitude of random variables, normalization of the training data is required, resulting in the inability to determine the gradient of the reconstructed function, making the JC method difficult to use; On the other hand, when the reliability index of the component is relatively high (greater than 5), it is difficult to directly use MCS sampling for 1 million times to obtain the failure probability, and it is also difficult to obtain the functional function verification points. In response to the above issues, this article introduces GA into optimizing BP neural networks, efficiently reconstructing functional functions and quickly searching for verification points. ISMCS is used to calculate reliability indicators, and GBGMC method is proposed to calculate component reliability indicators, greatly reducing network training time while improving calculation accuracy and efficiency. This method mainly consists of the following five steps: (1) constructing a BP neural network; (2) Introducing GA optimized BP neural network; (3) Training BP neural network; (4) Refactoring functional functions and searching for verification points; (5) Use ISMCS to calculate the probability of failure.
BP neural network is a theoretical mathematical model that simulates human brain activity. It is a large-scale nonlinear adaptive system with characteristics such as distributed representation of information, global parallel and local operations of operations, and nonlinear processing. It has good learning and reasoning abilities and is suitable for classifying large amounts of data and establishing complex nonlinear mapping problems[21].
BP neural network is a multi-layer feedforward neural network characterized by forward transmission of information and backward propagation of errors. The structure is adjusted through weights and thresholds, and this process is called learning or training. During the training process, information is transmitted forward through the input layer. If the output data does not meet the target error requirement, the error is propagated backward. The structure is corrected by adjusting the weights and thresholds until the difference between the predicted and actual results of the BP neural network meets the target error requirement.
Taking a 3-layer BP neural network as an example to illustrate its basic principle,Figure 1Schematic of a 3-layer BP neural network[22]In the picture:hThe number of hidden layer nodes;g(x)Output for BP neural network.
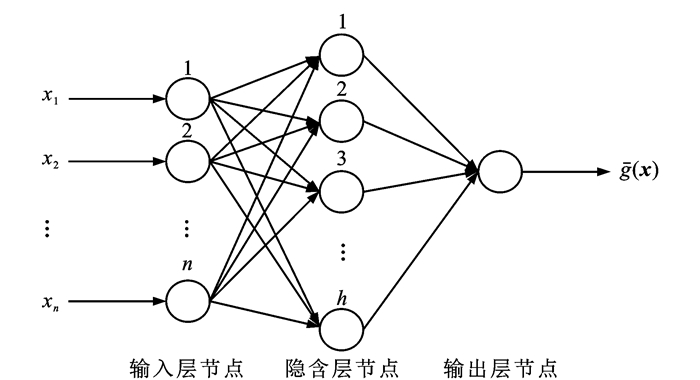
Figure 1The mathematical model[12]do
| ˉg(x)=f2[h∑j=1Kjω2(j)+b2] | (2) |
| Kj=f1[n∑i=1xiω1(i,j)+b1(j)] | (3) |
In the formula:f1(·)Thef2(·)All are transfer functions;KjFor the thj(j=1, 2, …, h)The output coefficient of a hidden layer node;ω1(i, j)For the thiAn input layer node and a thjThe weights between the input layer and the hidden layer corresponding to each hidden layer node;b1(j)For the thjThe threshold between the input layer and the hidden layer corresponding to each hidden layer node;ω2(j)For the thjThe weights between the hidden layer and the output layer corresponding to each hidden layer node;b2The threshold between the hidden layer and the output layer.
transfer functionf′(xi)There are three commonly used forms: The logsig function, tansig function, and purelin function have the forms shown in equations (4) to (6), respectively[21]As shown
| f′(xi)=21+e−2xi−1 | (4) |
| f′(xi)=11+e−xi | (5) |
| f′(xi)=xi | (6) |
The construction of BP neural network requires setting reasonable structural parameters, including the number of hidden layers, the number of hidden layer nodes, and the form of transfer function. As long as there is an appropriate number of hidden layer neurons, a 3-layer BP neural network can approximate nonlinear functions with any accuracy[23]For simplicity, a 3-layer BP neural network is generally selected for structural reliability analysis.
The number of hidden layer nodes has a significant impact on the learning and training ability and performance of BP neural networks. Excessive units in the hidden layer can lead to long training time, overtraining, and poor generalization ability of the network; If the number of hidden layer nodes is too small, the training error will be large and the accuracy cannot be guaranteed, resulting in lower prediction ability. Therefore, it is crucial to choose a reasonable number of hidden layer nodes. Currently, there is no ideal analytical formula that can determine the reasonable number of hidden layer nodes. It is generally determined through trial calculations and can refer to the following empirical formulas[24].
(1) n∑j=1Cjh>M,MFor the sample size,ChjFor fromhExtract from different elementsjThe number of combinations of elements.
(2) h=√n+m+a,mTo output the number of nodes in the output layer,aA constant between [0, 10].
(3) h=log2(n) 。
For the selection of transfer functions, research has shown that the hidden layer transfer function is generally chosen as logsig or tansig function, and when the output layer transfer function is chosen as purelin function, the neural network prediction error is minimized.
The BP neural network requires a certain number of initial sample points and the structural response at the sample points obtained through experimental or numerical analysis methods to train the network. There are three common methods for selecting sample points: random sampling, orthogonal design, and uniform design. The uniform design method has a uniform distribution of sample points, good representativeness, and can effectively reduce the number of experiments. Therefore, this article uses a Data Processing System (DPS) to generate uniform design sample points.
Due to the significant differences in the numerical magnitude of structural random variables, if they are directly used as training samples, the BP neural network may experience a situation where large numbers overwhelm decimals during training, resulting in large prediction errors. Therefore, data normalization is used to convert the training data into values between [0,1]. This article uses the maximum minimum method to normalize the data[23]
| x′i=xi−xminxmax−xmin | (7) |
In the formula:x′iFor the processed BP neural networkiAn input value;xminThe minimum input value for the BP neural network before processing;xmaxThe maximum input value of the BP neural network before processing.
GA[25]It is a parallel random search optimization method that simulates the genetic mechanism of nature and the theory of biological evolution. Based on the selected fitness function, individuals are screened through selection, crossover, and mutation operations, so that those with good fitness are retained and those with poor fitness are eliminated. The new population inherits the information of the previous generation and is superior to it. Repeatedly loop until the conditions are met, with good global convergence ability. This article proposes using GA twice in GBGMC to improve the accuracy and efficiency of the algorithm.
One is to optimize the BP neural network and reduce the number of training iterations. When constructing a BP neural network, randomly selecting initial weights and thresholds can lead to excessively long training time and even over training. Therefore, GA is used to optimize the BP neural network by optimizing the initial weights and thresholds in advance, greatly reducing the training time of the optimized network and better predicting function output.
The second is to search for functional function verification points. After the BP neural network training is completed, if the efficiency is too low or the failure probability of high reliability indicators cannot be obtained directly through MCS simulation sampling, GA is used to search for verification points, and then ISMCS is used to move the sampling center to the verification points to improve the calculation efficiency and accuracy. Due to the geometric significance of reliability indicators being the shortest distance from the limit state surface to the origin in the standard normal space coordinate system, the problem of GA searching for verification points can be attributed to the following constrained optimization model[12]
| minβ2=n∑i=1(xi−uxiσxi)2 | (8) |
| s. t. g(x)=0 | (9) |
In the formula:βFor reliable indicators;uxiandσxiThey are random variables respectivelyxiThe mean and standard deviation after normalizing the equivalent.
The basic principle of GBGMC is as followsFigure 2As shown, the basic steps are as follows.
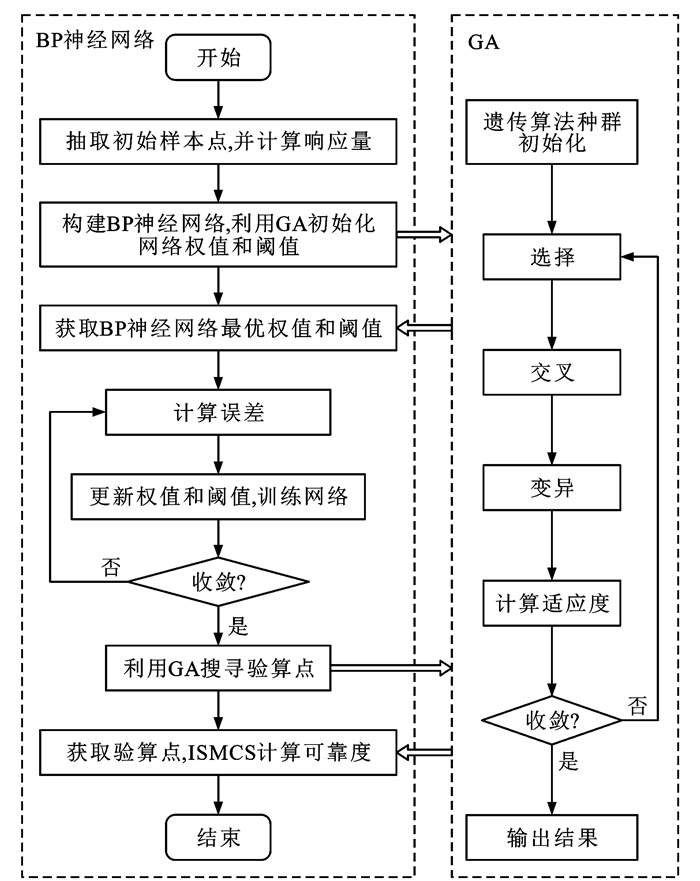
(1) Generate uniform design sample points using DPS, and calculate the structural response at the sample points using finite element program.
(2) Build a BP neural network and determine a reasonable number of hidden layer nodes.
(3) Using GA to optimize the initial weights and thresholds of BP neural network.
(4) Train the BP neural network until it converges.
(5) Use GA to search for verification points.
(6) Use ISMCS to calculate component reliability.
The search for failure modes relies on structural topology changes and reliability index bound criteria. The identification method based on probabilistic evaluation system has a wide range of applications due to its full consideration of complex factors such as randomness, among which Thoft Christensen et al[26]proposedβThe branch bound criterion is widely used to effectively reduce the branch size of failed trees, and its principle is briefly described as follows.
A structural system composed of several units, at the stage of failurekStage,r1、r2、⋯、rk−1commonkOne unit has failed successively, and the unit whose component condition reliability index satisfies equations (10) to (11) is the candidate failure unit[26]
| βl,k⩽βC,k | (10) |
| βC,k=c1+c2βmin,k | (11) |
In the formula:βl, kFor the thkStage 1lThe conditional reliability index of each unit;βC, kFor the thkThe reliability index of the stage is about the threshold value;βmin, kFor the thkMinimum value of reliability indicators for each stage;c1、c2All are approximate coefficients.
Dong Cong[27]Based on extensive engineering experience, it is recommended toc1、c2The values are 1.29 and 0.86 respectively, and a revised version is proposedβBoundary Law.
The calculation of structural system reliability can be summarized into three modes: series system, parallel system, and hybrid system. The single failure mode or failure path of a structure is formed by connecting various failure units in parallel, while the failure tree of a structural system is formed by connecting various failure modes in series. In practical engineering, especially for cable-stayed bridges, the redundancy of the structure itself is relatively high. The failure of a single component does not immediately lead to the collapse and failure of the entire structure. A failure path may be composed of multiple failure units connected in parallel, and the structure usually has multiple possible failure paths. Therefore, its failure tree is generally a hybrid system, and traditional narrow and narrow limits and their improved forms are difficult to calculate the reliability of high-dimensional systems. The differential equivalent recursive algorithm and its improved algorithms provide an effective way to accurately and efficiently calculate the reliability index of structural systems. The process is briefly described as follows[19].
Define two linear failure modes in standard normal spaceαAx+β1⩽0andαBx+β2⩽0The equivalent linear failure mode corresponding to the intersection isαCx+β⩽0Then there is[19]
| P[(αAx⩽−β1)∩(αBx⩽−β2)]=P[(αCx⩽−β)] | (12) |
| β=−Φ−1[Φ2(−β1,−β2,ρ12)] | (13) |
In the formula:αA=(a1,⋯,ai,⋯,an),αB=(b1,⋯,bi,⋯,bn)The unit normal vectors of the two failure modes at the verification point;αC=(c1,⋯,ci,⋯,cn)The unit normal vector for equivalent linear failure modes;ai、birespectivelyαA、αBIn theiThe component in the direction of a random variable;cidoαCIn theiThe component in the direction of a random variable;β1、β2The conditional reliability indicators for two failure modes respectively;ρ12The correlation coefficient between two failure modes;P(·)The failure probability of the failure mode;Φ(·)Is a one-dimensional standard normal cumulative distribution function;Φ2(·)It is a two-dimensional standard normal cumulative distribution function.
Therefore, only the coefficient vector of the equivalent linear failure mode needs to be obtained to obtain the equivalent linear failure mode, and thus calculate the equivalent reliability index. This article uses an improved differential equivalent recursive algorithm to solve the expression coefficient vector of equivalent linear failure modes[19]
| ci=air+bis√r2+2rsρ12+s2 | (14) |
| {r=e−12β21Φ(ρ12β1−β2√1−ρ212)s=e−12β22Φ(ρ12β2−β1√1−ρ212)ρ12=αAαTB | (15) |
The main failure modes of cable-stayed bridges include bending failure of the main beam and cable tower, strength failure of the cables, and displacement failure of the main beam. There is a significant axial pressure between the cable tower and the main beam. When considering the compression bending component, the cable is considered as the tension component. The displacement failure of the main beam is determined by the difference between the actual displacement of each node of the main beam and the allowable displacement specified in the specifications as its functional function. The functional function expressions are as follows:[9]
| gb=1−Nb(x)Nb,u±Mb(x)Mb,u | (16) |
| gc=Nc,u−Nc(x) | (17) |
| gu=Uu−U(x) | (18) |
In the formula:gbFunctional functions for bending failure of main beams and cable tower units;gcFunctional function for cable strength failure;guMain beam displacement failure function;Nb, u、Mb, uThe axial force resistance and bending moment resistance of the main beam or cable tower unit respectively;Nb(x)TheMb(x)The axial force and bending moment effects of the main beam or cable tower unit respectively;Nc, uThe axial force resistance of the cable unit;Nc(x)The axial force effect of the lasso unit;UuAllowable displacement values for the main beam unit;U(x)The displacement effect of the main beam unit.
Nb(x)、Mb(x)、Nc(x)、U(x)All of them are high-order nonlinear implicit functions that can be solved using the improved BP neural network algorithm proposed in this paper.
A cable-stayed bridge is a highly statically indeterminate structure, and the failure of a single component may not immediately cause the bridge to collapse. Therefore, it is necessary to establish a reasonable overall failure criterion for cable-stayed bridges. In structural reliability analysis, as the failure mode path increases, the remaining structure undergoes internal force redistribution, gradually transforming from hyperstatic to statically indeterminate, and forming a structural system. When the structural system fails, the criterion for discrimination is the singularity of the overall stiffness matrix of the remaining structure[28]When equation (19) holds, the structure is in a critical state of reliability and failure
| |Kr|=0 | (19) |
In the formula:KrThe overall stiffness matrix of the remaining structure.
In the actual calculation process, it is difficult to directly extract the stiffness matrix of the structure, or the matrix order is too high, making the analysis cumbersome and complex. Usually, appropriate failure criteria are set based on the stress characteristics of the structure.
Based on the failure types and characteristics of the main components of cable-stayed bridges, the following failure criteria for cable-stayed bridge systems are set:
(1) The failure of a single cable will not cause the overall failure of the structure. If the number of cable failures is sufficient to cause the overall instability of the structure, stopping the search will result in the overall failure of the structure;
(2) The main beam forms enough plastic hinges, causing the overall failure of the cable-stayed bridge, stopping the search, and the overall structural failure;
(3) Failure of any section of the cable tower will cause the overall collapse of the cable-stayed bridge, stop searching, and result in overall structural failure;
(4) The cable, tower, and main beam have not failed, but the displacement of the main beam exceeds the limit, indicating a structural failure that affects normal use.
There are two core issues in the main failure mode recognition algorithm for structures[27]How to achieve the transition of structural failure state; (2) How to quickly and accurately generate the backbone and main branches of a structural system failure tree. In the reliability analysis of the actual engineering system of cable-stayed bridges, the core issue (2) is addressed through the aforementioned correctionβThe boundary method can effectively avoid the combination explosion of failure modes. Therefore, changing the topological relationship of the structure and simulating the actual stress of the structure is the key to accurately calculating the reliability of the cable-stayed bridge system.
The topological changes during the search for failure modes of cable-stayed bridges are mainly the structural topological changes after cable failure and main beam bending failure. According to the theory of structural reliability, in the process of searching for failure modes, the latest failed unit is deleted, and the state of the structure is changed by applying virtual loads to the nodes where the failed unit is located, thus entering the next stage of the failure process. For ductile failure, the magnitude of the virtual load is equal to the critical bearing capacity of the element; For brittle failure, the magnitude of the virtual load is equal to 0[26]Bruneau[1]It is believed that the reliability index of the structural system is lower when considering brittle failure of the cable element than when considering ductile failure. Therefore, this paper assumes that the cable element undergoes brittle failure. Bruneau[1]The method of adding plastic hinges after the main beam bending failure was adopted to analyze 14 failure modes of a cable-stayed bridge main beam. However, in the actual reliability analysis of cable-stayed bridges, it is generally believed that once the main beam produces plastic hinges, it already affects the performance of the cable-stayed bridge and is considered a failure of the structural system. Although the above approach is simple and feasible, it tends to be conservative and cannot obtain the actual complete failure path of the cable-stayed bridge. Therefore, this article adds plastic hinges to the candidate failure elements of the main beam to advance the structural topology to the next stage until the system failure criterion is reached.
For long-span cable-stayed bridges, geometric nonlinear effects are significant and must be considered in system reliability analysis[2].
The sag effect of cable-stayed bridge cables can introduce equivalent elastic modulus[29]Consider, its expression is
| Eeq =E01+γ2S2E0/(12σ3) | (20) |
In the formula:EeqTo consider the effect of sag on the equivalent elastic modulus of the cable;E0The elastic modulus of the inclined cable material;γSevere inclined cable;SThe horizontal projection length of the inclined cable;σStress on the inclined cable.
There is a significant initial tension in the inclined cable, which can generate significant axial forces in the cable tower and main beam, resulting in beam column effects.
Due to its flexible structure, large-span cable-stayed bridges will experience significant deformation under external loads. Therefore, it is necessary to consider adjusting the structural coordinates to the new equilibrium position during each level of load application.
When calculating the static reliability of cable-stayed bridges, ignoring the sag effect of the cables will overestimate the static reliability of the cable-stayed bridge, while the effects of beam column and large displacement on the reliability results can be ignored[3]Due to the small impact of beam column effect and large displacement effect on the static reliability of cable-stayed bridges, this paper only considers the geometric nonlinearity of cable sag effect in reliability calculation.
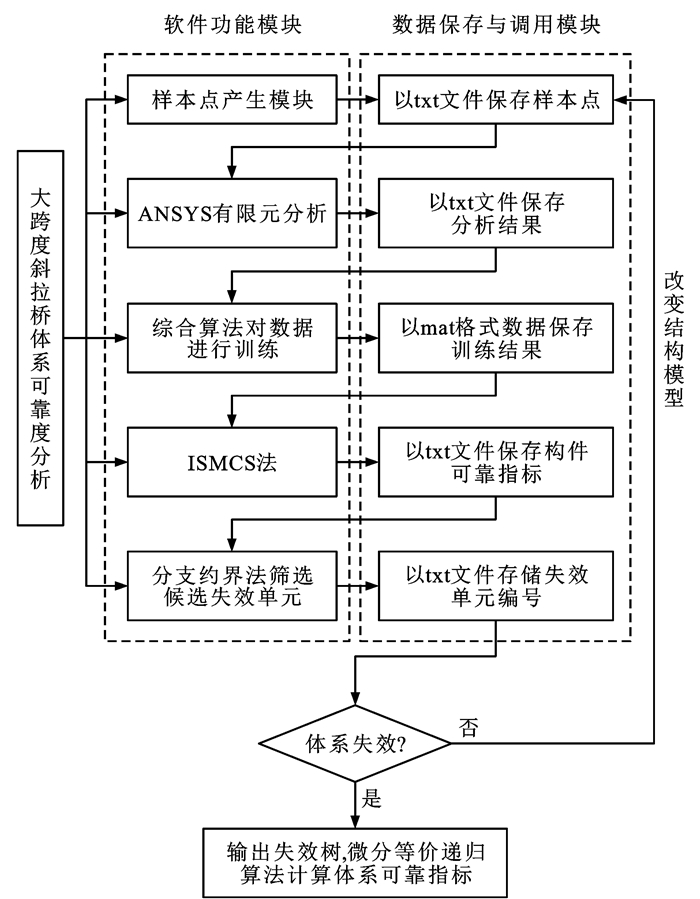
Based on the reliability indicators of the components mentioned above, GBGMC, system failure mode search, and system reliability calculation methods, combined with the reliability analysis model of cable-stayed bridges, a large-span cable-stayed bridge system reliability calculation program was jointly developed using MATLAB and ANSYS. The main functions and data exchange process are as follows:Figure 3As shown.
In order to verify the correctness and effectiveness of GBGMC, the calculation program developed previously was used, combined with three classic cases of reliability analysis, to verify its correctness and effectiveness.
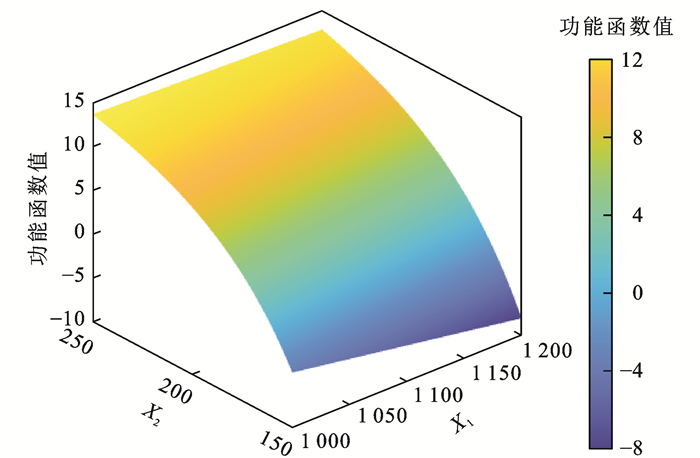
The expression for a certain nonlinear limit state equation is
| 18. 46154−74769.23X1/X32=0 | (21) |
In the formula:X1、X2As random variables, they all follow a normal distribution,X1~N(1 000, 200),X2~N(250, 37.5).
Using the trial and error method, the number of hidden layer nodes in the BP neural network is determined to be 5, the GA evolution number is 10, the population size is 50, the crossover probability and mutation probability are 0.8 and 0.1, respectively. MCS is used to randomly simulate 200 samples, of which 180 are randomly selected as training samples and the remaining 20 are used as test samples. We introduced GA training samples and constructed a BP neural network that accurately simulates the limit state equation, and used MCIS sampling to calculate the reliability index. Due to the low correlation between the calculation results of MCS and the number of random variables and the complexity of the limit state equation, the failure probability can be directly calculated, which is commonly used for comparative analysis with other methods. Therefore, this article selects the calculation results of MCS (sampled 1 million times) to compare with other methods. GBGMC and FORM RSM、MCS、 The comparison of the calculation results of traditional BP neural networks is listed inTable 1.
| 方法 | 验算点 | 可靠指标 | 失效概率 |
| FORM | (1 118.546 5, 165.464 7) | 2.331 | 9.88×10⁻³ |
| RSM | (1 125.711 5, 165.816 4) | 2.331 | 9.87×10⁻³ |
| MCS | 2.336 | 9.74×10⁻³ | |
| BP神经网络 | 2.361 | 9.12×10⁻³ | |
| GBGMC | (1 125.257 0, 165.986 3) | 2.334 | 9.82×10⁻³ |
 DownLoad:
CSV
DownLoad:
CSV
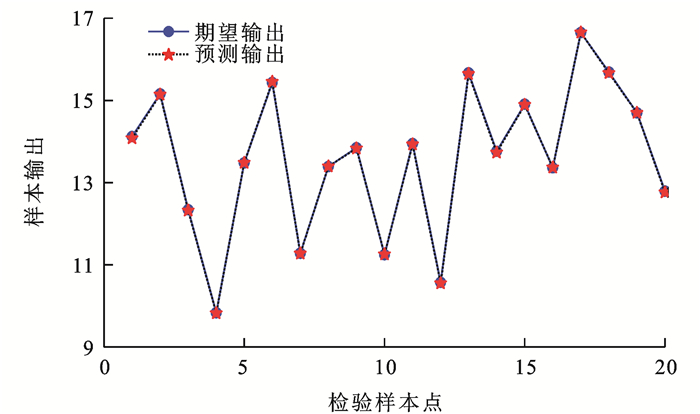
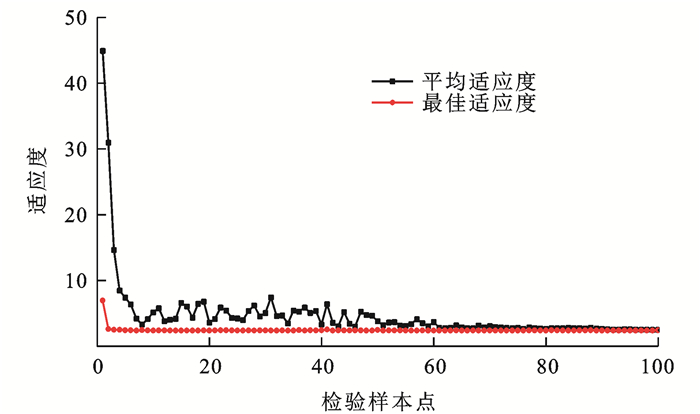
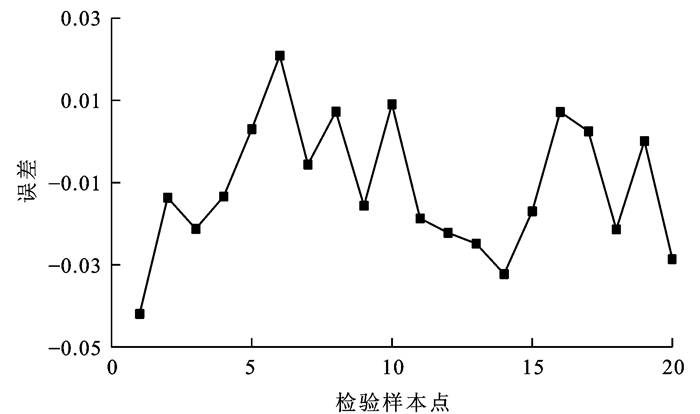
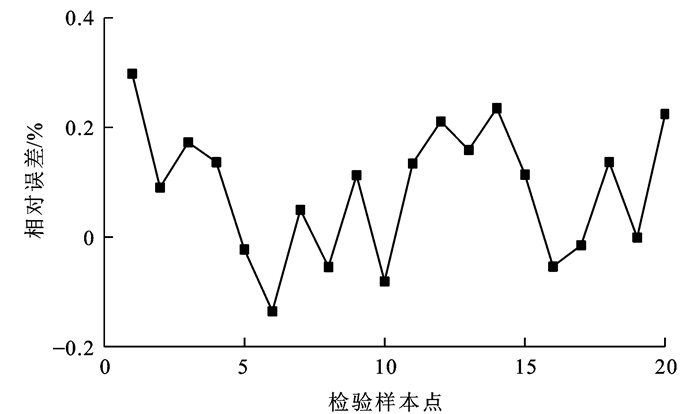
Figure 4~7The comparison between the predicted output and expected output, error curve (predicted output expected output), relative error curve (error/expected output), and GA fitness curve of the GA optimized BP neural network after training were provided. It can be seen that the error rate of GBGMC is within 0.3%, and the fitness function converges sharply, which can quickly find the verification point and approach the exact solution. The limit state surface of Example 1 is as followsFigure 8As shown.


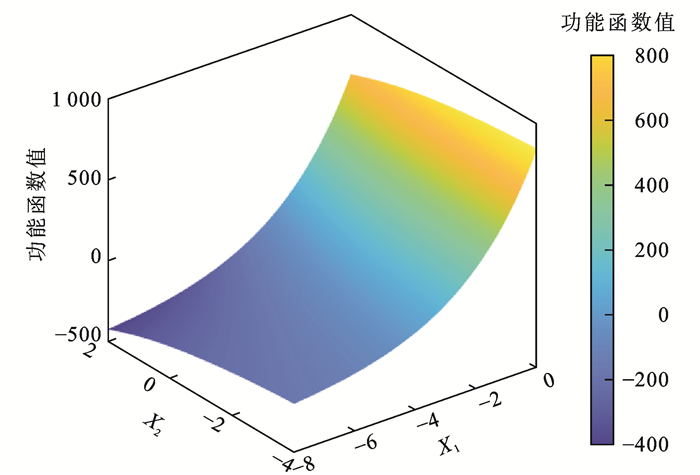
The expression for a certain nonlinear limit state equation is
| exp(0.4X1+7)−exp(0.3X2+5)−200=0 | (22) |
random variableX1、X2All follow a standard normal distribution, solve for their reliability index.
This example is based on the calculation results of MCS (sampling 1 million times), using FORM RSM、 The traditional BP neural network was used to validate GBGMC, and the calculation results are listed in the tableTable 2The limit state surface is as followsFigure 9As shown. Analysis shows that the relative error of GBGMC calculation results is 0.03%, which is more accurate than FORM and RSM. The GBGMC method uses 5 hidden nodes and can converge with 80 training samples after GA optimization. Compared with the traditional BP neural network with 10 hidden nodes and 1000 training samples, the computational efficiency and accuracy have been greatly improved.
| 方法 | 验算点 | 可靠指标 | 失效概率 |
| FORM | (-2.539 7, 0.945 3) | 2.710 | 3.40×10⁻³ |
| RSM | (-2.458 6, 1.159 5) | 2.718 | 3.30×10⁻³ |
| MCS | 2.688 | 3.60×10⁻³ | |
| BP神经网络 | 2.702 | 3.40×10⁻³ | |
| GBGMC | (-2.627 0, 0.827 6) | 2.688 | 3.60×10⁻³ |
DownLoad:
CSV

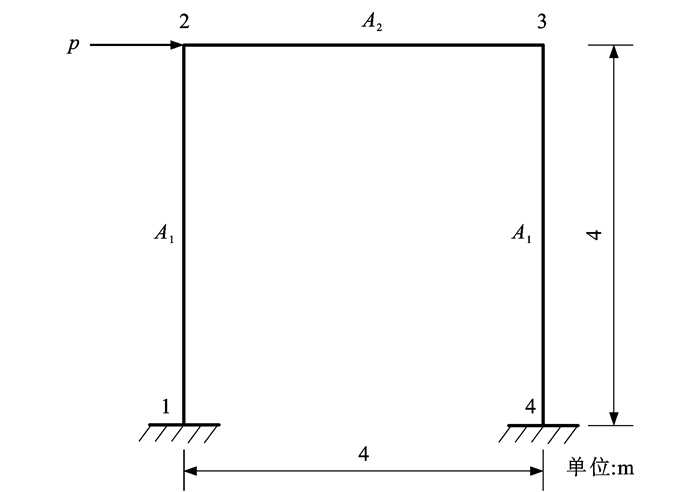
in compliance withFigure 10The framework structure shown, with nodes 1 to 4, has a limit state equation for the horizontal displacement of node 3

| g(X)=0.01−u3(X) | (23) |
| X=(A1,A2,p)T | (24) |
In the formula:u3(X)The horizontal displacement of node 3;A1The cross-sectional area of the column;A2The cross-sectional area of the beam;pFor horizontal loads.
A1、A2Following a lognormal distribution,pObey the extreme value type I extreme value distribution,A1The mean and standard deviation of are 0.36 and 0.036, respectivelym2,A2The mean and standard deviation of are 0.16 and 0.018, respectivelym2,pThe mean and standard deviation of the structure are 20 kN and 5 kN, respectively, and the elastic modulus of the structure isEFor 2.0 × 10⁹Pa。
Inertia moment of beams and columnsI1、I2respectively
| I1=A2112I2=A226 |
It can be solved by knowledge of structural mechanics
| u3(X)=(48q+32)p(18q+3)EI1 | (25) |
| q=I2I1 | (26) |
Based on the calculation results of MCS (sampling 1 million times), the reliability of the above structure was calculated using both traditional BP neural network and GBGMC in this paper. The calculation results are listed in the tableTable 3.
| 可靠度计算方法 | 可靠指标 | 失效概率 |
| MCS | 2.835 | 2.30×10⁻³ |
| BP神经网络(隐节点20个,抽样10万次) | 2.819 | 2.40×10⁻³ |
| GBGMC(隐节点10个,抽样1万次) | 2.831 | 2.30×10⁻³ |
DownLoad:
CSV
causeTable 3It can be seen that the reliability index calculated according to GBGMC is closest to the MCS result, and the calculation efficiency is improved by 100 times, which verifies the accuracy and efficiency of our method in structural reliability calculation.
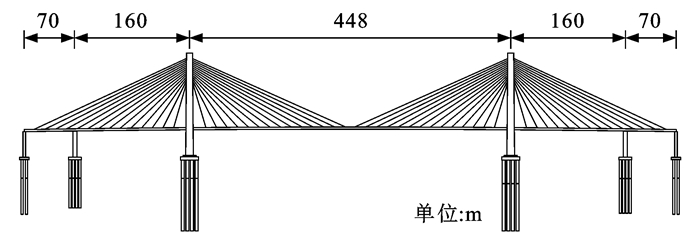
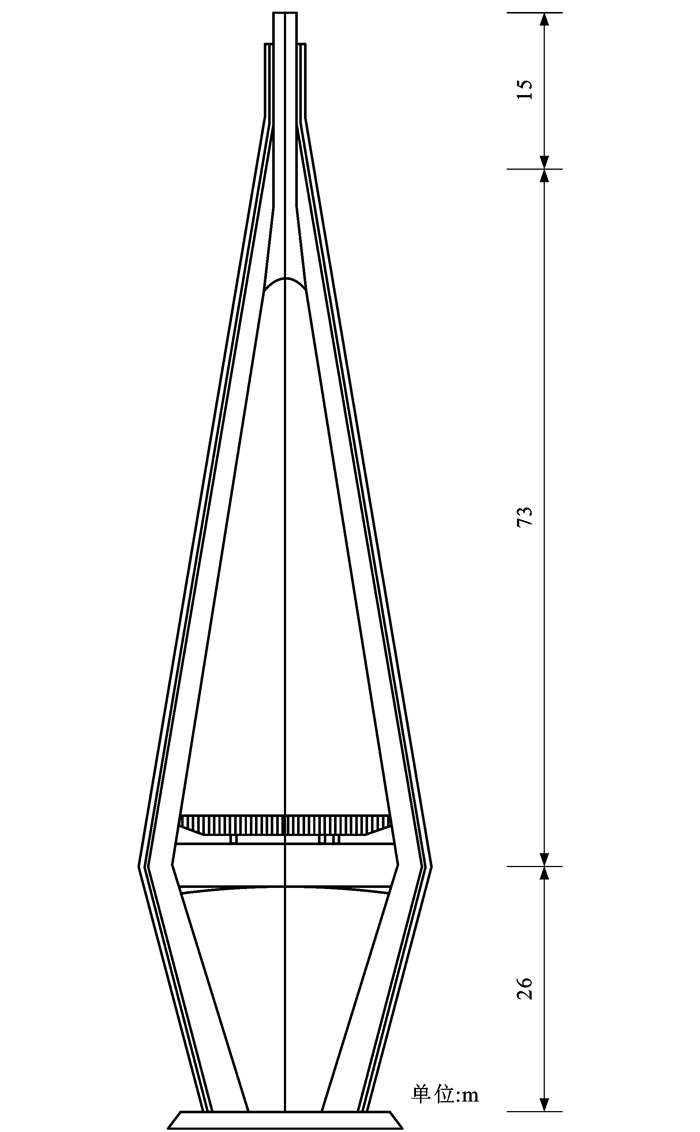
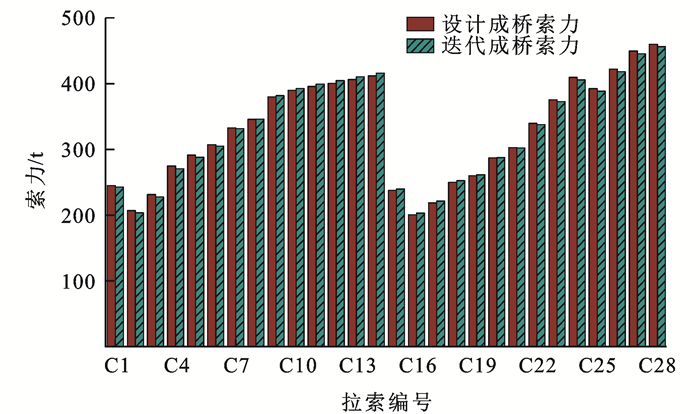
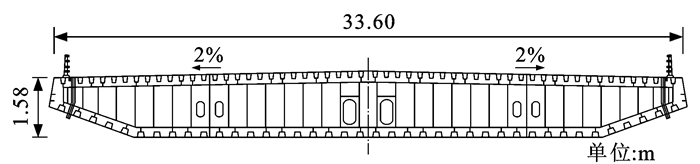
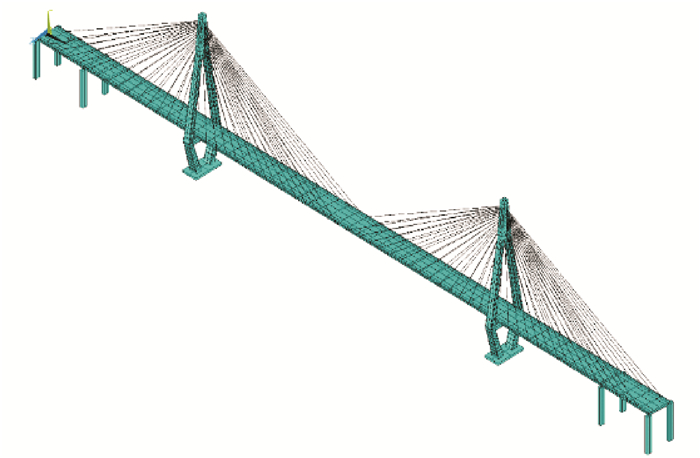
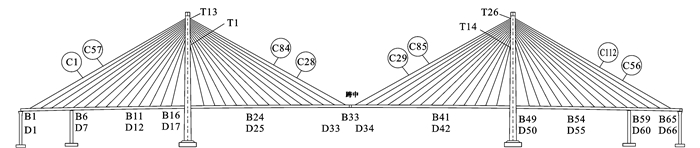
A certain cable-stayed bridge is a semi floating structure system with double towers and double cable planes, with a span arrangement of (70+160+448+160+70) m=908 m, and auxiliary piers and transition piers are set on both sides; The main tower is a diamond shaped bridge tower, with hollow rectangular rounded sections and reinforced concrete structures for the tower columns; The main beam is a streamlined flat steel box girder, with a bridge width of 33.6 meters, six lanes in both directions, and a live load of highway level I. The layout of the main bridge facade, the standard cross-section of the steel box girder, and the general structure of the cable tower are as followsFigure 11~13As shown. Establish a finite element model of the cable-stayed bridge using ANSYS, such asFigure 14As shown in the figure, the main beam and cable tower elements use Beam44 beam elements, and the inclined cables are simulated using Link10 rod elements. Based on the APDL programming language in ANSYS, an iterative optimization program for the cable force of the cable-stayed bridge is developed to calibrate the bridge completion state model. The input cable force of the bridge is iteratively calculated to ensure that the error between the finite element model completion cable force and the design drawing cable force is within 2%. The relationship between the iterative calculation cable force and the design cable force is as follows:Figure 15andTable 4As shown. The numbering of the main components of the entire bridge is as followsFigure 16As shown, the cable numbers are C1~C112, the main beam numbers are B1~B65, the main beam displacement numbers are D1~D66, and the cable tower numbers are T1~T26.


| 编号 | 设计索力/kN | 计算索力/kN | 误差率/ % | 编号 | 计算索力/kN | 误差率/ % | |
| C1 | 25.03 | 24.79 | 0.99 | C15 | 24.47 | 0.85 | |
| C2 | 21.12 | 70.78 | 1.67 | C16 | 20.74 | 1.30 | |
| C3 | 23.64 | 23.26 | 1.64 | C17 | 22.59 | 1.16 | |
| C4 | 28.05 | 27.62 | 1.54 | C18 | 25.78 | 0.95 | |
| C5 | 29.74 | 29.40 | 1.14 | C19 | 26.69 | 0.53 | |
| C6 | 31.37 | 31.15 | 0.69 | C20 | 29.35 | 0.12 | |
| C7 | 33.96 | 33.87 | 0.26 | C21 | 30.84 | 0.28 | |
| C8 | 35.29 | 35.34 | 0.13 | C22 | 34.47 | 0.58 | |
| C9 | 38.79 | 38.98 | 0.49 | C23 | 38.04 | 0.75 | |
| C10 | 39.79 | 40.08 | 0.74 | C24 | 41.42 | 0.95 | |
| C11 | 40.36 | 40.77 | 0.91 | C25 | 39.65 | 1.01 | |
| C12 | 40.89 | 41.30 | 1.00 | C26 | 42.69 | 0.95 | |
| C13 | 41.47 | 41.90 | 1.02 | C27 | 45.49 | 0.87 | |
| C14 | 42.05 | 42.47 | 0.99 | C28 | 46.59 | 0.79 |
DownLoad:
CSV
Based on the structural characteristics of the cable-stayed bridge and the actual parameters of the bridge structure, 21 random variables that have a significant impact on the stress of the cable-stayed bridge are selected for reliability analysis[3, 30]The probability distribution type and statistical characteristic values are as follows:Table 5As shown.
| 随机变量名称 | 变量分类 | 变量分布类型 | 均值 | 标准差 |
| 弹性模量/GPa | 主梁 | 正态 | 200 | 20.0 |
| 索塔 | 正态 | 36 | 3.6 | |
| 斜拉索 | 正态 | 205 | 20.5 | |
| 截面面积/m2 | 主梁 | 对数正态 | 1.76 | 0.18 |
| 索塔下部 | 对数正态 | 27.50 | 1.37 | |
| 索塔中部 | 对数正态 | 17.80 | 0.89 | |
| 索塔上部 | 对数正态 | 63.90 | 3.20 | |
| 109型斜拉索 | 对数正态 | 7.85×10⁻³ | 7.85×10⁻⁵ | |
| 139型斜拉索 | 对数正态 | 9.50×10⁻³ | 9.50×10⁻⁵ | |
| 151型斜拉索 | 对数正态 | 1.04×10⁻² | 1.04×10⁻⁴ | |
| 163型斜拉索 | 对数正态 | 1.13×10⁻² | 1.13×10⁻⁴ | |
| 187型斜拉索 | 对数正态 | 1.23×10⁻² | 1.23×10⁻⁴ | |
| 199型斜拉索 | 对数正态 | 1.54×10⁻² | 1.54×10⁻⁴ | |
| 惯性矩/m4 | 主梁 | 对数正态 | 3.83 | 0.19 |
| 索塔下部 | 对数正态 | 166.00 | 8.28 | |
| 索塔中部 | 对数正态 | 60.90 | 3.04 | |
| 索塔上部 | 对数正态 | 225.00 | 11.30 | |
| 材料容重/(kg·m-3) | 主梁 | 正态 | 7.70×10³ | 770.00 |
| 索塔 | 正态 | 2.60×10³ | 160.00 | |
| 拉索 | 正态 | 7.85×10³ | 785.00 | |
| 荷载集度/(kN·m-1) | 活载 | 正态 | 63.00 | 6.30 |
DownLoad:
CSV
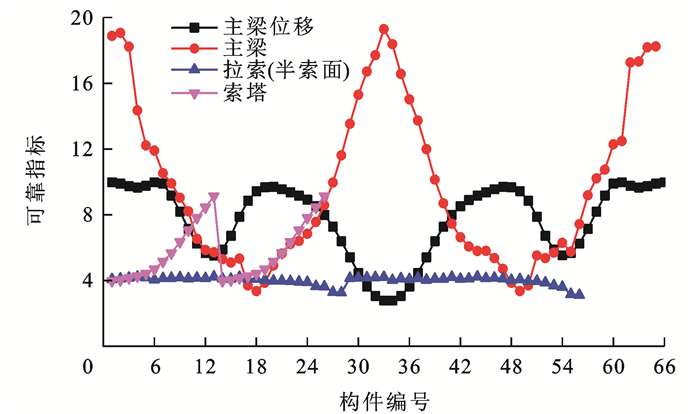
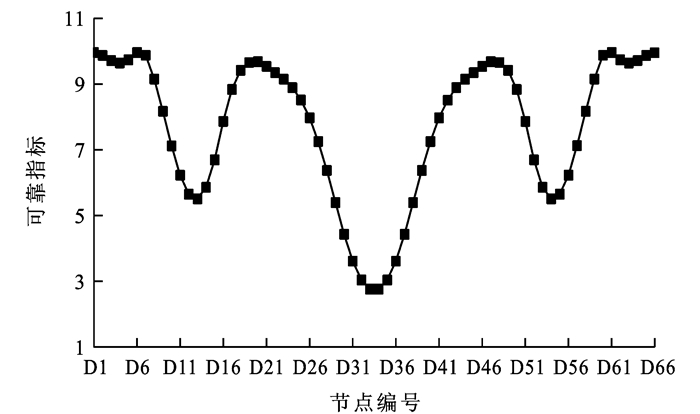
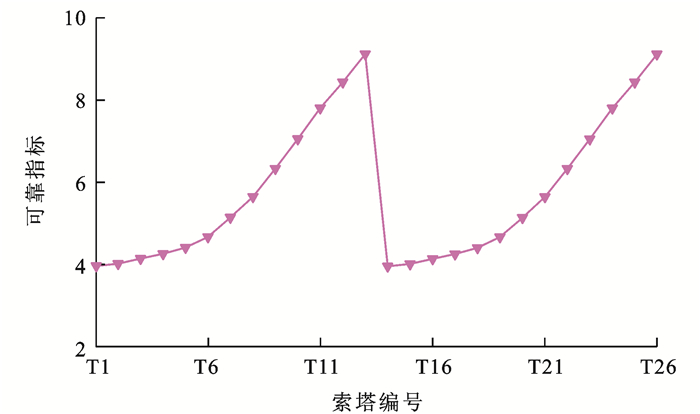
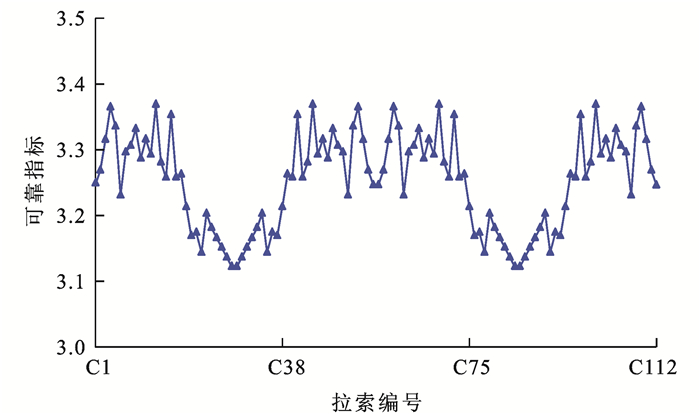
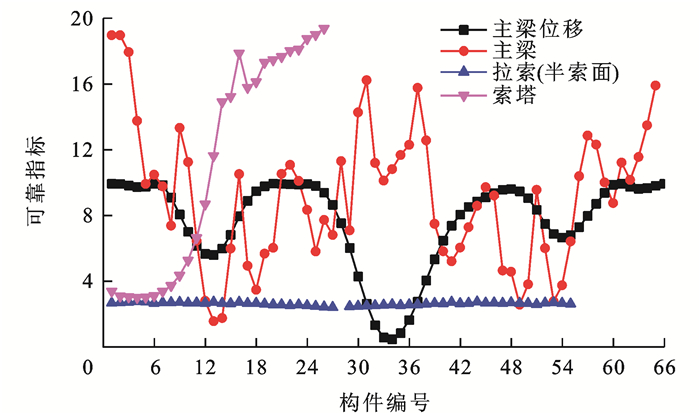
Based on the failure function of the components of the cable-stayed bridge mentioned above, combined with the GBGMC proposed in this paper, the reliability of each key component of the cable-stayed bridge is calculated, and the changes in the reliability indicators of the components are plottedFigure 17~21As shown.


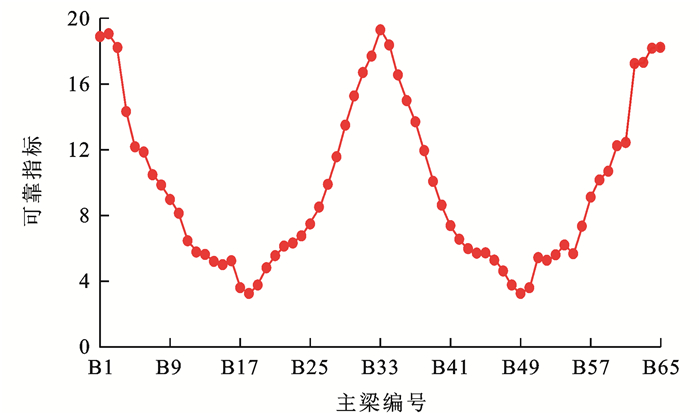


From the figure, it can be seen that the risk of the displacement of the main beam in the first stage of the cable-stayed bridge exceeding the standard limit is the highest, which means that the bridge does not meet its normal use function at the beginning. The reliability index for the displacement exceeding the limit in the mid span is 2.7. In the reliability index of component bearing capacity, the mid span diagonal cables C27, C28, C29, and C30 have the lowest values of 3.1. According to the aforementioned failure mode search criteria, the reliability index is less thanβC, 1=1.29+0.86βmin, 1=The component with 1.29+0.86 × 3.1=3.96 becomes a candidate failure unit for the first stage.
According to the search criteria, the main beam element B18 at the root of the cable tower bears a significant negative bending moment and axial force, making it a candidate failure element; The lower unit T1 in the anchorage zone of the Sota Lasso is subjected to significant bending moments and axial forces, making it a candidate failure unit; The reliability indicators of inclined cables are not significantly different, all within the approximate range, but the reliability indicators of mid span cables are relatively lower. C27 and C28 are selected as candidate failure units. After any candidate unit fails in this stage, the topology of the finite element model is changed, the reliability indicators of each key component are recalculated, and the candidate failure units for the next stage are screened until the overall failure criterion is reached, forming a complete failure mode. Repeat the above steps to search for all the main failure modes of the cable-stayed bridge.
Due to space limitations, taking the C28 failure of the mid span cable as an example, considering the brittle failure of the cable, the C28 element is removed from the finite element model, and the structural analysis is re conducted to calculate the reliability index of the second stage component, such asFigure 22As shown.
After the failure of the mid span long cable in the main span, the mid span displacement of the cable-stayed bridge first exceeded the limit, and the overall reliability index of the cable decreased. However, the non broken cable side tower was subjected to force unloading, and the reliability index increased. Due to the unbalanced force generated by the broken cable, the bending moment of the main beam B13 unit increased, and the reliability index decreased significantly.
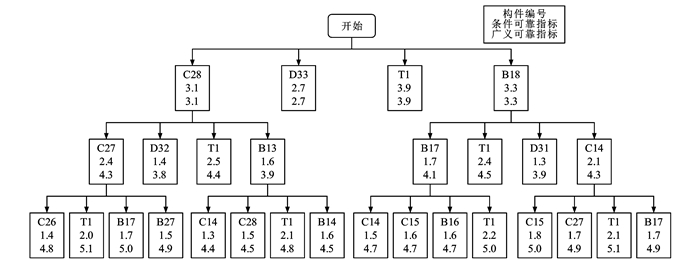
Repeat the above steps and search for the main failure modes of the cable-stayed bridge according to the agreed overall failure criteria. Establish a structural failure tree for the cable-stayed bridge, such asFigure 23As shown.

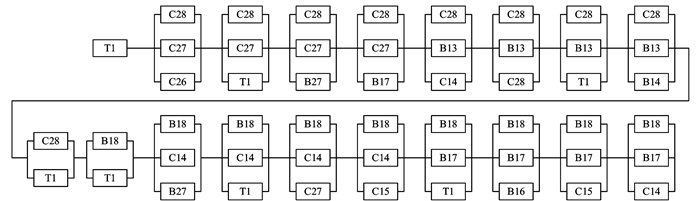
From the failure tree, it can be seen that cable-stayed bridges are most likely to break through the normal service limit state, that is, the mid span displacement is prone to exceed the specification limit. In terms of the load-bearing capacity of the components, the overall difference in the reliability index of the cables is relatively small, and the mid span cables are subjected to large forces, resulting in relatively low reliability index and easy occurrence of cable breakage failure; The axial force of the main beam at the tower root is relatively large. Due to the semi floating structure, the negative bending moment of the main beam at this location is large, and the main beam is prone to strength failure; The lower part of the anchorage point of the cable tower has a large bending moment and axial force, which is prone to failure. As the main load-bearing component of the cable-stayed bridge, the failure of any cable tower unit will directly lead to the overall failure of the cable-stayed bridge. Based on the failure tree, select 19 main failure modes that affect the structural load-bearing capacity failure, and construct a series parallel model for the reliability calculation of the static system of cable-stayed bridges, such asFigure 24As shown.
Based on the verification points and reliability indicators of each failed component in each failure mode, the equivalent linear safety margin equation for each failure mode is gradually constructed using equation (12), making it easy to calculate the equivalent reliability indicators and their correlation coefficients for each failure mode of the cable-stayed bridge. According to equation (13), the differential equivalent recursive algorithm is used to calculate the reliability index of the application example cable-stayed bridge system, which is 3.8.
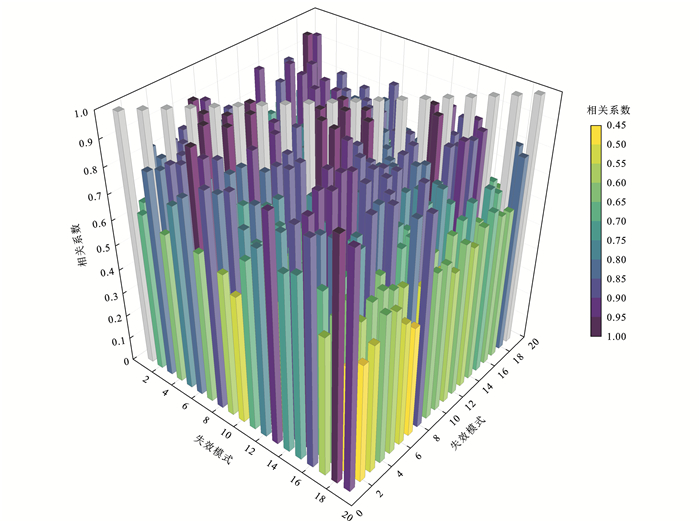
The correlation coefficients of the 19 main failure modes of the cable-stayed bridge are as follows:Figure 25As shown, it can be seen that the correlation coefficient between failure modes of components of the same type is relatively high, while the correlation coefficient between failure modes of components of different types is relatively low.

(1) The genetic algorithm (GA) is used to optimize the initial weights and thresholds of the BP neural network and search for verification points to improve training efficiency and calculation accuracy. An efficient algorithm GBGMC for component reliability index is proposed and applied to the system reliability analysis of cable-stayed bridges.
(2) Taking a cable-stayed bridge with a main span of 448 meters as an example, the main failure modes of the ultimate limit state of bearing capacity were searched, and a structural failure tree was established to calculate the system reliability, verifying the effectiveness and practicality of the method proposed in this paper.
(3) Under the limit state of normal use, the mid span displacement of cable-stayed bridges is most likely to exceed the specification limit; Under the ultimate limit state of bearing capacity, the reliability index of inclined cables is not significantly different, and the reliability index of mid span long cables is the lowest; The main beam experiences significant axial force and negative bending moment at the tower root, making it prone to strength failure; The lower part of the anchorage point of the cable tower has a large bending moment and axial force, which poses a high risk of failure.
(4) In the first stage of structural system failure, the failure of the long cables in the middle span of the cable-stayed bridge leads to the failure of the main beam strength near the tower root of the side span; After the failure of the main beam at the tower root, adjacent main beam units and inclined cables at the tower root failed.
(5) Based on the 19 main failure modes that affect the structural load-bearing capacity, the reliability index of this bridge system is calculated to be 3.8, which can support the reliability design of the cable-stayed bridge system.
| [1] |
BRUNEAU M. Evaluation of system-reliability methods for cable-stayed bridge design[J]. Journal of Structural Engineering, 1992, 118(4): 1106-1120. doi: 10.1061/(ASCE)0733-9445(1992)118:4(1106)
|
| [2] |
CHEN Tie-bing, WANG Shu-qing, SHI Zhi-yuan. Reliability analysis of cable-stayed bridges considering geometrical non-linearity[J]. Journal of Tongji University (Natural Science), 2000, 28(4): 407-412. (in Chinese)
|
| [3] |
CHENG Jin, XIAO Ru-cheng. Static reliability analysis of cable-stayed bridges[J]. Journal of Tongji University (Natural Science), 2004, 32(12): 1593-1598. (in Chinese)
|
| [4] |
WANG Da, TANG Hao. The static system reliability of cable-stayed bridges using the response surface method[J]. Journal of Transport Science and Engineering, 2014, 30(2): 34-39. (in Chinese)
|
| [5] |
YAN Dong-huang, GUO Xin. Influence of damage of stay cables on system reliability of in-service cable-stayed bridges[J]. Journal of Central South University (Science and Technology), 2020, 51(1): 213-220. (in Chinese)
|
| [6] |
LIU Jian, YAN Cheng, FANG Qi-yang, et al. Reliability analysis of long-span bridges based on combination of response surface method and JC method[J]. Bridge Construction, 2022, 52(4): 32-38. (in Chinese)
|
| [7] |
LIU Yang, LU Nai-wei, JIANG You-bao. Adaptive support vector regression method for structural system reliability analysis[J]. Journal of Zhejiang University(Engineering Science), 2015, 49(9): 1692-1699. (in Chinese)
|
| [8] |
LU Nai-wei, LIU Yang, BEER M. Reliability and Safety of Cable-Supported Bridges[M]. London: CRC Press, 2021.
|
| [9] |
LIU Yang, LU Nai-wei, YIN Xin-feng. System reliability assessment of long-span cable-stayed bridges using an updating support vector algorithm[J]. Chinese Journal of Computational Mechanics, 2015, 32(2): 154-159. (in Chinese)
|
| [10] |
ZHANG Jian-ren, LIU Yang. Reliability analysis of cable-stayed bridge using GAS and ANN[J]. China Civil Engineering Journal, 2001, 34(1): 7-13. (in Chinese)
|
| [11] |
LI Jian-hui, LI Ai-qun, MARIA Q. FENG, et al. Sensitivity and reliability analysis of a self-anchored suspension bridge[J]. Journal of Bridge Engineering, 2013, 18(8): 703-711. doi: 10.1061/(ASCE)BE.1943-5592.0000424
|
| [12] |
CHENG Jin. An artificial neural network based genetic algorithm for estimating the reliability of long span suspension bridges[J]. Finite Elements in Analysis and Design, 2010, 46(8): 658-667. doi: 10.1016/j.finel.2010.03.005
|
| [13] |
SU Hong. Study on structural reliability analysis method of long span suspension bridge[D]. Shanghai: Tongji University, 2009. (in Chinese)
|
| [14] |
SHAO S, MUROTSU Y. Approach to failure mode analysis of large structures[J]. Probabilistic Engineering Mechanics, 1999, 14(1/2): 169-177.
|
| [15] |
LUO Xiao-yu, WANG Chun-sheng, YAO Shu-kui, et al. Identification of system failure modes of steel bridges based on bi-directional evolutionary structual optimization[J]. China Journal of Highway and Transport, 2017, 30(3): 31-39. (in Chinese)
|
| [16] |
WANG Chun-sheng, CHEN Wei-zhen, CHEN Ai-rong. System fatigue reliability assessment of riveted steel bridges[J]. China Journal of Highway and Transport, 2008, 21(5): 45-49. (in Chinese)
|
| [17] |
WANG Chun-sheng, NIE Jian-guo, CHEN Ai-rong, et al. Systems fatigue reliability assessment of existing steel railway bridges[J]. Journal of Tsinghua University (Science and Technology), 2005, 45(9): 1157-1161. (in Chinese)
|
| [18] |
ZHANG Xiao-qing. Study on the analysis methods of structural system reliability[D]. Dalian: Dalian University of Technology, 2003. (in Chinese)
|
| [19] |
ZHANG Xiao-qing, KANG Hai-gui, WANG Fu-ming. An improved differential equivalent recursion algorithm[J]. China Civil Engineering Journal, 2004, 37(1): 31-38. (in Chinese)
|
| [20] |
KIM S H, NA S W. Response surface method using vector projected sampling points[J]. Structural Safety, 1997, 19(1): 3-19.
|
| [21] |
HAGAN M T, DEMUTH H B, BEALE M H. Neural Network Design[M]. Boston: PWS Publishing Company, 1997.
|
| [22] |
LOPES P A M, GOMES H M, AWRUCH A M. Reliability analysis of laminated composite structures using finite elements and neural networks[J]. Composite Structures, 2010, 92(7): 1603-1613.
|
| [23] |
GONG Chun-ling. Construction risk analysis and countermeasures research of long span cable-stayed bridges[D]. Shanghai: Tongji University, 2006. (in Chinese)
|
| [24] |
SHEN Hua-yu, WANG Zhao-xia, GAO Cheng-yao, et al. Determining the number of BP neural network hidden layer units[J]. Journal of Tianjin University of Technology, 2008, 24(5): 13-15. (in Chinese)
|
| [25] |
CHENG J. Optimum design of steel truss arch bridges using a hybrid genetic algorithm[J]. Journal of Constructional Steel Research, 2010, 66(8/9): 1011-1017.
|
| [26] |
THOFT-CHRISTENSEN P, MUROTSU Y. Application of Structural Systems Reliability Theory[M]. Berlin: Springer, 2012.
|
| [27] |
DONG Cong. Reliability theory of structural systems: advance and review[J]. Engineering Mechanics, 2001, 18(4): 79-89, 59. (in Chinese)
|
| [28] |
YU Jian-xing. Engineering Structure Reliability Theory and Optimization Design[M]. Beijing: China Architecture and Building Press, 2013. (in Chinese)
|
| [29] |
ERNST H J. Der E-modul von seilen unter bercksichtigung des durchhanges[J]. Der Bauingenieur, 1965, 40(2): 52-55.
|
| [30] |
LIU Y, LU N, YIN X, et al. An adaptive support vector regression method for structural system reliability assessment and its application to a cable-stayed bridge[J]. Journal of Risk and Reliability, 2016, 230(2): 204-219.
|
| [1] | YAN Ban-fu, OUYANG Kang, LIANG Cai. Review on research of non-contact displacement measurement technologies in bridge engineering[J]. Journal of Traffic and Transportation Engineering, 2024, 24(1): 43-67. doi: 10.19818/j.cnki.1671-1637.2024.01.003 |
| [2] | YU Chao-jun, JIANG Ju, XU Hai-yan, ZHU Ping. Multi-objective optimization of flight-gate assignment based on improved genetic algorithm[J]. Journal of Traffic and Transportation Engineering, 2020, 20(2): 121-130. doi: 10.19818/j.cnki.1671-1637.2020.02.010 |
| [3] | HAN Wan-shui, LIU Xiu-ping, DENG Lu, DU Qun-le, LI Guang-ling. Updating method of bridge finite element model based on real coded genetic algorithm[J]. Journal of Traffic and Transportation Engineering, 2019, 19(2): 14-24. doi: 10.19818/j.cnki.1671-1637.2019.02.002 |
| [4] | WANG Li-feng, WANG Er-qiang, SUN Yong-cun, HE Dong-po, GE Jun-ying. Mechanical properties of ten thousand-ton class cable-stayed bridge in rotation construction process[J]. Journal of Traffic and Transportation Engineering, 2015, 15(3): 52-61. doi: 10.19818/j.cnki.1671-1637.2015.03.007 |
| [5] | ZHU Hui-ling, JI Ming-jun. Optimal model and improved genetic algorithm of containership stowage on full route[J]. Journal of Traffic and Transportation Engineering, 2014, 14(5): 59-67. |
| [6] | LI Rui-min, MA Wei. Fusion method of road section average speed based on BP neural network and D-S evidence theory[J]. Journal of Traffic and Transportation Engineering, 2014, 14(5): 111-118. |
| [7] | WANG Ping, LIU Hao, WEI Xian-kui, XIAO Jie-ling. Analysis of longitudinal force regulation for CWR on railway cable-stayed bridge[J]. Journal of Traffic and Transportation Engineering, 2013, 13(5): 27-32. |
| [8] | YAN Bin, DAI Gong-lian, DONG Lin-yu. Design parameters of track-bridge interaction on passenger dedicated line cable-stayed bridge[J]. Journal of Traffic and Transportation Engineering, 2012, 12(1): 31-37. doi: 10.19818/j.cnki.1671-1637.2012.01.006 |
| [9] | LI Yong-le, LI Xin, XIANG Huo-yue, LIAO Hai-li. Coupling vibration of wind-vehiche-bridge system for long-span steel truss cable-stayed bridge[J]. Journal of Traffic and Transportation Engineering, 2012, 12(5): 22-27. doi: 10.19818/j.cnki.1671-1637.2012.05.003 |
| [10] | ZHOU Kui, LI Shen-zhen, SONG Zi-shou, LI Hu-sheng. Damage identification of cable-stayed bridge based on wavelet packet and random-fuzzy statistic of frequency response function[J]. Journal of Traffic and Transportation Engineering, 2011, 11(2): 18-23. doi: 10.19818/j.cnki.1671-1637.2011.02.004 |
| [11] | QI Xing-jun, LI Xiao-jun, WANG Jing-wei. Influence of traveling wave effect on seismic mitigation control for long-span cable-stayed bridge[J]. Journal of Traffic and Transportation Engineering, 2008, 8(6): 70-76. |
| [12] | ZHANG Shang-yue, JIA Chuan-ying. Optimal celestial positioning constellation combination based on genetic algorithm[J]. Journal of Traffic and Transportation Engineering, 2004, 4(1): 110-113. |
| [13] | XU Xiao-hao, YAO Yuan. Application of genetic algorithm to aircraft sequencing in terminal area[J]. Journal of Traffic and Transportation Engineering, 2004, 4(3): 121-126. |
| [14] | BU Lei, YIN Chuan-zhong, PU Yun. Genetic algorithm for optimal arrangement of general piece goods[J]. Journal of Traffic and Transportation Engineering, 2004, 4(4): 84-87. |
| [15] | CHANG Yun-tao, PENG Guo-xiong. Urban arterial road coordinate control based on genetic algorithm[J]. Journal of Traffic and Transportation Engineering, 2003, 3(2): 106-112. |
| [16] | XU Jin-liang, WANG Hai-jun, YANG Shao-wei. Optimization of highway profile based on genetic algorithms[J]. Journal of Traffic and Transportation Engineering, 2003, 3(2): 48-52. |
| [17] | ZHANG Xu-she, DU Yan-liang, JIN Xiu-mei, SUN Bao-chen. In-suit monitoring for cables' tension with optical fiber grating sensors[J]. Journal of Traffic and Transportation Engineering, 2003, 3(4): 22-24. |
| [18] | BU Lei, LIU Hai-xu, PU Yun, YIN Chuan-zhong. Deciding to select and load piece goods in container by genetic algorithm[J]. Journal of Traffic and Transportation Engineering, 2002, 2(3): 93-96. |
| [19] | NIU Hui-min, HU An-zhou. A class of nonlinear optimization models for location of station by genetic algorithm[J]. Journal of Traffic and Transportation Engineering, 2002, 2(1): 80-84. |
| [20] | LI Xiao-zhen, CAI Jing, QIANG Shi-zhong. Train running safety and comfort analysis of the cable-stayed bridge on Wuhu Yangtze-river bridge[J]. Journal of Traffic and Transportation Engineering, 2002, 2(3): 34-40. |
| 1. | 吴逸凡,熊建桥,王宗荣,韩雨轩,周义术. 基于BP网络的堆垛机曳引绳实时监测技术. 起重运输机械. 2025(02): 99-104 .  | |
| 2. | 梁贤伟,郭子亮,袁梓文,穆保岗. 基于MRA-BP神经网络的桩基托换桥墩沉降预测模型研究. 特种结构. 2025(01): 82-86+97 . |

Figures(25) / Tables(5)
Copyright《Journal of Traffic and Transportation Engineering》编辑部陕ICP备05001904号-1
Address :Editorial Department of Journal of Traffic and Transportation Engineering, Chang 'an University, Middle Section of South Second Ring Road, Xi 'an, Shaanxi(710064) Tel:029-82334388 Email:jygc@chd.edu.cn
All visit:1713380Today's visit:40
Supported by:
Beijing Renhe Information Technology Co. Ltd

WANG Chun-sheng, HE Wen-long, ZHANG Wen-ting, YAO Shu-kui. Static system reliability analysis of cable-stayed bridge based on improved BP neural network[J]. Journal of Traffic and Transportation Engineering, 2024, 24(5): 86-100. doi: 10.19818/j.cnki.1671-1637.2024.05.006

| 方法 | 验算点 | 可靠指标 | 失效概率 |
| FORM | (1 118.546 5, 165.464 7) | 2.331 | 9.88×10⁻³ |
| RSM | (1 125.711 5, 165.816 4) | 2.331 | 9.87×10⁻³ |
| MCS | 2.336 | 9.74×10⁻³ | |
| BP神经网络 | 2.361 | 9.12×10⁻³ | |
| GBGMC | (1 125.257 0, 165.986 3) | 2.334 | 9.82×10⁻³ |
DownLoad:
CSV
| 方法 | 验算点 | 可靠指标 | 失效概率 |
| FORM | (-2.539 7, 0.945 3) | 2.710 | 3.40×10⁻³ |
| RSM | (-2.458 6, 1.159 5) | 2.718 | 3.30×10⁻³ |
| MCS | 2.688 | 3.60×10⁻³ | |
| BP神经网络 | 2.702 | 3.40×10⁻³ | |
| GBGMC | (-2.627 0, 0.827 6) | 2.688 | 3.60×10⁻³ |
DownLoad:
CSV
| 可靠度计算方法 | 可靠指标 | 失效概率 |
| MCS | 2.835 | 2.30×10⁻³ |
| BP神经网络(隐节点20个,抽样10万次) | 2.819 | 2.40×10⁻³ |
| GBGMC(隐节点10个,抽样1万次) | 2.831 | 2.30×10⁻³ |
DownLoad:
CSV
| 编号 | 设计索力/kN | 计算索力/kN | 误差率/ % | 编号 | 计算索力/kN | 误差率/ % | |
| C1 | 25.03 | 24.79 | 0.99 | C15 | 24.47 | 0.85 | |
| C2 | 21.12 | 70.78 | 1.67 | C16 | 20.74 | 1.30 | |
| C3 | 23.64 | 23.26 | 1.64 | C17 | 22.59 | 1.16 | |
| C4 | 28.05 | 27.62 | 1.54 | C18 | 25.78 | 0.95 | |
| C5 | 29.74 | 29.40 | 1.14 | C19 | 26.69 | 0.53 | |
| C6 | 31.37 | 31.15 | 0.69 | C20 | 29.35 | 0.12 | |
| C7 | 33.96 | 33.87 | 0.26 | C21 | 30.84 | 0.28 | |
| C8 | 35.29 | 35.34 | 0.13 | C22 | 34.47 | 0.58 | |
| C9 | 38.79 | 38.98 | 0.49 | C23 | 38.04 | 0.75 | |
| C10 | 39.79 | 40.08 | 0.74 | C24 | 41.42 | 0.95 | |
| C11 | 40.36 | 40.77 | 0.91 | C25 | 39.65 | 1.01 | |
| C12 | 40.89 | 41.30 | 1.00 | C26 | 42.69 | 0.95 | |
| C13 | 41.47 | 41.90 | 1.02 | C27 | 45.49 | 0.87 | |
| C14 | 42.05 | 42.47 | 0.99 | C28 | 46.59 | 0.79 |
DownLoad:
CSV
| 随机变量名称 | 变量分类 | 变量分布类型 | 均值 | 标准差 |
| 弹性模量/GPa | 主梁 | 正态 | 200 | 20.0 |
| 索塔 | 正态 | 36 | 3.6 | |
| 斜拉索 | 正态 | 205 | 20.5 | |
| 截面面积/m2 | 主梁 | 对数正态 | 1.76 | 0.18 |
| 索塔下部 | 对数正态 | 27.50 | 1.37 | |
| 索塔中部 | 对数正态 | 17.80 | 0.89 | |
| 索塔上部 | 对数正态 | 63.90 | 3.20 | |
| 109型斜拉索 | 对数正态 | 7.85×10⁻³ | 7.85×10⁻⁵ | |
| 139型斜拉索 | 对数正态 | 9.50×10⁻³ | 9.50×10⁻⁵ | |
| 151型斜拉索 | 对数正态 | 1.04×10⁻² | 1.04×10⁻⁴ | |
| 163型斜拉索 | 对数正态 | 1.13×10⁻² | 1.13×10⁻⁴ | |
| 187型斜拉索 | 对数正态 | 1.23×10⁻² | 1.23×10⁻⁴ | |
| 199型斜拉索 | 对数正态 | 1.54×10⁻² | 1.54×10⁻⁴ | |
| 惯性矩/m4 | 主梁 | 对数正态 | 3.83 | 0.19 |
| 索塔下部 | 对数正态 | 166.00 | 8.28 | |
| 索塔中部 | 对数正态 | 60.90 | 3.04 | |
| 索塔上部 | 对数正态 | 225.00 | 11.30 | |
| 材料容重/(kg·m-3) | 主梁 | 正态 | 7.70×10³ | 770.00 |
| 索塔 | 正态 | 2.60×10³ | 160.00 | |
| 拉索 | 正态 | 7.85×10³ | 785.00 | |
| 荷载集度/(kN·m-1) | 活载 | 正态 | 63.00 | 6.30 |
DownLoad:
CSV
| 方法 | 验算点 | 可靠指标 | 失效概率 |
| FORM | (1 118.546 5, 165.464 7) | 2.331 | 9.88×10⁻³ |
| RSM | (1 125.711 5, 165.816 4) | 2.331 | 9.87×10⁻³ |
| MCS | 2.336 | 9.74×10⁻³ | |
| BP神经网络 | 2.361 | 9.12×10⁻³ | |
| GBGMC | (1 125.257 0, 165.986 3) | 2.334 | 9.82×10⁻³ |
| 方法 | 验算点 | 可靠指标 | 失效概率 |
| FORM | (-2.539 7, 0.945 3) | 2.710 | 3.40×10⁻³ |
| RSM | (-2.458 6, 1.159 5) | 2.718 | 3.30×10⁻³ |
| MCS | 2.688 | 3.60×10⁻³ | |
| BP神经网络 | 2.702 | 3.40×10⁻³ | |
| GBGMC | (-2.627 0, 0.827 6) | 2.688 | 3.60×10⁻³ |
| 可靠度计算方法 | 可靠指标 | 失效概率 |
| MCS | 2.835 | 2.30×10⁻³ |
| BP神经网络(隐节点20个,抽样10万次) | 2.819 | 2.40×10⁻³ |
| GBGMC(隐节点10个,抽样1万次) | 2.831 | 2.30×10⁻³ |
| 编号 | 设计索力/kN | 计算索力/kN | 误差率/ % | 编号 | 计算索力/kN | 误差率/ % | |
| C1 | 25.03 | 24.79 | 0.99 | C15 | 24.47 | 0.85 | |
| C2 | 21.12 | 70.78 | 1.67 | C16 | 20.74 | 1.30 | |
| C3 | 23.64 | 23.26 | 1.64 | C17 | 22.59 | 1.16 | |
| C4 | 28.05 | 27.62 | 1.54 | C18 | 25.78 | 0.95 | |
| C5 | 29.74 | 29.40 | 1.14 | C19 | 26.69 | 0.53 | |
| C6 | 31.37 | 31.15 | 0.69 | C20 | 29.35 | 0.12 | |
| C7 | 33.96 | 33.87 | 0.26 | C21 | 30.84 | 0.28 | |
| C8 | 35.29 | 35.34 | 0.13 | C22 | 34.47 | 0.58 | |
| C9 | 38.79 | 38.98 | 0.49 | C23 | 38.04 | 0.75 | |
| C10 | 39.79 | 40.08 | 0.74 | C24 | 41.42 | 0.95 | |
| C11 | 40.36 | 40.77 | 0.91 | C25 | 39.65 | 1.01 | |
| C12 | 40.89 | 41.30 | 1.00 | C26 | 42.69 | 0.95 | |
| C13 | 41.47 | 41.90 | 1.02 | C27 | 45.49 | 0.87 | |
| C14 | 42.05 | 42.47 | 0.99 | C28 | 46.59 | 0.79 |
| 随机变量名称 | 变量分类 | 变量分布类型 | 均值 | 标准差 |
| 弹性模量/GPa | 主梁 | 正态 | 200 | 20.0 |
| 索塔 | 正态 | 36 | 3.6 | |
| 斜拉索 | 正态 | 205 | 20.5 | |
| 截面面积/m2 | 主梁 | 对数正态 | 1.76 | 0.18 |
| 索塔下部 | 对数正态 | 27.50 | 1.37 | |
| 索塔中部 | 对数正态 | 17.80 | 0.89 | |
| 索塔上部 | 对数正态 | 63.90 | 3.20 | |
| 109型斜拉索 | 对数正态 | 7.85×10⁻³ | 7.85×10⁻⁵ | |
| 139型斜拉索 | 对数正态 | 9.50×10⁻³ | 9.50×10⁻⁵ | |
| 151型斜拉索 | 对数正态 | 1.04×10⁻² | 1.04×10⁻⁴ | |
| 163型斜拉索 | 对数正态 | 1.13×10⁻² | 1.13×10⁻⁴ | |
| 187型斜拉索 | 对数正态 | 1.23×10⁻² | 1.23×10⁻⁴ | |
| 199型斜拉索 | 对数正态 | 1.54×10⁻² | 1.54×10⁻⁴ | |
| 惯性矩/m4 | 主梁 | 对数正态 | 3.83 | 0.19 |
| 索塔下部 | 对数正态 | 166.00 | 8.28 | |
| 索塔中部 | 对数正态 | 60.90 | 3.04 | |
| 索塔上部 | 对数正态 | 225.00 | 11.30 | |
| 材料容重/(kg·m-3) | 主梁 | 正态 | 7.70×10³ | 770.00 |
| 索塔 | 正态 | 2.60×10³ | 160.00 | |
| 拉索 | 正态 | 7.85×10³ | 785.00 | |
| 荷载集度/(kN·m-1) | 活载 | 正态 | 63.00 | 6.30 |

 DownLoad:

 DownLoad: