
2014 Vol. 14, No. 6
Display Method:
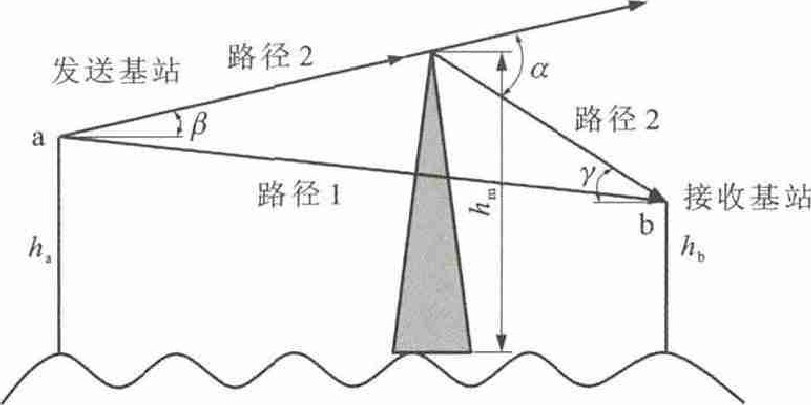
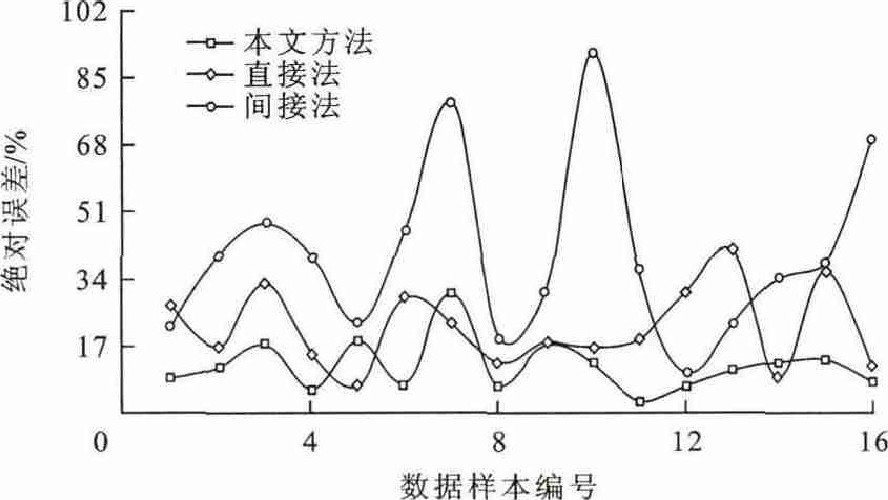
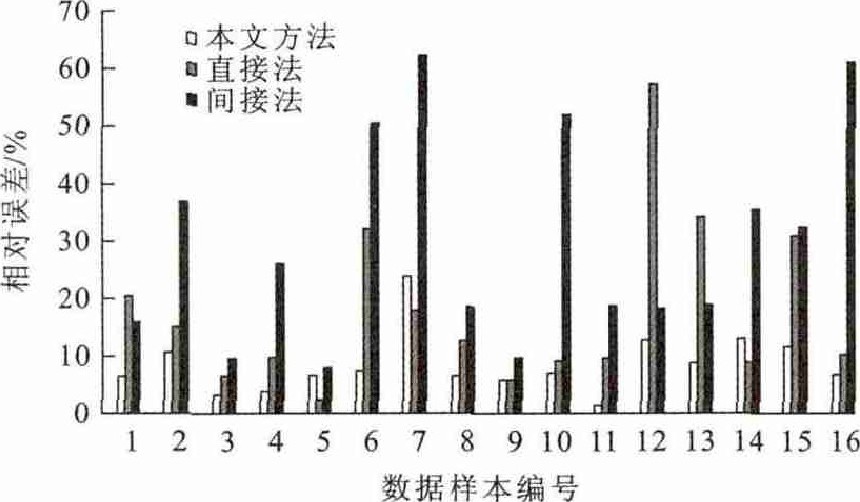
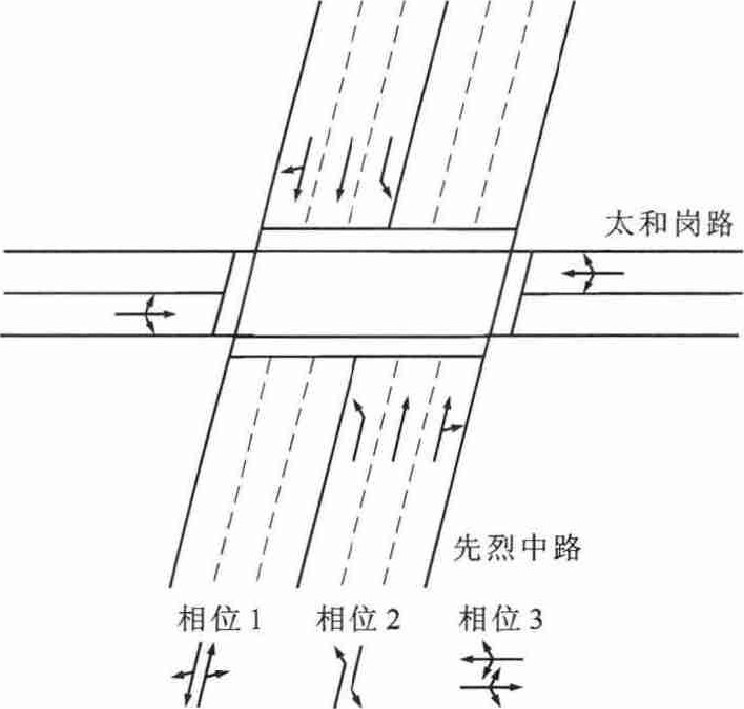
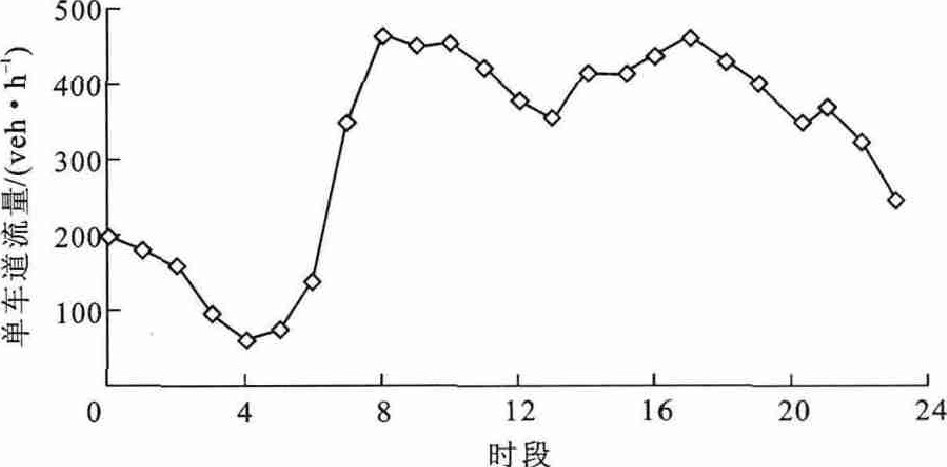
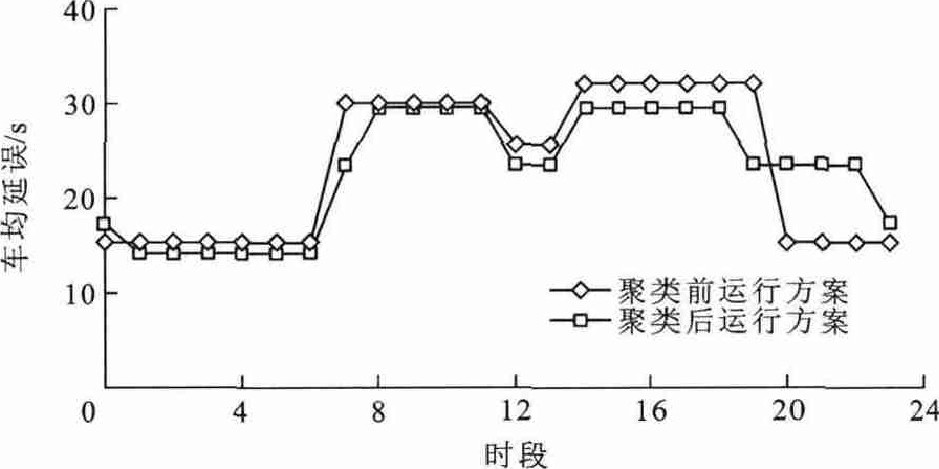
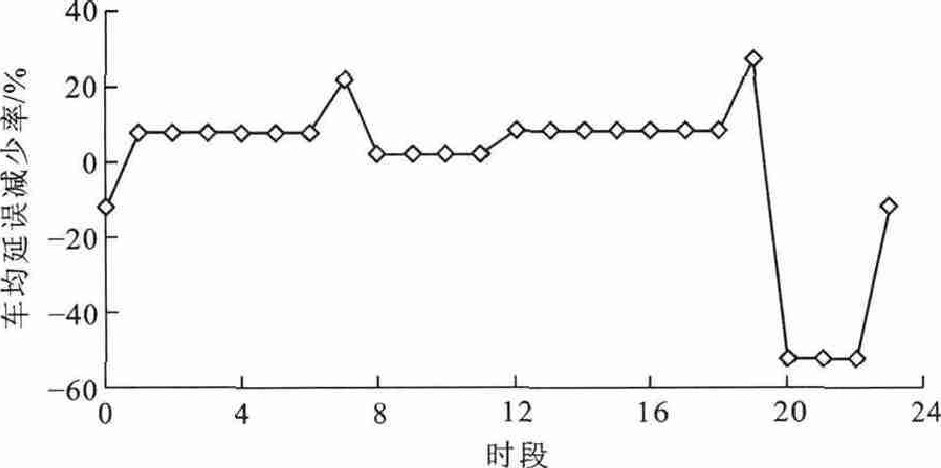
Abstract:
2014, 14(6): 1-9.


Abstract:
2014, 14(6): 10-16.


Abstract:
2014, 14(6): 17-26.

Abstract:
2014, 14(6): 27-34.


Abstract:
2014, 14(6): 35-43.


Abstract:
2014, 14(6): 44-50.


Abstract:
2014, 14(6): 51-58.


Abstract:
2014, 14(6): 59-66.


Abstract:
2014, 14(6): 67-73.


Abstract:
2014, 14(6): 74-82.


Abstract:
2014, 14(6): 83-91.


Abstract:
2014, 14(6): 92-99.


Abstract:
2014, 14(6): 100-109.


Abstract:
2014, 14(6): 110-116.

Abstract:
2014, 14(6): 117-126.