
2016 Vol. 16, No. 6
Display Method:
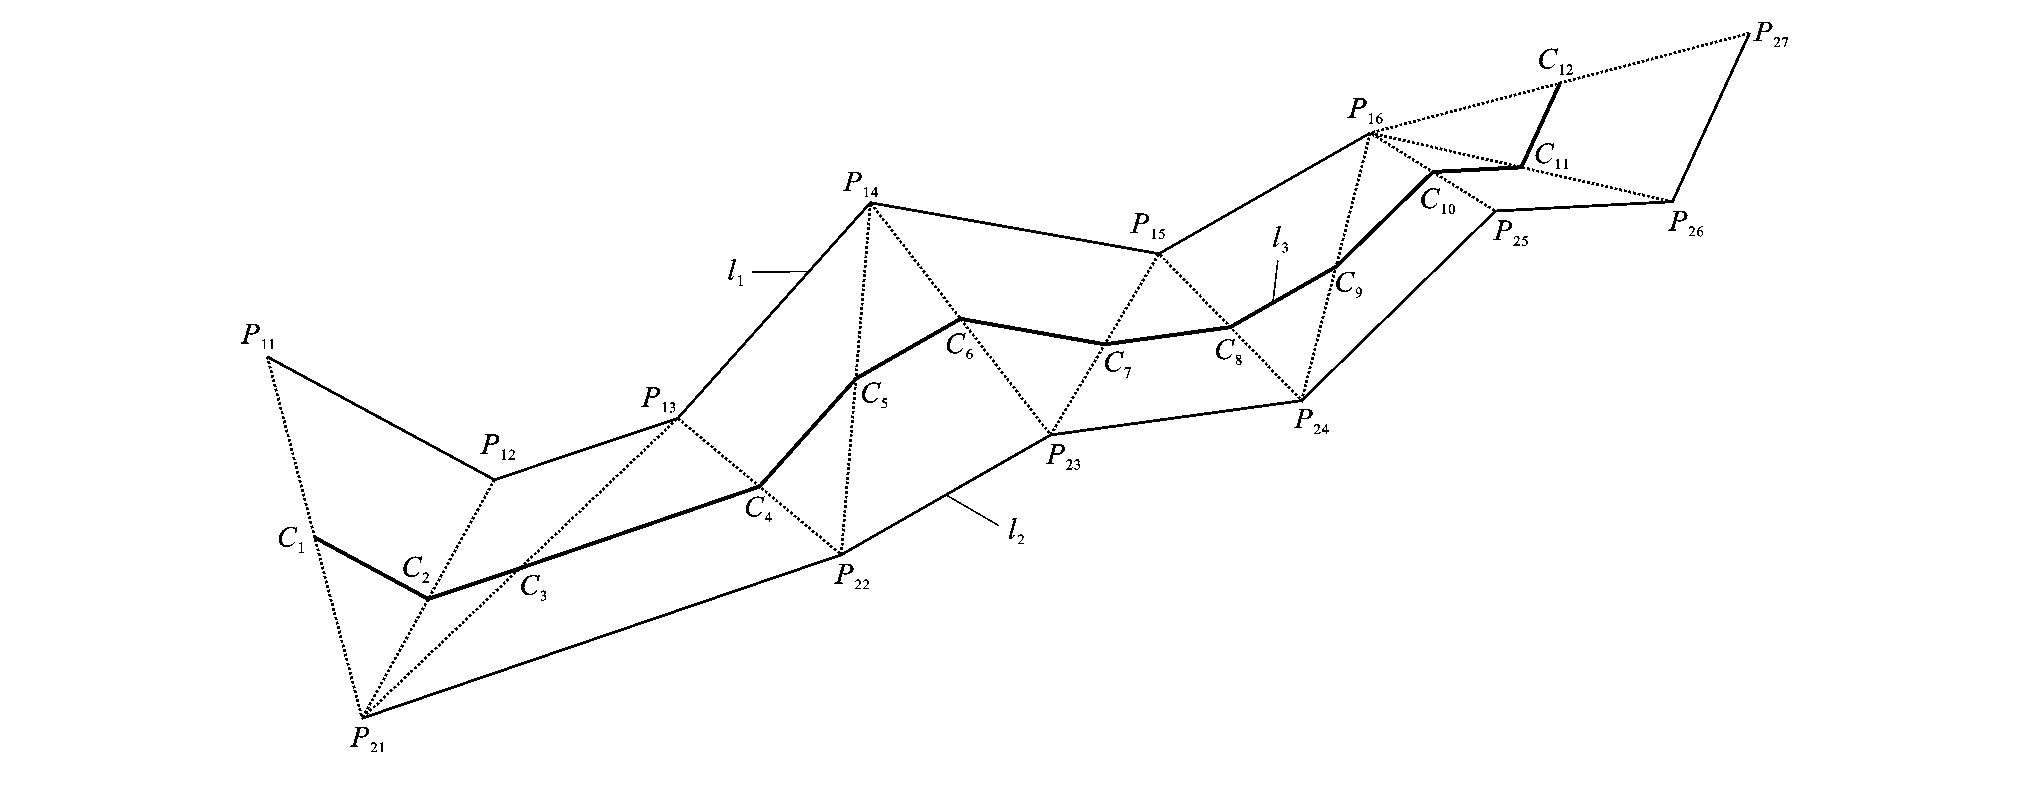
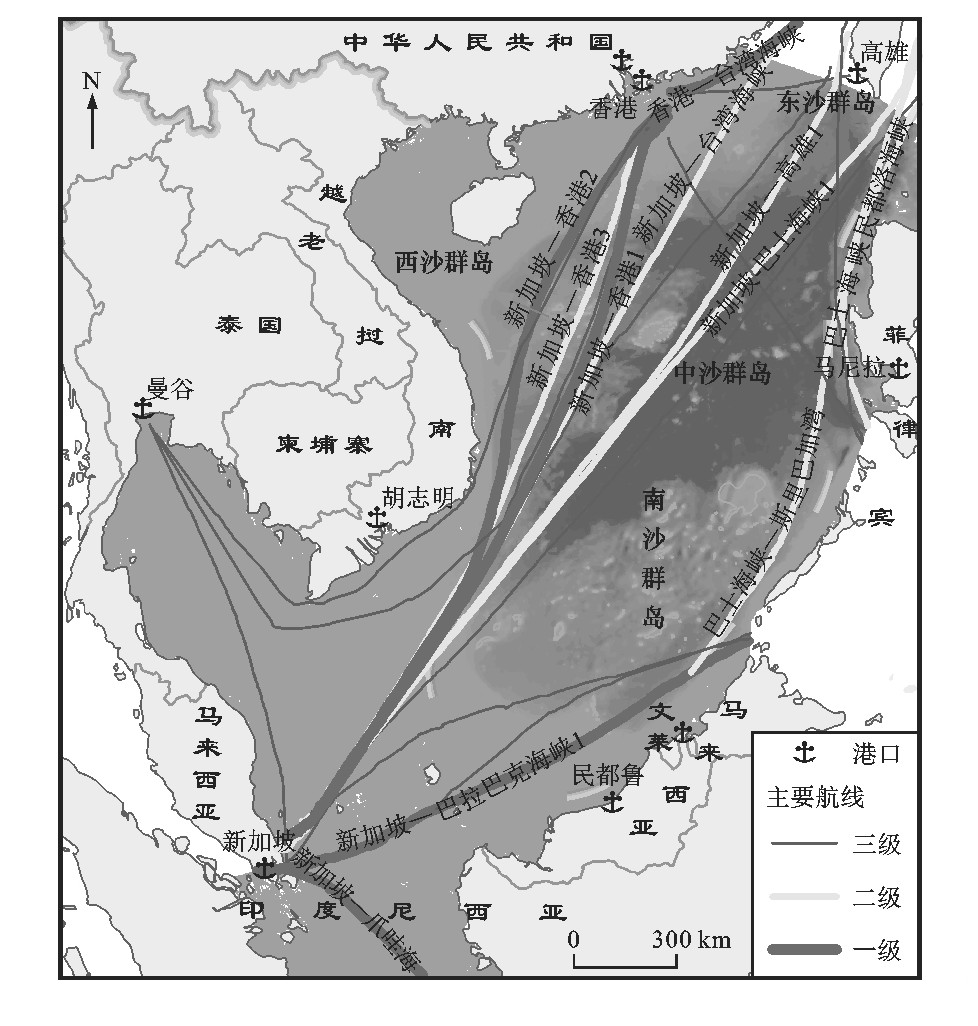
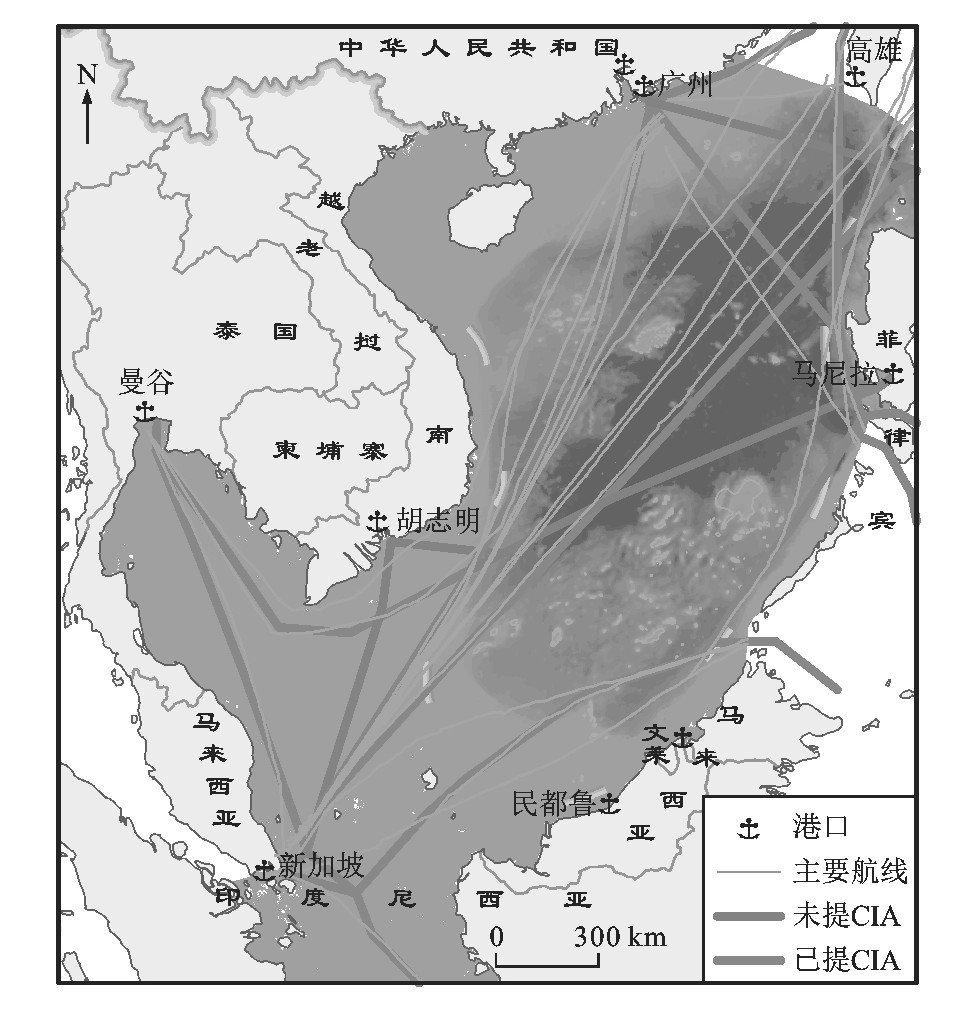
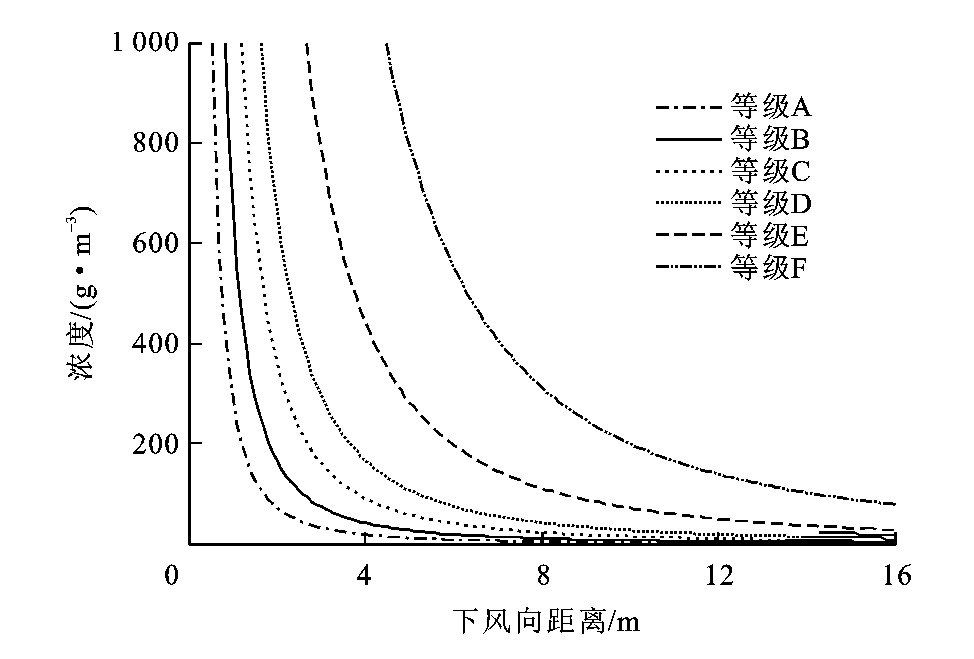
Abstract:
2016, 16(6): 1-11.


Abstract:
2016, 16(6): 12-20.


Abstract:
2016, 16(6): 21-29.


Abstract:
2016, 16(6): 30-38.


Abstract:
2016, 16(6): 39-47.


Abstract:
2016, 16(6): 48-54.


Abstract:
2016, 16(6): 55-62.


Abstract:
2016, 16(6): 63-71.


Abstract:
2016, 16(6): 72-81.


Abstract:
2016, 16(6): 82-90.


Abstract:
2016, 16(6): 91-98.


Abstract:
2016, 16(6): 99-106.


Abstract:
2016, 16(6): 107-113.


Abstract:
2016, 16(6): 114-124.


Abstract:
2016, 16(6): 125-131.

Abstract:
2016, 16(6): 132-139.


Abstract:
2016, 16(6): 140-148.


Abstract:
2016, 16(6): 149-158.