2017 Vol. 17, No. 4

Display Method:
Influence of epoxy asphalt concrete anti-fatigue layer on structure of perpetual asphalt concrete pavement with flexible base
JI Jie, LIU Lu-hou, SUO Zhi, ZHANG Yan-jun, JIN Ming-yang, NING Xiang-xiang, JIA Xiao-peng, YAO Hui
Abstract: A kind of new epoxy asphalt for road engineering was developed. Based on tensile test, viscosity test, and fluorescence microscope technology, the tensile strength, breaking elongation, changing rules of viscosity with time, and microscopic curing mechanism of epoxy asphalt were evaluated. The epoxy asphalt concrete AC-13 C was designed, and its road performances andfatigue characteristics were evaluated. When common asphalt concrete, SBS modified asphalt concrete and epoxy asphalt concrete were taken as anti-fatigue layers, the influences of antifatigue layers on the structural thickness and fatigue life of perpetual asphalt concrete pavement with flexible base were analyzed. Test result shows that the tensile strength of epoxy asphalt is 2.47 MPa and the breaking elongation is 2.65, which satisfies the technical requirement that the tensile strength is not less than 1.5 MPa and the breaking elongation is not less than 2. The time needs 54 min when the viscosity of epoxy asphalt reach to 1 Pa·s, after 54 min, the viscosity increases rapidly, so the total time for mixing, transportation, and paving should be controlled within 54 min in construction. The fatigue strain limit is 333μεwhen the fatigue life is 1 billion times according to the fatigue equation of epoxy asphalt concrete. Compared to common asphalt concrete and SBS modified asphalt concrete, when epoxy asphalt concrete is taken as anti-fatigue layer, the fatigue life of perpetual asphalt concrete pavement increases by 2.92×10⁵ times and 4.39×10³ times respectively, and the thickness decreases 18 cm and 10 cm. The microscopic curing mechanism of epoxy asphalt is that epoxy resin and hardener form cross-linked and three-dimensional network structure from point to line and from line to net in asphalt.More>
2017, 17(4): 1-8.
Analytical solution of temperature effects of steel-concrete composite girder
LIU Yong-jian, LIU Jiang, ZHANG Ning, FENG Bo-wen, XU Lei
Abstract: Under the two cases of considering interface slippage or not, the theoretical calculation formulas of steel-concrete composite girder's interface shear force, relative slippage and temperature stress were deduced under arbitrary temperature distribution. The formulas under considering interface slippage were verified by using the finite element simulation. Under the steel-concrete temperature difference pattern (pattern 1), the temperature difference pattern in General Specifications for Design of Highway Bridges and Culverts (JTG D60—2015) (pattern 2) and the temperature difference pattern in British Code BS5400 (pattern 3), the calculation results of temperature effects were compared. Analysis result shows that the interface shear forcedistribution of composite girder calculated by the shear force theoretical formula under considering interface slippage has the same rule with the finite element calculation result, and the maximum shear force deviations under the 3 patterns are 1.15%, 2.65% and 3.41%, respectively. The interface shear force of composite girder obeys hyperbolic cosine function distribution, and the interface slippage obeys hyperbolic sine function distribution. The calculated shear forces under considering interface slippage or not are almost equal, and the maximum deviation is only 1.22%. The maximum deviation of calculated mid-span temperature stress of composite girder is less than 1%. However, the deviation of calculated temperature stress at the end of composite girder is larger. When the temperature difference is 20 ℃ in pattern 3, the temperature tensile stress at concrete slab bottom under considering the slippage is 1.9 times as large as the one under no considering the slippage. The interface temperature effect of composite girder has linear relationship with temperature difference, and its slope is related to the pattern of temperature distribution. The variation rates of interface shear force, interface shear stress and interface slippage are largest in pattern 1, and are 9.138 kN·℃-1, 0.067 MPa·℃-1 and 5.263×10⁻³ mm·℃-1, respectively. When the temperature difference is 30 ℃, the variation rates of interface shear force, interface shear stress and interface slippage in pattern 1 are more than 3 times as large as the values in pattern 3. Therefore, no considering the temperature gradient of steel girder can cause the deviations of interface force, relative slippage and temperature stress, and the deviations grow with the increase of temperature difference.More>
2017, 17(4): 9-19.
Design of mid-span fabricated RCFST composite truss bridge
LIU Bin, LIU Yong-jian, ZHOU Xu-hong, LI Zhou, WANG Kang-ning
Abstract: The webs and bottom slabs of traditional concrete box girder were optimized, and a new structural type of fabricated bridge named RCFST (rectangular concrete filled steel tubular) composite truss bridge was proposed. The structure design optimization procedure was introduced from the aspects of general design, main truss selection, cross section selection, bridge deck slab selection, member bar selection, joint selection and connection structure. The RCFST composite truss bridge was analyzed by finite element method from the static mechanical property and seismic response of the bridge, and the effective width and mechanical property of bridge deck slab in the negative moment zone of the slab. The partial composite technique wasalso used in the design of bridge deck slab connector in the negative moment zone. From the technicality and economy, the RCFST composite truss bridge was compared with the prestressed concrete box girder bridge in terms of engineering quantity and construction convenience. Analysis result shows that the selection of RCFST composite truss bridge structure meets the industrialization requirement of bridge's prefabrication and accelerated construction, and the member bars of main truss with clear force-bearing states mainly carry axial tensions and pressures. The effective width coefficient of bridge deck slab in the negative moment zone is 0.899. The axial tension of bridge deck slab decreases by 75.3% using the partial composite technique, which effectively improves the anti-crack ability of bridge deck slab. The initial input earthquake load of RCFST composite truss bridge accounts for 58.9% of the load of prestressed concrete box girder bridge with the same span, which indicates RCFST composite truss bridge has good anti-seismic property. The ratios of steel quantity, concrete quantity, and superstructure self-weight of RCFST composite truss bridge to prestressed concrete box girder bridge are 1.241, 0.485 and 0.575, respectively, which indicates the RCFST composite truss bridge has good economic advantages, such as simple structure, high utilization of materials and low building cost.More>
2017, 17(4): 20-31.
Vertical temperature gradient patterns of上-shaped steel-concrete composite girder in arctic-alpine plateau region
LIU Jiang, LIU Yong-jian, FANG Jian-hong, LIU Guang-long, STIEMER SF
Abstract: Taking Haihuang Bridge in Qinghai Province as engineering background, a finite element analytical model of composite girder temperature field was established under consideringmeteorological parameters and verified by the field test data of bridge. The vertical temperature distributions of上-shaped composite girder in all seasons were analyzed, and the simplified patterns of vertical temperature gradient during warming and cooling were proposed. The influence rules of meteorological parameters such as solar radiation intensity, temperature and wind velocity on the temperature difference were studied. Based on the extreme statistic method, the worst vertical temperature gradient patterns of上-shaped composite girders with different asphalt concrete laying thicknesses under the meteorological parameter represent values in 50-year return period were calculated. Analysis result shows that during warming in day and cooling at night, the vertical temperature gradient patterns of composite girder are different. The maximum temperature difference during warming takes place at 14:00, and the temperature gradient pattern can be simplified as the linetype with 5-parabola at the top and broken line at the bottom. The temperature difference at the top is greatly influenced by the laying thickness of asphalt concrete. When the laying thicknesses are 0, 50, 100, 150 mm, respectively, the maximum temperature differences at the top are 23.8 ℃, 31.7 ℃, 24.1 ℃ and 17.4 ℃, respectively. The maximum temperature difference at the bottom is 5.1 ℃. The minimum temperature difference during cooling takes place at 2:00, and the temperature gradient pattern can be simplified as the linetype with double broken line at the top and isothermal section at the bottom. The temperature difference at the top is greatly influenced by the laying thickness of asphalt concrete. When the laying thicknesses are 0, 50, 100, 150 mm, respectively, the minimum temperature differences at the top are -12.2 ℃, -8.2 ℃, -5.0 ℃ and -2.9 ℃, respectively. The minimum temperature difference at the bottom is -16.4 ℃. Because the vertical temperature distribution of 上-shaped composite girder is influenced by the meteorological parameters, the temperature nearly keeps linear relationship with daily solar radiation amount and air temperature, and keeps nonlinear relationship with wind velocity. The proposed vertical temperature gradient pattern of 上-shaped composite girder during warming is close to the pattern in AASHTO, but the temperature difference at the top is 1.7 ℃ higher than the value in AASHTO. The temperature gradient pattern during cooling is close to the pattern in Eurocode, but the temperature difference at the bottom is 8.4℃lower than the value in Eurocode. Therefore, the proposed temperature gradient patterns are more critical.More>
2017, 17(4): 32-44.
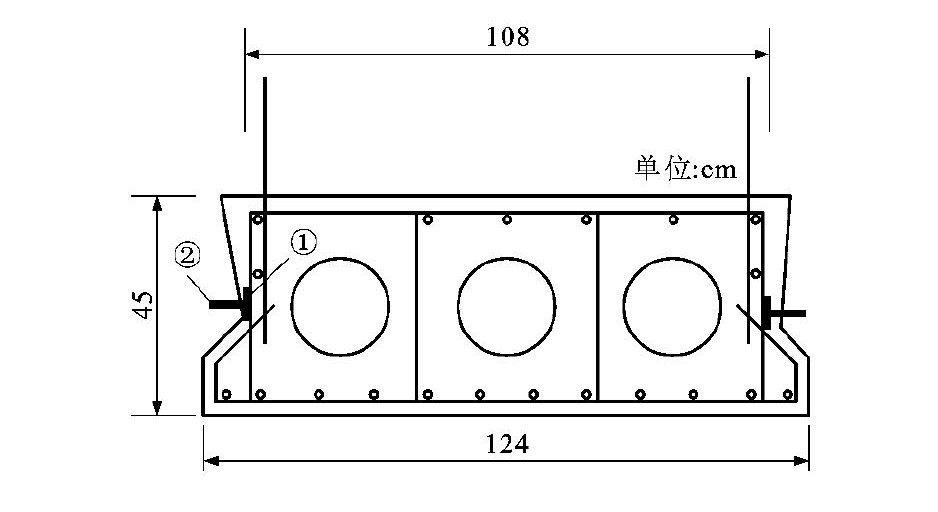
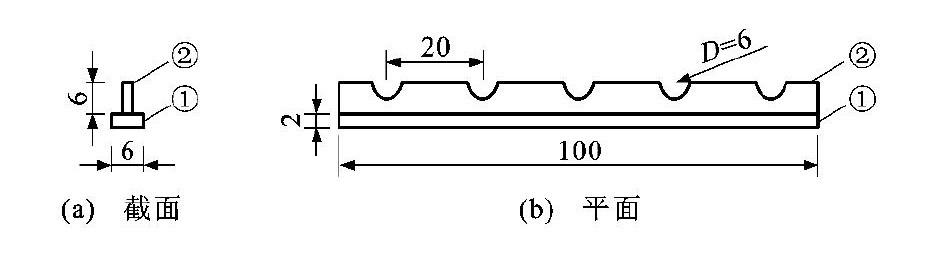
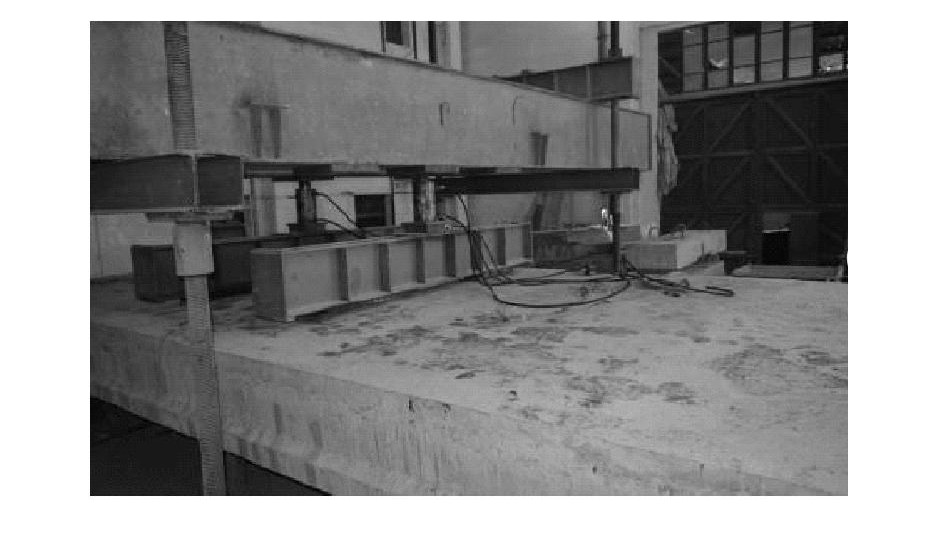
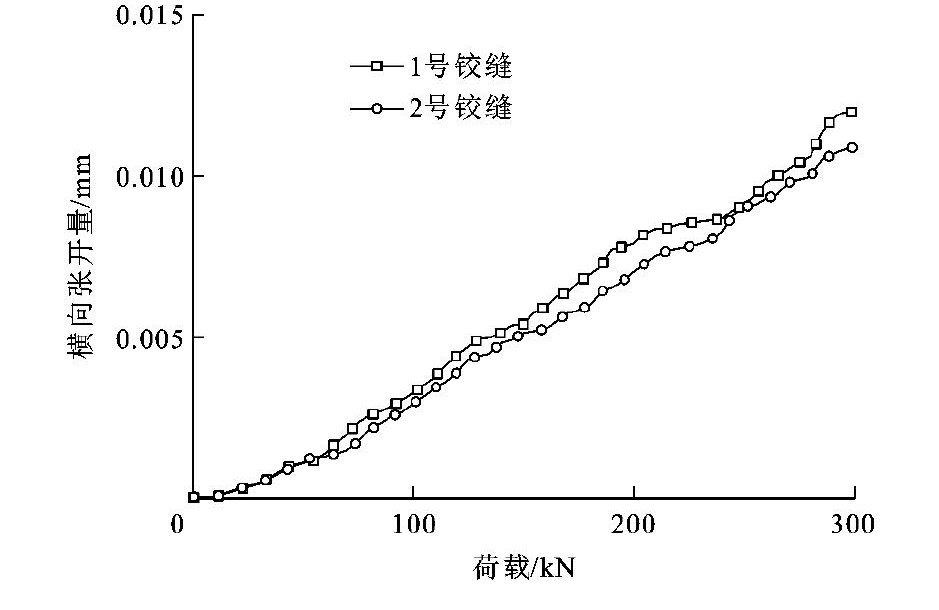
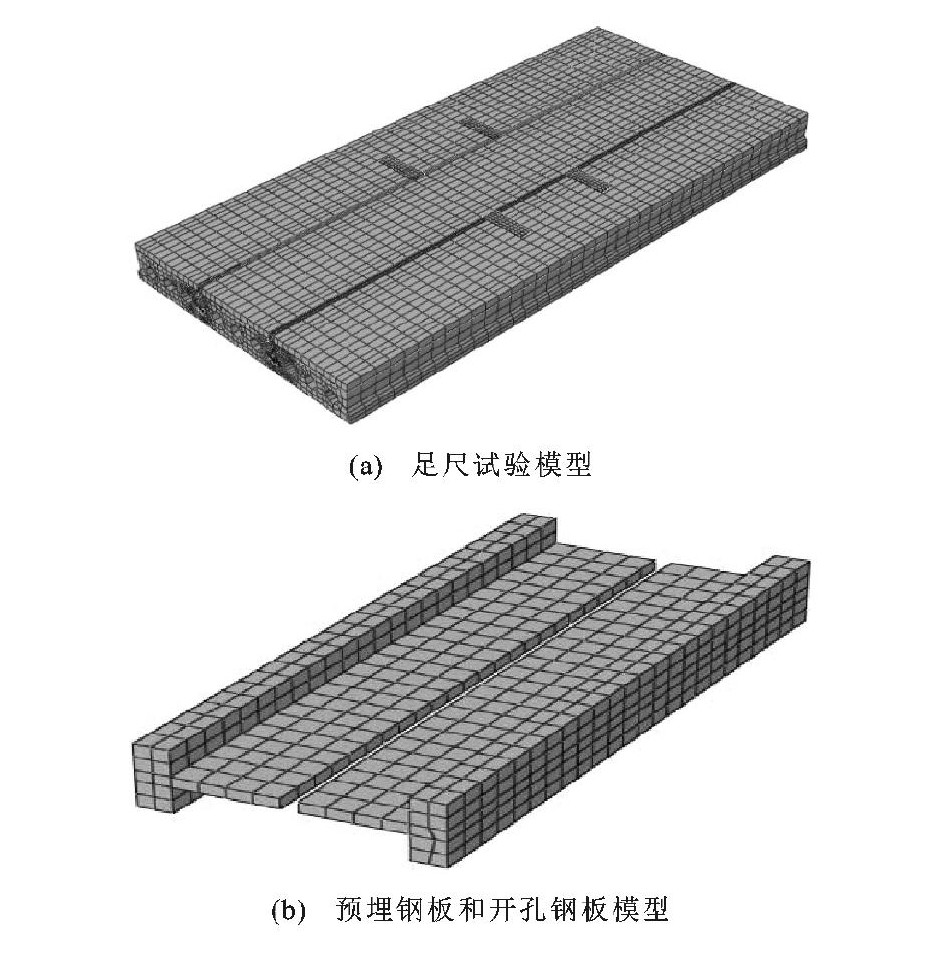
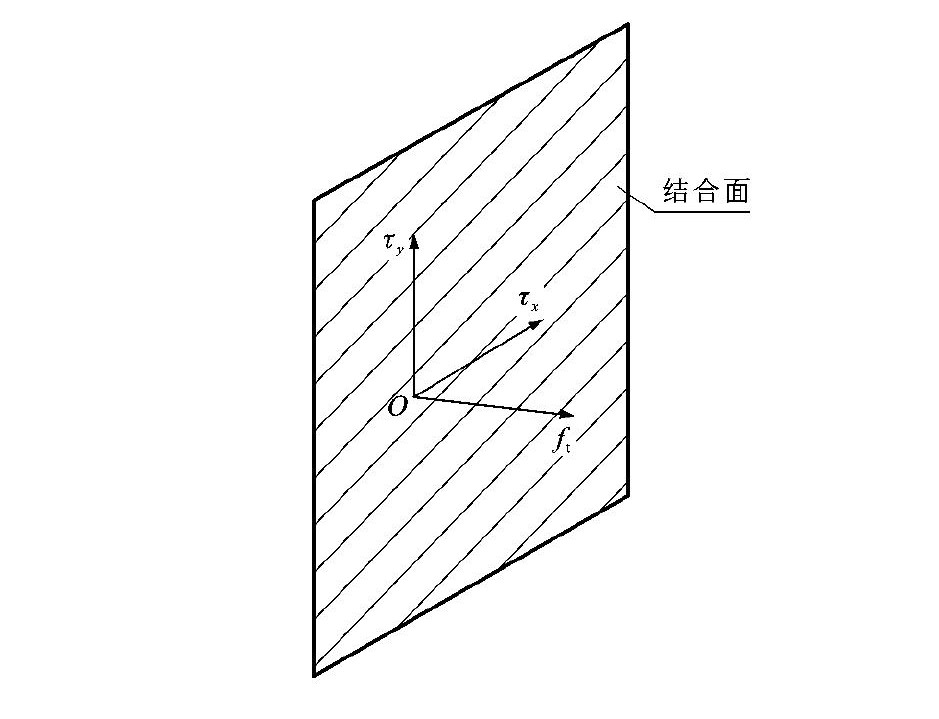
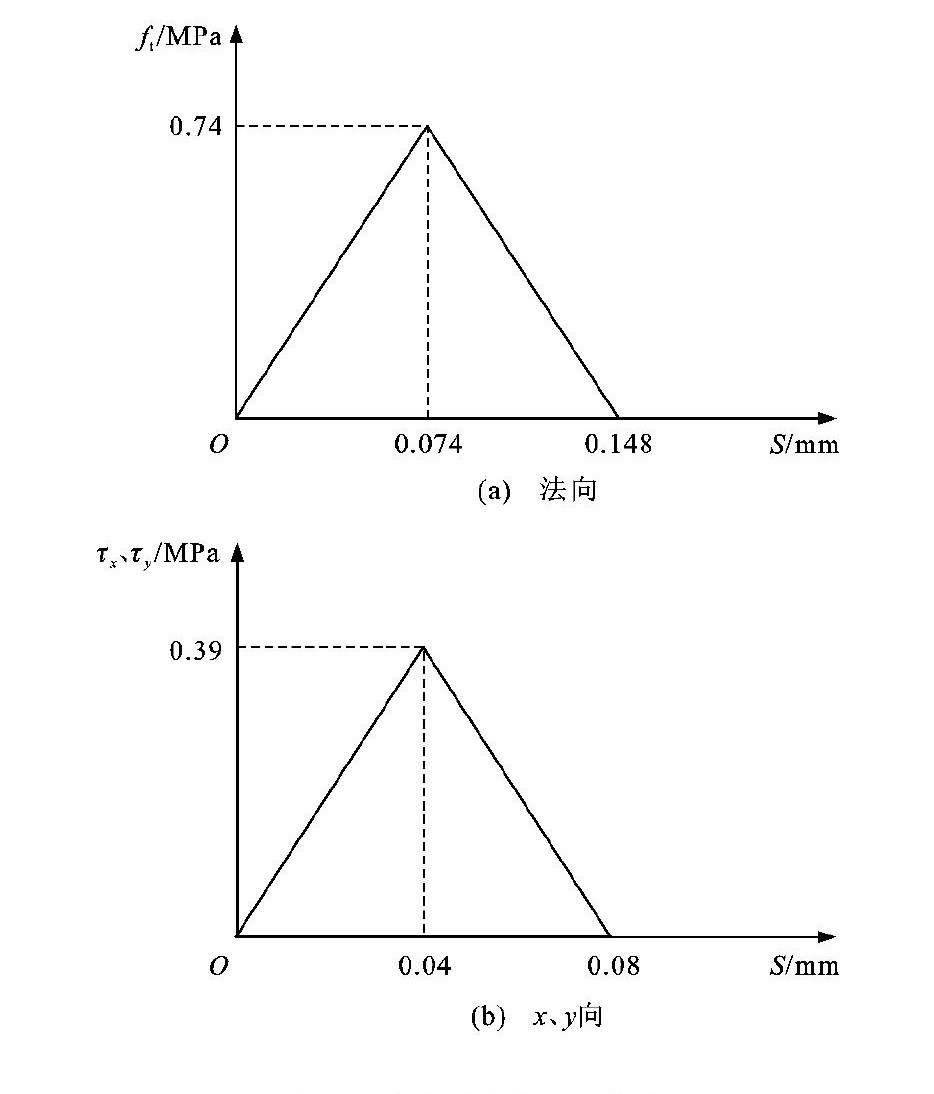
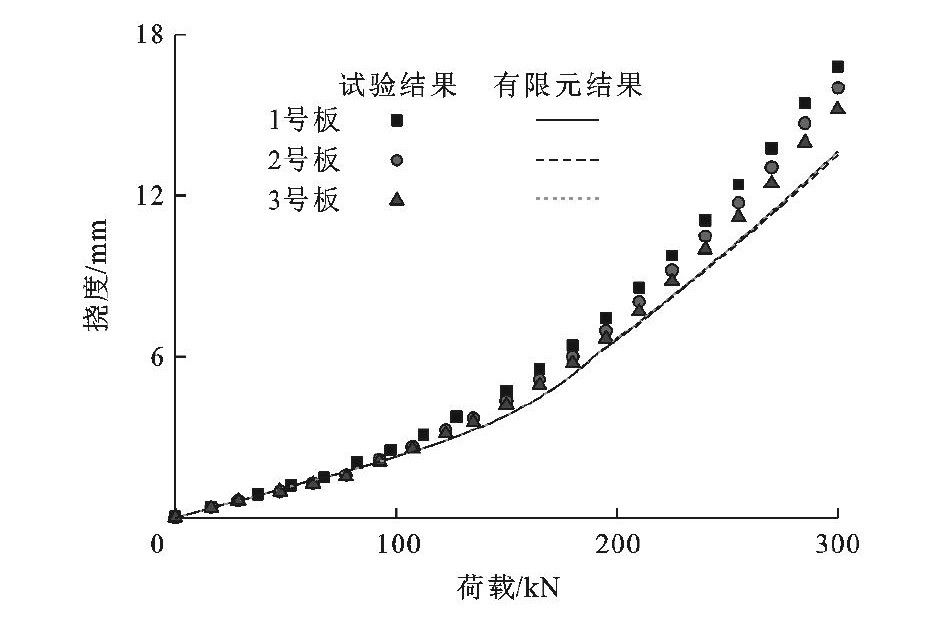
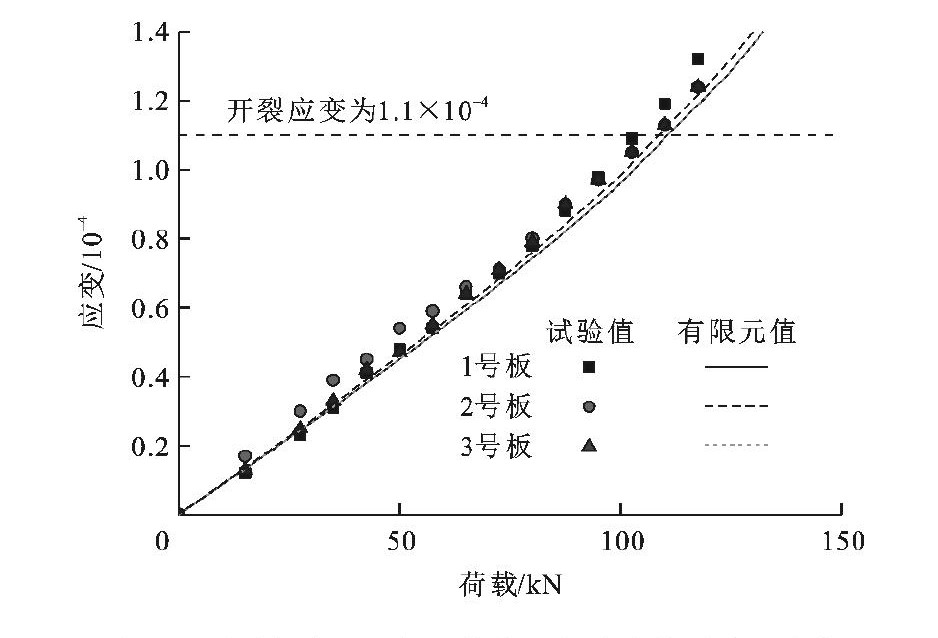
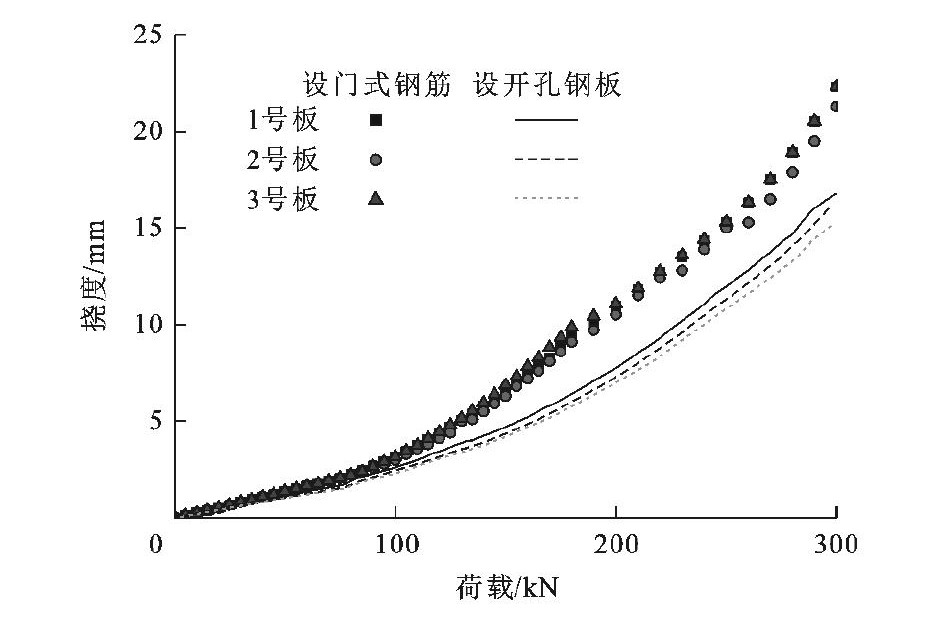
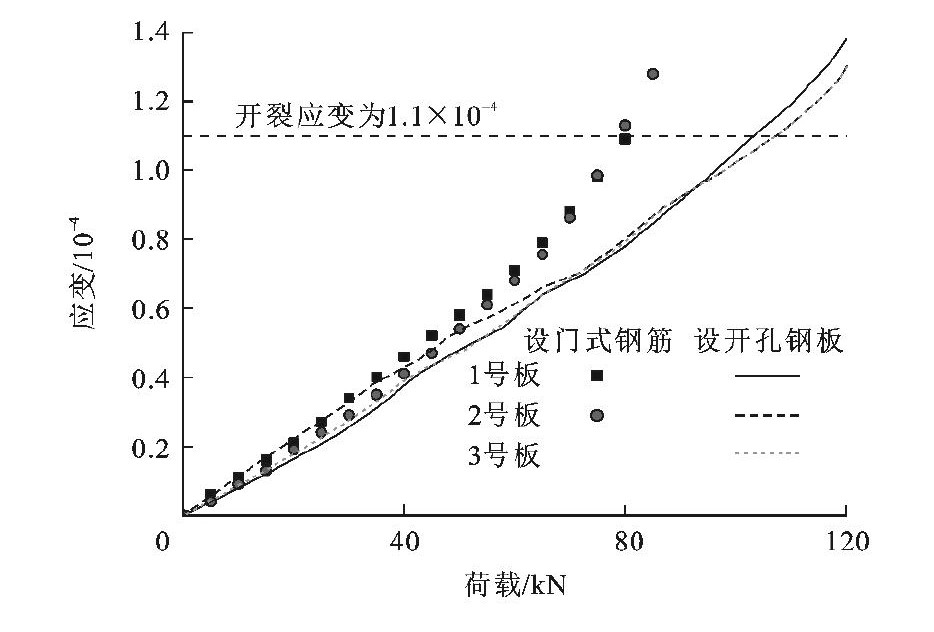
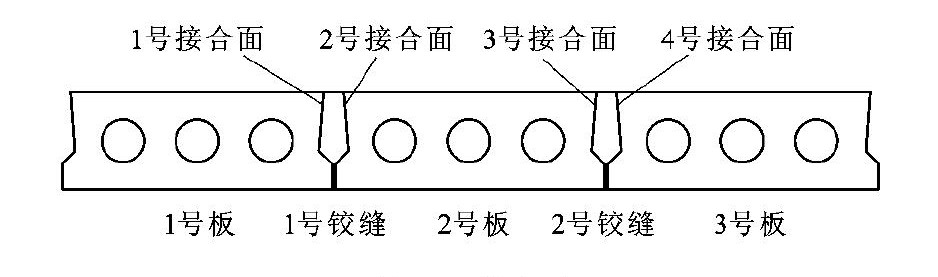
Mechanical property of hinged voided slab with perforated steel plates at bottom of junction surface
WU Qing-xiong, HUANG Wan-kun, CHEN Bao-chun, CHEN Kang-ming, ZHONG Cun-sheng-san
Abstract: In view of the weakest point of hinged voided slab bridge, namely hinged joint, a kind of voided slab with perforated steel plates at the bottom of hinged joint-to-voided slab interface was put forward, the perforated steel plates were used to change the crack propagating path at the interface, so as to delay the formation of through crack at the hinged joint-to-voided slab interface, and the full-scale model experiment on 8 m-span hinged voided slab was conducted. Based on the experiment and nonlinear finite element (FE) analysis, the result was compared with the experiment result of hinged voided slab with gate-type steel bars at the bottom of interface. Analysis result shows that when the experiment load is 100 kN (1.43 times vehicle load), the lateral crack emerges in the mid-span of voided slab, the integral rigidity of voided slabdecreases, and the stress state of voided slab comes into elastoplastic stage from elastic stage. The test load is applied up to 300 kN (4.29 times vehicle load), no crack is detected at the bottom of hinged joint-to-voided slab interface during the entire loading process. For hinged voided slab with gate-type steel bars at the bottom of hinged joint-to-voided slab interface, the crack extends from the bottom to the top along the interface, and then forms a through crack. However, for the hinged joint-to-voided slab interface with perforated steel plates, after the crack propagates along the interface to the bottom of perforated steel plate, the expansion of the crack needs to bypass the perforated steel plate, so that the joint concrete below the perforated steel plate cracks, and then the crack expands upward along the junction surface above the perforated steel plate until the formation of through crack. The joint cracking load increases from 69 kN (0.99 times vehicle load) for the interface with gate-type steel bars to 314 kN (4.49 times vehicle load), and increases by 3.50 times. The through-crack-formation load increases from 199 kN (2.84 times vehicle load) for the junction surface with gate-type steel bars to 489 kN (6.99 times vehicle load), and increases by 4.51 times. It can be seen that the extension path of crack changes after the perforated steel plate is set at the bottom of junction surface, which slows down the cracking of the junction surface between the voided slab and the hinged joint.More>
2017, 17(4): 45-54.
Design of U-RC composite pier of sea-crossing bridge
LIN Shang-shun, HUANG Qing-wei, CHEN Bao-chun, CHEN Yang-hong
Abstract: In order to solve the construction and anti-corrosion problems of pier of sea-crossing bridge, a new structure of composite pier of ultra-high performance concrete (UHPC) and reinforced concrete (RC) (short for U-RC composite pier) was designed, and UHPC cylinder was taken as permanent cylinder to cast core reinforced concrete. The Pingtan Strait Bridge was taken as project background, the structure design and calculation of U-RC composite pier were carried out, and the workload and cost of U-RC composite pier were compared with the ones of original design scheme. The ultimate bearing capacity tests of three core reinforced concrete columns, three UHPC cylinders and three U-RC composite piers were carried out, the longitudinal andtransverse strains of concrete for the specimens were measured, the failure modes and the developments of cracks were observed, the test values of ultimate bearing capacities were obtained, and the mechanical properties of U-RC composite pier were analyzed. Research result indicates that the bearing capacity of U-RC composite pier is greater than the design value of internal force, which meets the current specification requirement. The design scheme that adopts UHPC cylinder to replace steel template, can save about 2 410 tof steel, and the total cost saves nearly 30%. The average bearing capacities of three UHPC cylinders and three RC columns are1 342 kN and 1 370 kN, respectively, and their sum is less than the average bearing capacity of three U-RC composite piers (3 033 kN), which indicates that the UHPC cylinder has certain confinement effect for core concrete, and it is feasible and conservative to calculate the ultimate bearing capacity of U-RC pier under axial compression with simple superposition method. In the axial compression experiment, the failure mode of U-RC composite pier is that the lateral deformation of core concrete leads to the vertical fracture of UHPC cylinder and the separation of UHPC and core concrete at the interface. At the ultimate load, the coating UHPC layers have vertical cracks that grow with the increase of the load, and the flaking and spalling phenomena of concrete appear. But when the U-RC composite pier is damaged, the longitudinal strain of coating UHPC does not reach the ultimate compressive strain.More>
2017, 17(4): 55-65.
Temperature effects of H-shaped concrete pylon in arctic-alpine plateau region
ZHANG Ning, LIU Yong-jian, LIU Jiang, JI De-jun, FANG Jian-hong, STIEMER S F
Abstract: The boundary condition calculation method of concrete structure temperature field was analyzed. The H-shaped concrete pylon of Haihuang Bridge in Qinghai Province was taken as engineering background, and the temperature field distributions of pylon under typical meteorological conditions during all seasons in arctic-alpine plateau region were calculated. The temperature differences between pylon surfaces and parts of tower wall in all seasons were compared, and the most adverse temperature load of pylon was determined. The whole finite element model of pylon was established, the temperature effects of pylon such as the displacements, vertical stresses, horizontal stresses and longitudinal stresses in all seasons were analyzed. Analysis result shows that the temperature differences of surface and local of pylon reach maximum in winter, and the maximum values are 11.88 ℃ and 20.79 ℃, respectively. The temperature differences reach minimum in summer, and the maximum values are 5.15 ℃ and 15.25 ℃, respectively. The maximum transverse and longitudinal temperature differences of pylon surface are 9.15 ℃ and 11.88 ℃, respectively, and are much larger than ±5 ℃ recommended in Guidelines for Design of Highway Cable-stayed Bridge (JTG/T D65-01—2007). The local temperature difference of tower wall near the south direction is largest, and the temperature difference distribution along thickness direction is close to exponential form. The maximum temperature attenuation coefficient is 4.50 in winter and 5.01 in summer, so the local temperature distribution of pylon wallboard in winter is more nonuniform than in summer. The maximum thermal effect also appears in winter, the maximal displacement of pylon is more than 40 mm in a day, and the variation value of displacement is more than 15 mm during daytime, which is adverse to monitoring pylon displacement in construction. The maximum vertical tension stress of pylon root reaches 2.2 MPa, pylon root also has large horizontal tensile stresses, the maximum longitudinal and transverse tension stresses are 1.82 and 0.82 MPa, respectively, and both occur inside pylon. When the tensile stresses combined with other actions may cause pylon cracks, so a certain amount of reinforced net should be arranged inside pylon wall to control the cracks. In the design and construction control of pylon in arctic-alpine plateau region, the adverse temperature effects should be considered.More>
2017, 17(4): 66-77.
Contribution analysis of aerodynamic noise of high-speed train
ZHANG Ya-dong, ZHANG Ji-ye, LI Tian
Abstract: The calculation model of aerodynamic noise of CRH380 Bhigh-speed train with 3 vehicles was established, including some detailed geometries such as six bogies, two windshields, three air conditioning units and one DSA380 pantograph. The aerodynamic noise sources of high-speed train were identified by the broadband noise source model based on the Lighthill acoustic theory. The near-field unsteady flow around the high-speed train was analyzed by using the large-eddy simulation based on the high-order finite difference method. The aerodynamic noise of high-speed train was predicted by using the Ffowcs Williams-Hawkings acoustic analogy theory. Computation result shows that the maximum deviation of calculated result of far-field aerodynamic noise and wind tunnel test result is 1.45 dBA, so the calculation model is accurate. The order based on the aerodynamic noise contribution amounts from large to small is bogie system (six bogies), inter-coach spacing (two windshields), pantograph and air conditioning unit, and the numerical values are 83.58, 79.31, 74.08 and 59.71 dBA, respectively. The aerodynamic noisecontribution amount of train in the knuckle-downstream direction of pantograph is less than the value in the knuckle-upstream direction of pantograph, and the maximum sound pressure level (SPL) and the average SPL are 0.40 dBA and 0.31 dBA, respectively. The aerodynamic noise contribution of the first bogie of head car is biggest and is 79.73 dBA. From large to small in turn, the order based on the aerodynamic noise contribution amounts of pantograph is carbon skateboard, balance arm, panhead support, chassis, insulators, lower arm rod, knuckle, upper arm rod, pull rod and balance rod, and the numerical values are 97.95, 93.02, 86.63, 82.07, 79.46, 76.85, 72.43, 66.63, 62.02 and 54.22 dBA, respectively. At 350 km·h-1, the dominant frequency of aerodynamic noise of pantograph exists 305, 608 and 913 Hz that are resulted from the aerodynamic noise contribution because of panhead's vortex shedding.More>
2017, 17(4): 78-88.
Design and performance analysis of water-lubricated tilting pad thrust bearing
LIANG Xing-xin, YAN Xin-ping, LIU Zheng-lin, OUYANG Wu, JIN Yong, FU Yi-feng
Abstract: Aiming at the demand of shaft-less rim-driven thruster for high-load capacity, long-life and low-noise water lubricated thrust bearing, a step type rubber cushion-supported and waterlubricated tilting pad thrust bearing was designed. By applying the fluid-solid two-way direct coupling analysis method, the performance calculation model of bearing was established, and the influences of base rubber cushion thickness, step rubber cushion thickness, step rubber cushion thickness ratio, step width ratio and thrust pad surface material on the axial displacement of thrust disc, maximum water film pressure and water film thickness were studied. Analysis result shows that when the load is constant, both the axial displacement of thrust disc and the maximumstress of rubber pad are proportional to the rubber cushion's thickness and the step rubber cushion's width ratio. When the thickness ratio changes from 2/2 to 3/6, the maximum water film pressure increases from 1.10 MPa to 1.32 MPa, the mean film thickness increases from 9.4 μm to 14.0 μm, and the increase ratios are 20.00% and 48.94%, respectively. The mean film thickness increases with the increase of the maximum water film pressure. When the step rubber cushion's thickness ratio equals 2/4 and the step width ratio is 16/20-20/16, the overall performance of the bearing is ideal. The increase of elastic modulus of thrust pad surface material is beneficial to improve the lubrication performance of the bearing, and the optimum step rubber cushion's width ratio increases accordingly.More>
2017, 17(4): 89-97.
Spreading features of droplet on micro-textured surface
JIAO Yun-long, DONG Lei, LIU Xiao-jun, LIU Kun
Abstract: The dynamics simulation of droplet spreading process on the different micro-textured surfaces was studied on the basis of Flow-3 D, and the moving mechanism of triple contact line was proposed. The spreading scaling laws of contact line, the spreading velocity and the final spreading radius were used to evaluate the spreading features of droplet on the micro-textured surfaces. Test result shows that droplet on the micro-textured and smooth surfaces meets two corresponding spreading scaling laws respectively. The contact area between solid and liquid increases because of the micro-textures. Because the excess driving force is obtained in the spreading process of droplet, both the spreading velocity and the final spreading radius increase. The final spreading radius on the micro-textured surface with square pits increases from 1.05 mm to 1.30 mm, and the maximum radius on the surface with square bulges is 1.62 mm. Micro-bulge is more beneficial to promote droplet spreading compared with micro-pit. Because of the existence of micro-bulges, the contact area between solid and liquid increases rapidly, the excess driving force is obtained in spreading process of droplet, the micro-channels between micro-bulges form, so the triple contact line keeps continuous feature all the time. While on the textured surface with micro-pits, the triple contact line is pinned in the micro-pits despite of the increase of contact area between solid and liquid, and the droplet eventually stays at the equilibrium position with the decrease of spreading velocity. Moreover, droplet spreading process has anisotropy on the surface with rectangle texture. The flow velocity parallelled to the micro-texture direction is higher, and the final spreading radius is 1.13 mm, which shows a good spreading feature. While the flow velocity vertical to the micro-texture direction is smaller, the spreading radius is 0.94 mm because of the discontinuity of triple contact line, so the spreading feature is poorer.More>
2017, 17(4): 98-105.
Influence of ground effect on air drag of car model
HUANG Zhi-xiang, JIN Hua, HU Xing-jun, WANG Jing-yu, CHEN Li
Abstract: In order to obtain the influence of ground effect on air drag of car model, for a 1∶3 scaled MIRA car model, a wind tunnel test was carried out inΦ3.2 m wind tunnel in China Aerodynamics Research and Development Center. A moving belt was taken as a unified research platform, and the influence of ground's fixed and moving states, wheels' motionless and rotating states, and different clearances of car body to ground plane on air drag was studied. The working condition of no cross wind that yaw angle is 0°was simulated, the fixed test wind velocity was 25 m·s-1, and the changing Reynolds number's test wind velocity was 15-26 m·s-1. The aerodynamic force of car model was only measured, air drag was mainly focused, and the test result was expressed by the dimensionless air drag coefficient. Analysis result shows that when the ratio of boundary layer thickness of fixed ground and the clearance of car bottom to ground is equal to or less than 0.32, the clearance ratio of wheel bottom and body bottom to ground is equalto or less than 0.37, the air drag for fixed ground is less than the value for moving ground, and the difference is less than 1.1%, so the impact of ground state on air drag can be ignored. The air drag for motionless wheel state is less than the value for rotation wheel, and the difference is less than 2.1%. So in the engineering application, when wheel rotation condition can't be simulated, correcting (increasing) air drag should be considered, but the allowance should be no more than 2.1%. With the increase of the clearance from wheel bottom to ground, air drag gradually decreases on the whole, and when the dimensionless clearance is 0.069-0.370, the difference of air drag is less than 2.0%. Thus in the wind tunnel test of car model using the moving belt, the clearance of wheel bottom to belt surface should be as small as possible under ensuring the contactless state of wheel bottom and moving belt surface.More>
2017, 17(4): 106-112.
Calculation method of parallel-type acceleration lane length of urban expressway
LI Wen-quan, SHAO Zi-ke, WANG Shi-heng, SUN Chun-yang, ZHENG Le
Abstract: The differences of calculation methods of parallel-type acceleration lane length in Chinese and American current standards were compared. Kinematics model and acceptable gap model were combined, and a calculation model of parallel-type acceleration lane length of urban expressway was established on the basis of considering three kinds of influence factors, including mainline traffic level, initial velocity and variable gap. The model was solved by Monte Carlo method. The influence of three kinds of factors on the acceleration lane length was analyzed, and a determining method of acceleration lane length based on expected initial velocity and expected mainline traffic level was proposed. Analysis result shows that 3 factors have great influence on the acceleration lane length, and the minimum values of acceleration lane length in Specification for Design of Urban Expressway (CJJ 129—2009) are smaller than the simulation values at different design speeds. When the design speed is 100 km·h-1, the upper and lower limits ofacceleration lane length under the third class service level are 27-36 mand 9-27 mlarger than the specified values, respectively. When the design speed is 80 km·h-1, the upper and lower limits of acceleration lane length under the third class service level are 10-22 mand 4-24 mlarger than the specified values, respectively. When the design speed is 60 km·h-1, the upper and lower limits of acceleration lane length under the third class service level are 15-24 mand 13-30 mlarger than the specified values, respectively. With the decrease of initial velocity, the acceleration lane length increases. Under the same condition, the acceleration lane length on the fourth critical gap function is maximum, and the value on the first critical gap function is minimum, which indicates that the larger the critical gap is, the longer the acceleration lane length is. The quadratic function fitting degrees of acceleration lane length and initial velocity are 0.865 8-0.999 7 at different design speeds under the third class service level, which indicates that the whole fitting result is good. Obviously, the calculation method of parallel-type acceleration lane length of urban expressway is reasonable and reliable.More>
2017, 17(4): 113-121.
Multi-grid cellular automata boarding model considering carried baggages
REN Xin-hui, JIAO Yang, ZHAO Yi-fei
Abstract: In order to accurately describe passenger boarding process, the classic boarding model was analyzed. The luggage-occupied aisle space and movement speed of passenger were considered, two new aisle interferences were proposed, namely speed interference and entering seat interference, and a multi-grid cellular automata boarding model was built. A multi-baggage priority boarding strategy was proposed according to the numbers of passengers' baggages. Analysis result shows that when the seat occupancy is 100%, the boarding time and interference number with the new model are 1 455 sand 6 720 times, respectively, while the corresponding values with the classic model are 1 244 sand 5 412 times. Compared with the classic model, in the new model, because the complexity of passenger movement in the cabin is simulated, the cell size and the interaction between passengers increase, so the boarding time is longer, and the aisle interference is larger, which more accords with the actual boarding behavior of passenger. When the seat occupancy is 100%, the multi-baggage priority boarding strategy is compared with the random boarding strategy, the boarding time is 1 303 sand decreases by 150 s, namely 10.3%, and the aisle interference number is 5 686 times and reduces 808 times, so the newboarding strategy can effectively reduce the aisle interference and improve the boarding efficiency.More>
2017, 17(4): 122-129.
Impact of rail transit construction on residential location choice
TIAN Li-jun, YU Ning, CAI Wu-gan
Abstract: To forecast how the rail transit construction affects the residential location choice, a customer surplus model by considering residents' salary level, transportation accessibility, and housing price was established, and a residential location logit choice model was set up to determine the residential location distribution due to the variation of traffic flow distribution. By using the combined model of residents' residential location choice and transportation means choice, the road traffic flow variation was firstly determined, and then the residential location choices for residents with different salary levels were obtained, which was caused by the travel cost variation after rail transit operation. The secondary effect of housing price appreciation after rail transit construction on residents' residential location choices was analyzed. Based on a monocentric city, 10 rail transit stations were designed as research objectives, the variations of residential location choices were calculated along 10 rail transit stations for citizens with 8 kinds of salary classes after the rail transit construction and the housing price appreciation. Analysis result shows that the residents move away from the city center after rail transit construction, although the residents with lower salary are scarcely affected due to their low value of time. Withthe improvement of residential location accessibility along rail transit, the housing price near the rail transit rises, i.e., the housing price increases by 2 619 yuan per square meter in the farthest residential location, and 11.5 yuan per square meter in the nearest residential location. Simultaneously, the residents with higher salary move forward to the city center, while the residents with lower salary move away from the city center.More>
2017, 17(4): 130-139.
Design approach of channelized island based on traffic conflict models at signalized intersection
GUO Yan-yong, LIU Pan, WU Yao, ZHOU Ji-biao
Abstract: In order to optimize the channelized island design at signalized intersection, a design approach of channelized island based on traffic conflict models was proposed. Traffic conflict data, traffic flow data, traffic control data, and geometric design data were collected at twenty signalized intersections in Kunming. Adopting Bayesian method, Bayesian fix parameter traffic conflict model and Bayesian random parameter traffic conflict model were constructed. The fitting goodnesses and significant influencing factors of the models were analyzed. Based on the random parameter traffic conflict model, the formula of calculating the expected number of traffic conflicts was determined. The design standard curves of channelized islands at signalized intersections were drawn, and the type selection procedure of channelized islands was proposed. Analysis result shows that the random parameter traffic conflict model yields better fitting result than the fixed parameter model. The variable coefficients of traffic volumes (crossing through traffic volume and right-turn traffic volume), channelized island types, and right-turn design elements (right-turn yielding sign and right-turn radius) obey normal distributions. When the crossing through traffic volume increases by 1%, the traffic conflict frequency increases by 0.56%. When the right-turn traffic volume increases by 1%, the traffic conflict frequency increases by 0.53%. The four types of channelized islands can reduce the traffic conflict frequency by 12.75%, 23.37%, 16.18% and 33.64%, respectively. The right-turn yielding sign can reduce the traffic conflict by 15.03%. When the right-turn radius increases by 1%, the right-turn traffic conflict frequency reduces by 1.72%. The research conclusion indicates that the design approach of channelized islands based on the traffic conflict models is feasible.More>
2017, 17(4): 140-148.
Intelligent control system of variable approach lane based on adaptive neuro-fuzzy inference system
LIU Yu-gang, WANG Zhuo-jun, LIU Yan-fang, YUAN Chuan-jie
Abstract: In order to alleviate the traffic congestion caused by the uneven distribution of traffic flow, the variable approach lanes (VAL) of intersection entrance were taken as research object, and an intelligent control system based on adaptive neuro-fuzzy inference system (ANFIS) was established. The intelligent control system consisted of data acquisition subsystem, traffic status prediction subsystem and control subsystem, and the intelligent control of VAL was completed by the three subsystems. When the real-time traffic data detected by the data acquisition subsystem were transfered into the pre-trained traffic status prediction subsystem, the traffic statuses of left-turning and going-straight vehicles were obtained, and the attribute of VAL was determined according to the structured algorithm. Computation result shows that the test error of traffic status prediction subsystem is 0.075 097, which meets the accuracy requirement to predict the traffic status. The intelligent control system of VAL can significantly improve the trafficcongestion at the intersection. While the ratio of left-turning vehicles is 25%, the total delay of key entrance lane reduces by 6.1%, the average stopping number reduces by 9.5%, and the average queue length reduces by 6.1%. When the ratio of left-turning vehicles rises to 30%, the three indicators decrease by 8.1%, 12.4% and 8.0%, respectively. Obviously, the higher the proportion of left-turning vehicles is, the more significant the effect is.More>
2017, 17(4): 149-158.