| Citation: | HUANG Wei, HU Yang. Cell transmission model considering queuing characteristics of channelized zone at intersections[J]. Journal of Traffic and Transportation Engineering, 2023, 23(2): 212-224. doi: 10.19818/j.cnki.1671-1637.2023.02.015

|
It can be seen that existing research focuses on analyzing the influence of factors such as tire texture, road surface structure, vehicle load, and water film thickness on the speed of vehicle hydroplaning, and lacks research on the influence of highway geometry on hydroplaning speed, especially in special sections such as ultra-high transition sections where road water accumulation is significantly affected by geometry; In addition, due to the lack of comprehensive consideration of multivariate combinations such as rainfall and road geometry, the existing research on the critical speed of vehicle hydroplaning cannot scientifically guide the speed management of vehicles in flooded sections of highways under rainy weather.
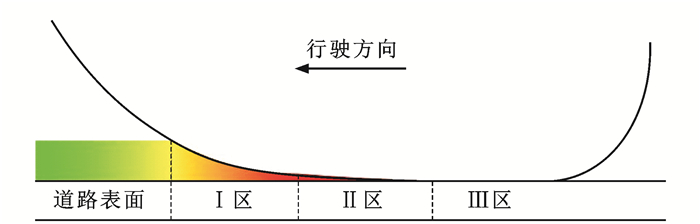
The principle behind the phenomenon of car tire skidding is as follows:Figure 1As shown, when the vehicle quickly enters the water accumulation area, the relative relationship between the water accumulation and the tires can be divided into three areas: in Zone I, there is a large dynamic water pressure between the water accumulation on the road surface and the tires, and the tires will be subjected to upward lifting force, resulting in the separation of the tire surface from the road surface; In Zone II, there is a thin water film separating the tread from the road surface, and only a portion of the tire is lifted; In Zone III, the tire tread is in full contact with the road surface without any water film. As the vehicle speed gradually increases, the length of zones I and II will continue to increase, and the range of zone III will gradually decrease to disappear. Eventually, the tire will completely separate from the road surface, resulting in tire skidding.
|
F=0.285h0.313v2.01 |
(1) |
|
N=F=0.285h0.313v2.01 |
(2) |
In the formula:NLoad on vehicle tires.
This article takes small passenger cars as the research model, considering the most common tire types and axle loads in small passenger cars as input variables for calculation. The typical tire type is determined to be 225/50R16 92V, and the axle load is 6.17 kN[26]Obtain the vehicle's water skiing speedvCompared to the thickness of the water filmhThe relationship between them is
|
v=128.65h−0.156 |
(3) |
|
h=0.068L0.32q0.41d1.17I−0.31 |
(4) |
|
T=[2bgsin(s)]0.5 |
(5) |
In the formula:TFor drainage time;bThe width of the road surface;gAcceleration due to gravity;sThe cross slope gradient of the road.
|
{t=TMxm=12gt2sin(sm)ym=12gt2sin(im) |
(6) |
In the formula:smFor the thmThe cross slope gradient of the road within the section;imFor the thmThe longitudinal slope gradient of the road within the section.
|
p=b(S2−S1)D |
(7) |
By combining equations (5) to (7), the length of the water flow path can be obtainedLdo
|
L=M∑m=1{(s0−pM−1∑m=1ymb)t2+12gt2sin(s0−pM−1∑m=1ymb)+[mgt2sin(im)+12t2sin(im)]2} |
(8) |
|
L=b0.31i0,61mp−0.89 |
(9) |
| 影响因素 | 标准误差 | 拟合优度 |
| b | 0.047 | 0.96 |
| im | 0.025 | |
| p | 0.024 |
 DownLoad:
CSV
DownLoad:
CSV
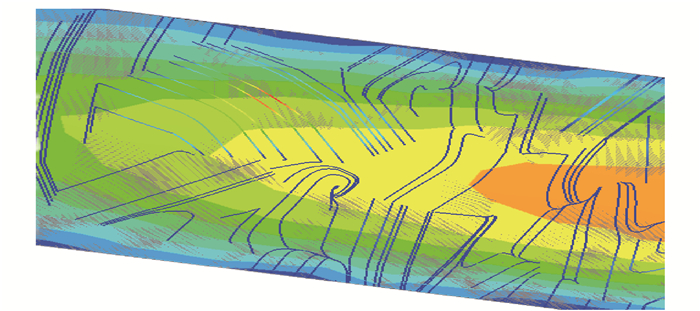
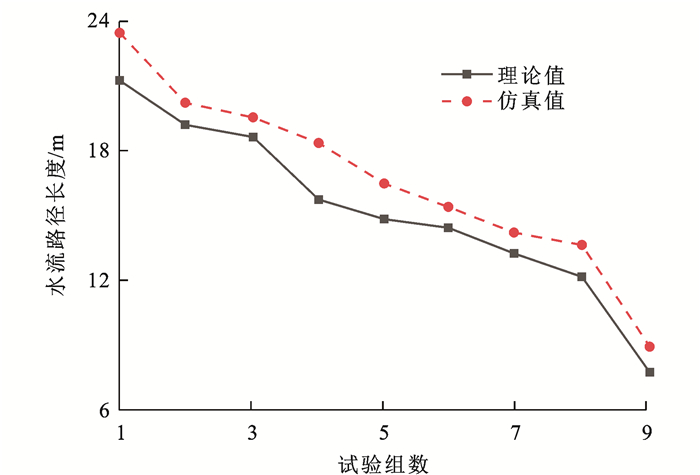
To verify the accuracy of equation (9), fluid simulation experiments were conducted for comparative verification. Based on the Fluent platform, establish a three-dimensional road model that is the same as the subsequent calculation of critical water skiing speed, and conduct 9 sets of simulation experiments on the length of water flow paths. One set of simulation results is as follows:Figure 3As shown.
|
v=176.594q−0.064p0.044i−0.03m(i2m+0.0004)0.024 |
(10) |
From the force state of the tires during the water skiing process, it can be seen that the higher the vehicle's driving speed, the greater the water flow lifting force generated, and the more prominent the water skiing phenomenon. Therefore, the current maximum design speed of 120 km · h for Chinese highways is selected-1To design speed control conditions. According to the relevant provisions of the "Highway Route Design Specification" (JTG D20-2017), the range of longitudinal slope gradient under this design speed is 0.3%~3.0%, and the range of superelevation gradient is 1/330~1/200. Wu Jianjun and others[31]Research has found that short-term heavy rainfall has a greater impact on traffic safety. A rainfall of 50 mm or more within 3 hours is referred to as heavy rainfall, with rainfall intensity ranging from 20 to 80 mm · h-1The range of factors affecting the speed of water skiing in the ultra-high transition section of this article is as follows:Table 2As shown.
| 影响因素 | 纵坡坡度/% | 超高渐变率 | 降雨强度/(mm·h-1) |
| 取值范围 | 0.3~3.0 | 1/330~1/200 | 20~80 |
DownLoad:
CSV
Orthogonal experiments were conducted with longitudinal slope gradient, superelevation gradient rate, and rainfall intensity as variables to calculate the water skiing speed of small passenger cars in the superelevation transition section under multivariate combinations. The calculation results of water skiing speed when taking the extreme values of three influencing factors are as follows:Table 3As shown in the figure, it can be seen that for a two-way four lane expressway, the maximum water sliding speed of vehicles occurs at a longitudinal slope gradient of 0.3%, a superelevation gradient rate of 1/200, and a rainfall intensity of 20 mm · h-1Under the combination, it is 115.5 km · h-1The minimum value occurs when the longitudinal slope gradient is 3.0%, the superelevation gradient rate is 1/330, and the rainfall intensity is 80 mm · h-1Under the combination, it is 99.3 km · h-1.
| 降雨强度/(mm·h-1) | 纵坡坡度/% | 超高渐变率 | 滑水速度/(km·h-1) |
| 20 | 0.3 | 1/330 | 110.0 |
| 0.3 | 1/200 | 115.5 | |
| 3.0 | 1/330 | 108.5 | |
| 3.0 | 1/200 | 112.9 | |
| 80 | 0.3 | 1/330 | 101.6 |
| 0.3 | 1/200 | 104.3 | |
| 3.0 | 1/330 | 99.3 | |
| 3.0 | 1/200 | 102.0 |
DownLoad:
CSV
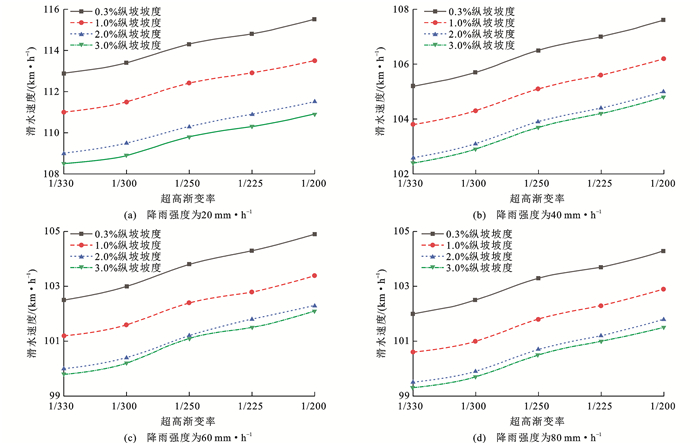
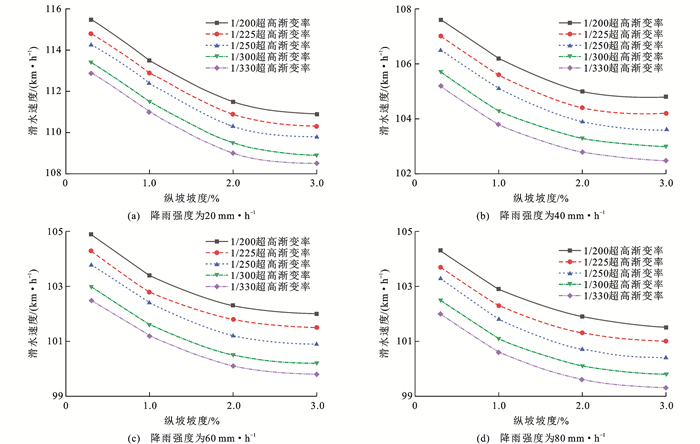
Select rainfall intensities of 20, 40, 60, and 80 mm · h respectively-1Calculate the water skiing speed of small passenger cars under different longitudinal slope gradients, and the results are as follows:Figure 6As shown, it can be seen that under the same rainfall intensity, the water skiing speed of small passenger cars decreases with the increase of longitudinal slope gradient; At different rainfall intensities, the minimum water skiing speed occurs when the longitudinal slope gradient is 3.0%, which prolongs the length of the water flow path, increases the thickness of the collected water film, and reduces the water skiing speed; Under different combinations of rainfall intensity and ultra-high gradient rate, when the longitudinal slope gradient increases from 0.3% to 3.0%, the water skiing speed of small passenger cars decreases by about 2.68%.
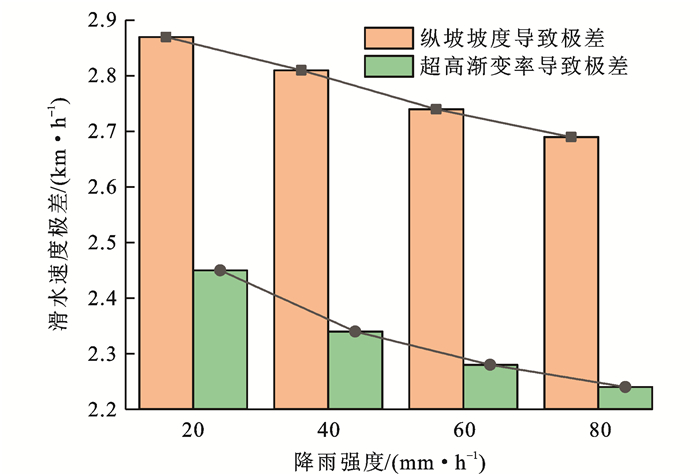
To compare the impact of longitudinal slope gradient and super-high gradient on the water skiing speed of small passenger cars, calculate the difference between the maximum and minimum water skiing speeds of small passenger cars under different longitudinal slope gradient conditions, and obtain the range of water skiing speed caused by longitudinal slope gradient. Similarly, obtain the range of water skiing speed caused by super-high gradient gradientFigure 7As shown. causeFigure 7It can be seen that under different rainfall intensities, the range of water skiing speed caused by longitudinal slope gradient and superelevation gradient is relatively close, but the influence of longitudinal slope gradient is always greater than that of superelevation gradient; As the intensity of rainfall increases, the impact of both on water skiing speed decreases and tends to flatten out.
| 降雨强度/(mm·h-1) | 纵坡坡度/% | 超高渐变率 | ||||
| 1/330 | 1/300 | 1/250 | 1/225 | 1/200 | ||
| 20 | 0.3 | 110 | 110 | 110 | 115 | 115 |
| 1.0 | 110 | 110 | 110 | 110 | 110 | |
| 2.0 | 105 | 105 | 110 | 110 | 110 | |
| 3.0 | 105 | 105 | 105 | 110 | 110 | |
| 40 | 0.3 | 105 | 105 | 105 | 105 | 105 |
| 1.0 | 100 | 100 | 105 | 105 | 105 | |
| 2.0 | 100 | 100 | 100 | 100 | 105 | |
| 3.0 | 100 | 100 | 100 | 100 | 100 | |
| 60 | 0.3 | 100 | 100 | 100 | 100 | 100 |
| 1.0 | 100 | 100 | 100 | 100 | 100 | |
| 2.0 | 100 | 100 | 100 | 100 | 100 | |
| 3.0 | 95 | 100 | 100 | 100 | 100 | |
| 80 | 0.3 | 100 | 100 | 100 | 100 | 100 |
| 1.0 | 100 | 100 | 100 | 100 | 100 | |
| 2.0 | 95 | 100 | 100 | 100 | 100 | |
| 3.0 | 95 | 95 | 100 | 100 | 100 | |
DownLoad:
CSV
(2) Analyzed the influence of longitudinal slope gradient and superelevation gradient on the water skiing speed of small passenger cars in the superelevation transition section. When the rainfall intensity is constant, the water skiing speed increases with the increase of the super-high gradient rate. The increase in longitudinal slope gradient leads to an increase in the length of the water flow path, which in turn reduces the speed of water skiing. The influence of longitudinal slope gradient on water skiing speed is greater than that of superelevation gradient rate, but as the rainfall intensity increases, the influence of longitudinal slope gradient and superelevation gradient rate on water skiing speed tends to be gentle.
(4) The study considered the influence of longitudinal slope gradient and geometric shape factors of superelevation gradient on water skiing speed. Further research is needed to consider the water skiing speed in the superelevation transition section of drainage facilities and heavy-duty vehicles.
| [1] |
GUO Qiang-qiang, LI Li, BAN X J. Urban traffic signal control with connected and automated vehicles: a survey[J]. Transportation Research Part C: Emerging Technologies, 2019, 101: 313-334. doi: 10.1016/j.trc.2019.01.026
|
| [2] |
LI Su-lan, ZHANG Xie-dong, SHI Jun-qing, et al. Traffic flow modeling and capacity analysis of signalized intersection[J]. Journal of Highway and Transportation Research and Development, 2017, 34(12): 108-114. (in Chinese) https://www.cnki.com.cn/Article/CJFDTOTAL-GLJK201712017.htm
|
| [3] |
LIGHTHILL M J, WHITHAM G B. On kinematic waves. Ⅱ. A theory of traffic flow on long crowded roads[J]. Proceedings of the Royal Society of London Series A, Mathematical and Physical Sciences, 1955, 229(1178): 317-345.
|
| [4] |
RICHARDS P I. Shock waves on the highway[J]. Operations Research, 1956, 4(1): 42-51. doi: 10.1287/opre.4.1.42
|
| [5] |
DAGANZO C F. The cell transmission model: a dynamic representation of highway traffic consistent with the hydrodynamic theory[J]. Transportation Research Part B: Methodological, 1994, 28(4): 269-287. doi: 10.1016/0191-2615(94)90002-7
|
| [6] |
DAGANZO C F. The cell transmission model, Part Ⅱ: network traffic[J]. Transportation Research Part B: Methodological, 1995, 29(2): 79-93. doi: 10.1016/0191-2615(94)00022-R
|
| [7] |
SUN Jian, YIN Ju-yuan, LI Tao-ning. Macroscopic traffic flow model of expressway on-ramp bottlenecks[J]. Journal of Traffic and Transportation Engineering, 2019, 19(3): 122-133. (in Chinese) doi: 10.3969/j.issn.1671-1637.2019.03.013
|
| [8] |
WANG Yi-bing, ZHAO Ming-ming, YU Xiang-hua, et al. Real-time joint traffic state and model parameter estimation on freeways with fixed sensors and connected vehicles: state-of-the-art overview, methods, and case studies[J]. Transportation Research Part C: Emerging Technologies, 2022, 134: 103444. doi: 10.1016/j.trc.2021.103444
|
| [9] |
ADACHER L, TIRIOLO M. A macroscopic model with the advantages of microscopic model: a review of cell transmission model's extensions for urban traffic networks[J]. Simulation Modelling Practice and Theory, 2018, 86: 102-119. doi: 10.1016/j.simpat.2018.05.003
|
| [10] |
SRIVASTAVA A, JIN Wen-long, LEBACQUE J P. A modified cell transmission model with realistic queue discharge features at signalized intersections[J]. Transportation Research Part B: Methodological, 2015, 81: 302-315. doi: 10.1016/j.trb.2015.05.013
|
| [11] |
RONCOLI C, PAPAGEORGIOU M, PAPAMICHAIL I. Traffic flow optimisation in presence of vehicle automation and communication systems—Part I: a first-order multi-lane model for motorway traffic[J]. Transportation Research Part C: Emerging Technologies, 2015, 57: 241-259. doi: 10.1016/j.trc.2015.06.014
|
| [12] |
HAN Yu, YUAN Yu-fei, HEGYI A, et al. New extended discrete first-order model to reproduce propagation of jam waves[J]. Transportation Research Record, 2016, 2560(1): 108-118. doi: 10.3141/2560-12
|
| [13] |
HAN Yu, HEGYI A, YUAN Yu-fei, et al. Resolving freeway jam waves by discrete first-order model-based predictive control of variable speed limits[J]. Transportation Research Part C: Emerging Technologies, 2017, 77: 405-420. doi: 10.1016/j.trc.2017.02.009
|
| [14] |
YUAN Kai, KNOOP V L, HOOGENDOORN S P. A kinematic wave model in Lagrangian coordinates incorporating capacity drop: application to homogeneous road stretches and discontinuities[J]. Physica A: Statistical Mechanics and Its Applications, 2017, 465: 472-485. doi: 10.1016/j.physa.2016.08.060
|
| [15] |
KONTORINAKI M, SPILIOPOULOU A, RONCOLI C, et al. First-order traffic flow models incorporating capacity drop: overview and real-data validation[J]. Transportation Research Part B: Methodological, 2017, 106: 52-75. doi: 10.1016/j.trb.2017.10.014
|
| [16] |
SHIRKE C, BHASKAR A, CHUNG E. Macroscopic modelling of arterial traffic: an extension to the cell transmission model[J]. Transportation Research Part C: Emerging Technologies, 2019, 105: 54-80. doi: 10.1016/j.trc.2019.05.033
|
| [17] |
LONG Jian-cheng. Studies on congestion propagation properties and dissipation control strategies of urban road traffic[D]. Beijing: Beijing Jiaotong University, 2009. (in Chinese)
|
| [18] |
YAO Kai-bin, LIN Pei-qun. An improved cell transmission model considering intersection factor[J]. Journal of Transportation Systems Engineering and Information Technology, 2017, 17(3): 105-111. (in Chinese) https://www.cnki.com.cn/Article/CJFDTOTAL-YSXT201703016.htm
|
| [19] |
HU Xiao-jian, WANG Wei, SHENG Hui. Urban traffic flow prediction with variable cell transmission model[J]. Journal of Transportation Systems Engineering and Information Technology, 2010, 10(4): 73-78. (in Chinese) doi: 10.3969/j.issn.1009-6744.2010.04.011
|
| [20] |
LIU Hao-xiang. Traffic controlling and optimizing at an intersection based on the cell transmission model[D]. Beijing: Beijing Jiaotong University, 2011. (in Chinese)
|
| [21] |
LI Zi-chuan. Modeling arterial signal optimization with enhanced cell transmission formulations[J]. Journal of Transportation Engineering, 2011, 137(7): 445-454. doi: 10.1061/(ASCE)TE.1943-5436.0000232
|
| [22] |
LIU Yue, CHANG G L. An arterial signal optimization model for intersections experiencing queue spillback and lane blockage[J]. Transportation Research Part C: Emerging Technologies, 2011, 19(1): 130-144. doi: 10.1016/j.trc.2010.04.005
|
| [23] |
TIRIOLO M, ADACHER L, CIPRIANI E. An urban traffic flow model to capture complex flow interactions among lane groups for signalized intersections[J]. Procedia—Social and Behavioral Sciences, 2014, 111: 839-848. doi: 10.1016/j.sbspro.2014.01.118
|
| [24] |
CAREY M, BALIJEPALLI C, WATLING D. Extending the cell transmission model to multiple lanes and lane-changing[J]. Networks and Spatial Economics, 2015, 15(3): 507-535. doi: 10.1007/s11067-013-9193-7
|
| [25] |
KIM Y, CHOI S, YEO H. Extended urban cell transmission model using agent-based modeling[J]. Procedia Computer Science, 2020, 170: 354-361. doi: 10.1016/j.procs.2020.03.058
|
| [26] |
KIM Y, CHOI S, PARK J, et al. Agent-based mesoscopic urban traffic simulation based on multi-lane cell transmission model[J]. Procedia Computer Science, 2019, 151: 240-247. doi: 10.1016/j.procs.2019.04.035
|
| [27] |
SUBRAVETI H H S N, KNOOP V L, VAN AREM B. First order multi-lane traffic flow model—an incentive based macroscopic model to represent lane change dynamics[J]. Transportmetrica B: Transport Dynamics, 2019, 7(1): 1758-1779. doi: 10.1080/21680566.2019.1700846
|
| [28] |
QIN Yan-yan, ZHANG Jian, CHEN Ling-zhi, et al. Cell transmission model of mixed traffic flow of manual-automated driving[J]. Journal of Traffic and Transportation Engineering, 2020, 20(2): 229-238. (in Chinese) https://www.cnki.com.cn/Article/CJFDTOTAL-JYGC202002019.htm
|
| [29] |
HAO Zhen-zhen, BOEL R, LI Zhi-wu. Model based urban traffic control, Part Ⅰ: local model and local model predictive controllers[J]. Transportation Research Part C: Emerging Technologies, 2018, 97: 61-81. doi: 10.1016/j.trc.2018.09.026
|
| [30] |
WU Ning. Modelling blockage probability and capacity of shared lanes at signalized intersections[J]. Procedia—Social and Behavioral Sciences, 2011, 16: 481-491. doi: 10.1016/j.sbspro.2011.04.469
|
| [31] |
ZHAO Shu-zhi, LIANG Shi-dong, LIU Hua-sheng, et al. CTM based real-time queue length estimation at signalized intersection[J]. Mathematical Problems in Engineering, 2015, 2015: 328712.
|
| [32] |
LONG Jian-cheng, GAO Zi-you, ZHAO Xiao-mei, et al. Urban traffic jam simulation based on the cell transmission model[J]. Networks and Spatial Economics, 2011, 11(1): 43-64.
|
| [1] | ZHANG Yu, TIAN Wan-li, WU Zhong-guang, CHEN Zong-wei, WANG Ji. Transmission mechanism of COVID-19 epidemic along traffic routes based on improved SEIR model[J]. Journal of Traffic and Transportation Engineering, 2020, 20(3): 150-158. doi: 10.19818/j.cnki.1671-1637.2020.03.014 |
| [2] | QIN Yan-yan, ZHANG Jian, CHEN Ling-zhi, LI Shu-qing, HE Zhao-yi, RAN Bin. Cell transmission model of mixed traffic flow of manual-automated driving[J]. Journal of Traffic and Transportation Engineering, 2020, 20(2): 229-238. doi: 10.19818/j.cnki.1671-1637.2020.02.019 |
| [3] | JI Yan-jie, GAO Liang-peng, CHEN Dan-dan, TANG Dou-nan. Operational benefit evaluation model of flexible parking incentive mechanism based on game theory[J]. Journal of Traffic and Transportation Engineering, 2019, 19(4): 161-170. doi: 10.19818/j.cnki.1671-1637.2019.04.015 |
| [4] | SUN Jian, YIN Ju-yuan, LI Tao-ning. Macroscopic traffic flow model of expressway on-ramp bottlenecks[J]. Journal of Traffic and Transportation Engineering, 2019, 19(3): 122-133. doi: 10.19818/j.cnki.1671-1637.2019.03.013 |
| [5] | LIU Shuai, TANG Bo-ming, CHEN Jian. Multi-mode competitiveness game model in regional comprehensive passenger transportation corridor[J]. Journal of Traffic and Transportation Engineering, 2017, 17(2): 136-142. |
| [6] | YANG Dong-xia, JU Yong-feng. Multi-objective optimization method of traffic signal based on CTM[J]. Journal of Traffic and Transportation Engineering, 2011, 11(3): 105-111. doi: 10.19818/j.cnki.1671-1637.2011.03.018 |
| [7] | YANG Zhao-sheng, GAO Xue-ying, SUN Di. Cellular automata model of urban traffic emergency evacuation and rescue[J]. Journal of Traffic and Transportation Engineering, 2011, 11(2): 114-120. doi: 10.19818/j.cnki.1671-1637.2011.02.019 |
| [8] | YIN Ming, SHENG Zi-ning, DING Yi-zhong, WANG Xue-feng. Two-part pricing model of container liner based on gross mass of individual container[J]. Journal of Traffic and Transportation Engineering, 2010, 10(3): 101-109. doi: 10.19818/j.cnki.1671-1637.2010.03.018 |
| [9] | LI Ai-zeng, WANG Wei, LI Wen-quan. Running characteristics of equivalent people group at urban road intersection[J]. Journal of Traffic and Transportation Engineering, 2010, 10(3): 84-89. doi: 10.19818/j.cnki.1671-1637.2010.03.015 |
| [10] | ZHANG Hua-xin. Dynamic congestion pricing model of combined travel with elastic demand in multi-class network[J]. Journal of Traffic and Transportation Engineering, 2009, 9(5): 99-105. doi: 10.19818/j.cnki.1671-1637.2009.05.018 |
| [11] | LI Jin-lin, XU Li-ping. Capacity control models and approaches in airline network[J]. Journal of Traffic and Transportation Engineering, 2009, 9(1): 100-108. doi: 10.19818/j.cnki.1671-1637.2009.01.021 |
| [12] | WU Rong-zhen, ZHAI Dong-dong, XI En-chong, LI Li. Evaluation model of satisfaction degree for urban public transit service[J]. Journal of Traffic and Transportation Engineering, 2009, 9(4): 65-70. doi: 10.19818/j.cnki.1671-1637.2009.04.013 |
| [13] | CHEN Qian, WANG Wei. Spacial and temporal influences of emergency on traffic flow in large-scale activity[J]. Journal of Traffic and Transportation Engineering, 2009, 9(3): 81-85. doi: 10.19818/j.cnki.1671-1637.2009.03.016 |
| [14] | AN Shi, CUI Jian-xun, WANG Jian. Hybrid evacuation population estimation model based on fuzzy logic and discrete choice model[J]. Journal of Traffic and Transportation Engineering, 2009, 9(5): 78-82. doi: 10.19818/j.cnki.1671-1637.2009.05.014 |
| [15] | Shi Xin, Huang Fang. Sustainable development model of shipping and water environment in Yangtze River valley[J]. Journal of Traffic and Transportation Engineering, 2007, 7(1): 21-25. |
| [16] | WANG Xiao-ping, QI Huan, XIAO Heng-hui, ZHANG Xiao-pan, HU Yang, FENG Xiao-jian. Co-scheduling model of Three Gorges-Gezhou Dam based on series queuing network[J]. Journal of Traffic and Transportation Engineering, 2006, 6(3): 82-86. |
| [17] | GAO Qiang, ZHU Jin-fu, CHEN Ke-jia. Multi-leg seat inventory control model for airline revenue management[J]. Journal of Traffic and Transportation Engineering, 2005, 5(4): 82-85. |
| [18] | SUN Hong, DU Wen. Mathematical programming model of aircraft assignment[J]. Journal of Traffic and Transportation Engineering, 2004, 4(3): 117-120. |
| [19] | WANG Wei. Scheme design technique of urban traffic management planning[J]. Journal of Traffic and Transportation Engineering, 2003, 3(2): 57-60. |
| [20] | JIA Shou-zhen, XU Liang-neng, DONG Jun-qi, LIU Rui, LI Xiao-yan. The Application of Interpretation and Structure Model(ISM) in Urban Traffic Management——Cases Study of Xi′an and Hanzhong in Shaanxi Province[J]. Journal of Traffic and Transportation Engineering, 2001, 1(3): 95-99. |
| 1. | 梁海军,骆春阳,程万臻,于承玉. 基于元胞传输模型的终端区交通流特性研究. 航空计算技术. 2024(02): 16-19+25 .  | |
| 2. | 黄玮,张轩宇,李世昌,赵靖. 基于模型偏差学习的交通信号自适应优化方法. 铁道科学与工程学报. 2024(06): 2229-2240 . |

Figures(10) / Tables(5)
Copyright《Journal of Traffic and Transportation Engineering》编辑部陕ICP备05001904号-1
Address :Editorial Department of Journal of Traffic and Transportation Engineering, Chang 'an University, Middle Section of South Second Ring Road, Xi 'an, Shaanxi(710064) Tel:029-82334388 Email:jygc@chd.edu.cn
All visit:1713335Today's visit:1052
Supported by:
Beijing Renhe Information Technology Co. Ltd

HUANG Wei, HU Yang. Cell transmission model considering queuing characteristics of channelized zone at intersections[J]. Journal of Traffic and Transportation Engineering, 2023, 23(2): 212-224. doi: 10.19818/j.cnki.1671-1637.2023.02.015

| 影响因素 | 标准误差 | 拟合优度 |
| b | 0.047 | 0.96 |
| im | 0.025 | |
| p | 0.024 |
DownLoad:
CSV
| 影响因素 | 纵坡坡度/% | 超高渐变率 | 降雨强度/(mm·h-1) |
| 取值范围 | 0.3~3.0 | 1/330~1/200 | 20~80 |
DownLoad:
CSV
| 降雨强度/(mm·h-1) | 纵坡坡度/% | 超高渐变率 | 滑水速度/(km·h-1) |
| 20 | 0.3 | 1/330 | 110.0 |
| 0.3 | 1/200 | 115.5 | |
| 3.0 | 1/330 | 108.5 | |
| 3.0 | 1/200 | 112.9 | |
| 80 | 0.3 | 1/330 | 101.6 |
| 0.3 | 1/200 | 104.3 | |
| 3.0 | 1/330 | 99.3 | |
| 3.0 | 1/200 | 102.0 |
DownLoad:
CSV
| 降雨强度/(mm·h-1) | 纵坡坡度/% | 超高渐变率 | ||||
| 1/330 | 1/300 | 1/250 | 1/225 | 1/200 | ||
| 20 | 0.3 | 110 | 110 | 110 | 115 | 115 |
| 1.0 | 110 | 110 | 110 | 110 | 110 | |
| 2.0 | 105 | 105 | 110 | 110 | 110 | |
| 3.0 | 105 | 105 | 105 | 110 | 110 | |
| 40 | 0.3 | 105 | 105 | 105 | 105 | 105 |
| 1.0 | 100 | 100 | 105 | 105 | 105 | |
| 2.0 | 100 | 100 | 100 | 100 | 105 | |
| 3.0 | 100 | 100 | 100 | 100 | 100 | |
| 60 | 0.3 | 100 | 100 | 100 | 100 | 100 |
| 1.0 | 100 | 100 | 100 | 100 | 100 | |
| 2.0 | 100 | 100 | 100 | 100 | 100 | |
| 3.0 | 95 | 100 | 100 | 100 | 100 | |
| 80 | 0.3 | 100 | 100 | 100 | 100 | 100 |
| 1.0 | 100 | 100 | 100 | 100 | 100 | |
| 2.0 | 95 | 100 | 100 | 100 | 100 | |
| 3.0 | 95 | 95 | 100 | 100 | 100 | |
DownLoad:
CSV
| 影响因素 | 标准误差 | 拟合优度 |
| b | 0.047 | 0.96 |
| im | 0.025 | |
| p | 0.024 |
| 影响因素 | 纵坡坡度/% | 超高渐变率 | 降雨强度/(mm·h-1) |
| 取值范围 | 0.3~3.0 | 1/330~1/200 | 20~80 |
| 降雨强度/(mm·h-1) | 纵坡坡度/% | 超高渐变率 | 滑水速度/(km·h-1) |
| 20 | 0.3 | 1/330 | 110.0 |
| 0.3 | 1/200 | 115.5 | |
| 3.0 | 1/330 | 108.5 | |
| 3.0 | 1/200 | 112.9 | |
| 80 | 0.3 | 1/330 | 101.6 |
| 0.3 | 1/200 | 104.3 | |
| 3.0 | 1/330 | 99.3 | |
| 3.0 | 1/200 | 102.0 |
| 降雨强度/(mm·h-1) | 纵坡坡度/% | 超高渐变率 | ||||
| 1/330 | 1/300 | 1/250 | 1/225 | 1/200 | ||
| 20 | 0.3 | 110 | 110 | 110 | 115 | 115 |
| 1.0 | 110 | 110 | 110 | 110 | 110 | |
| 2.0 | 105 | 105 | 110 | 110 | 110 | |
| 3.0 | 105 | 105 | 105 | 110 | 110 | |
| 40 | 0.3 | 105 | 105 | 105 | 105 | 105 |
| 1.0 | 100 | 100 | 105 | 105 | 105 | |
| 2.0 | 100 | 100 | 100 | 100 | 105 | |
| 3.0 | 100 | 100 | 100 | 100 | 100 | |
| 60 | 0.3 | 100 | 100 | 100 | 100 | 100 |
| 1.0 | 100 | 100 | 100 | 100 | 100 | |
| 2.0 | 100 | 100 | 100 | 100 | 100 | |
| 3.0 | 95 | 100 | 100 | 100 | 100 | |
| 80 | 0.3 | 100 | 100 | 100 | 100 | 100 |
| 1.0 | 100 | 100 | 100 | 100 | 100 | |
| 2.0 | 95 | 100 | 100 | 100 | 100 | |
| 3.0 | 95 | 95 | 100 | 100 | 100 | |
 DownLoad:

 DownLoad:


